
Key Highlights
- Crude oil price is facing a strong resistance near $57.00 against the US dollar.
- A major bearish trend is forming with resistance near $57.10 on the 4-hours chart of XTI/USD.
- The US crude oil inventories increased by 1.6 million barrels in the week ending August 9, 2019.
- The US Retail Sales in July 2019 might increase 0.3% (MoM), less than the last +0.4%.
Crude Oil Price Technical Analysis
After testing the $50.50 support, crude oil price recovered nicely above $55.00 against the US Dollar. However, the price is facing a couple of key resistances near $57.00 and $57.50.
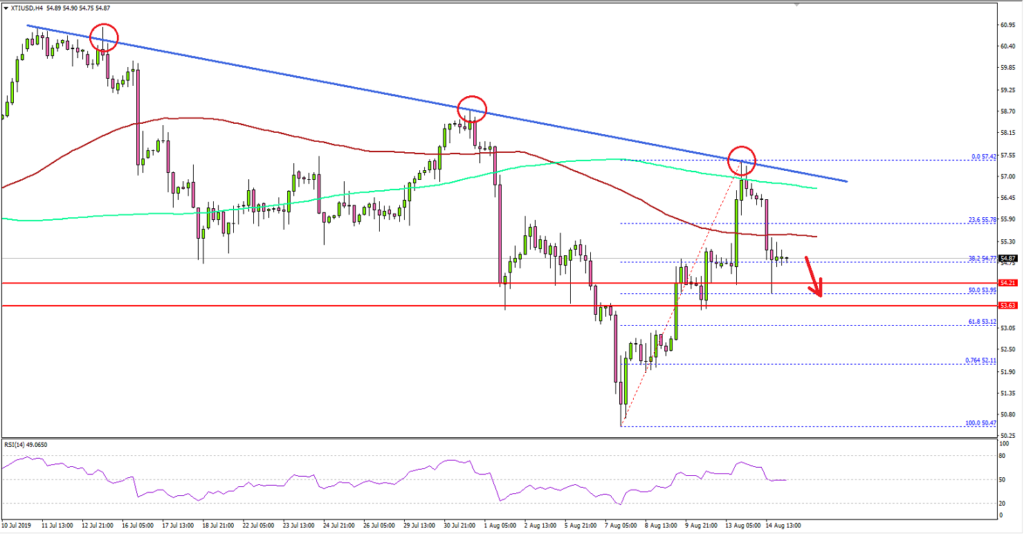
Looking at the 4-hours chart of XTI/USD, the price climbed higher from the $50.47 swing low this month. It broke the $54.00 and $55.00 support levels. Moreover, there was a break above the $56.50 resistance plus the 100 (red) simple moving average (4-hours).
However, the upward move was capped by the $57.50 resistance area and the 200 (green) simple moving average (4-hours). More importantly, there is a major bearish trend is forming with resistance near $57.10 on the same chart.
The price is currently declining below $56.00 plus the 23.6% Fib retracement level of the upward move from the $50.47 low to $57.42 high. On the downside, there are strong supports near the $54.20 and $53.60 levels.
The current price action suggests more downsides if there is a successful break below the $54.00 support area and the 50% Fib retracement level of the upward move from the $50.47 low to $57.42 high.
In the mentioned case, the price could revisit the $52.00 support. Conversely, the price must climb above the $57.00 and $57.20 resistance levels to continue higher towards $60.00.
Fundamentally, the US crude oil stockpiles report for the week ending August 9, 2019 was released recently by the Energy Information Administration. The market was looking for a decline in crude oil inventories by around 2.761 million barrels.
However, the actual result was the opposite as the US crude oil inventories increased by 1.6 million barrels. However, it was less than the last increase of 2.385 million barrels.
Looking at major pairs, EUR/USD failed to gain strength above 1.1200, and GBP/USD is trading in a bearish zone below the 1.2200 resistance area.
Economic Releases to Watch Today
- UK Retail Sales July 2019 (YoY) – Forecast +2.0%, versus +3.8% previous.
- UK Retail Sales July 2019 (MoM) – Forecast -0.1%, versus +1.0% previous.
- US Retail Sales July 2019 (MoM) – Forecast +0.3%, versus +0.4% previous.
- US Initial Jobless Claims – Forecast 214K, versus 209K previous.
- US Industrial Production July 2019 (MoM) – Forecast +0.2%, versus 0% previous.


