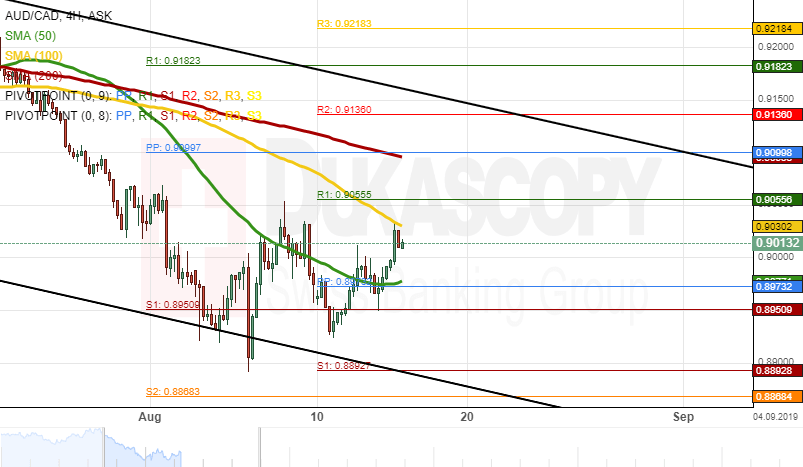
During last week trading sessions, the Australian Dollar versus the Canadian Dollar tried to breach the long-term descending channel. As apparent on the 4(H) chart, the currency pair reversed north from its lower boundary at 0.8802.
The exchange rate is currently testing a resistance level formed by the 100– hour simple moving average at 0.9034.
If the resistance level holds, a decline towards a support cluster at 0.8868 could be expected in the short term.
However, if the currency exchange rate passes the 100– hour SMA, bullish traders could aim for the upper line of the descending channel pattern at 0.9150 during next week’s trading sessions.