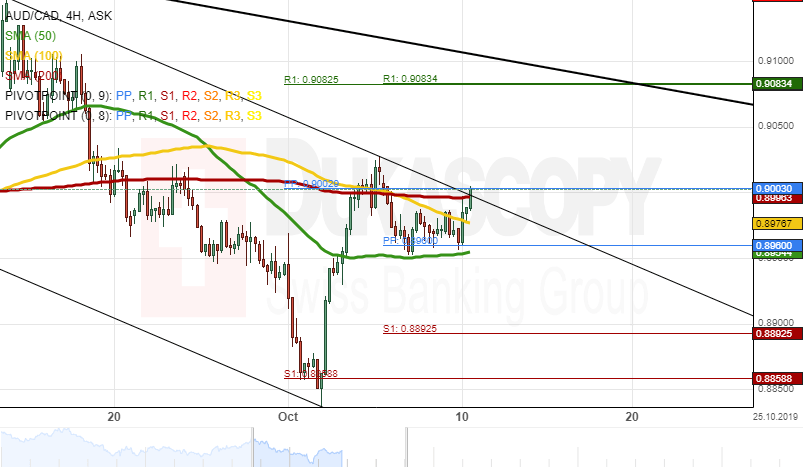
The Aussie has been appreciating against the Canadian Dollar since the beginning of October after the exchange rate reversed north from a support level formed by the monthly S1 at 0.8858. The pair is currently trading between the 50-, 100- and 200-period SMAs.
Everything being equal, some potential upside movement could prevail in the nearest future. Bulls might pressure the AUD/CAD pair towards the resistance cluster at 0.9083.
However, the currency exchange rate needs to surpass the 200– period SMA and the monthly PP at 0.9003. If the resistance cluster holds, the currency pair might make a brief retracement down during the following trading sessions.