
The EUR/USD currency pair
Technical indicators of the currency pair:
Prev Open: 1.11242
Open: 1.11605
% chg. over the last day: +0.42
Day’s range: 1.11495 – 1.11633
52 wk range: 1.0884 – 1.1623
The EUR/USD currency pair continues to show a positive trend. On Friday, the trading instrument updated the local highs once again. Currently, EUR/USD quotes are consolidating. EUR found resistance at 1.11700. 1.11350 is already a mirror support. The technical picture signals further growth. We recommend that you up-to-date with the information regarding the settlement of the trade conflict between the US and China, as well as the Brexit process. Open positions from key levels.
The Economic News Feed for 21.10.2019 is calm.
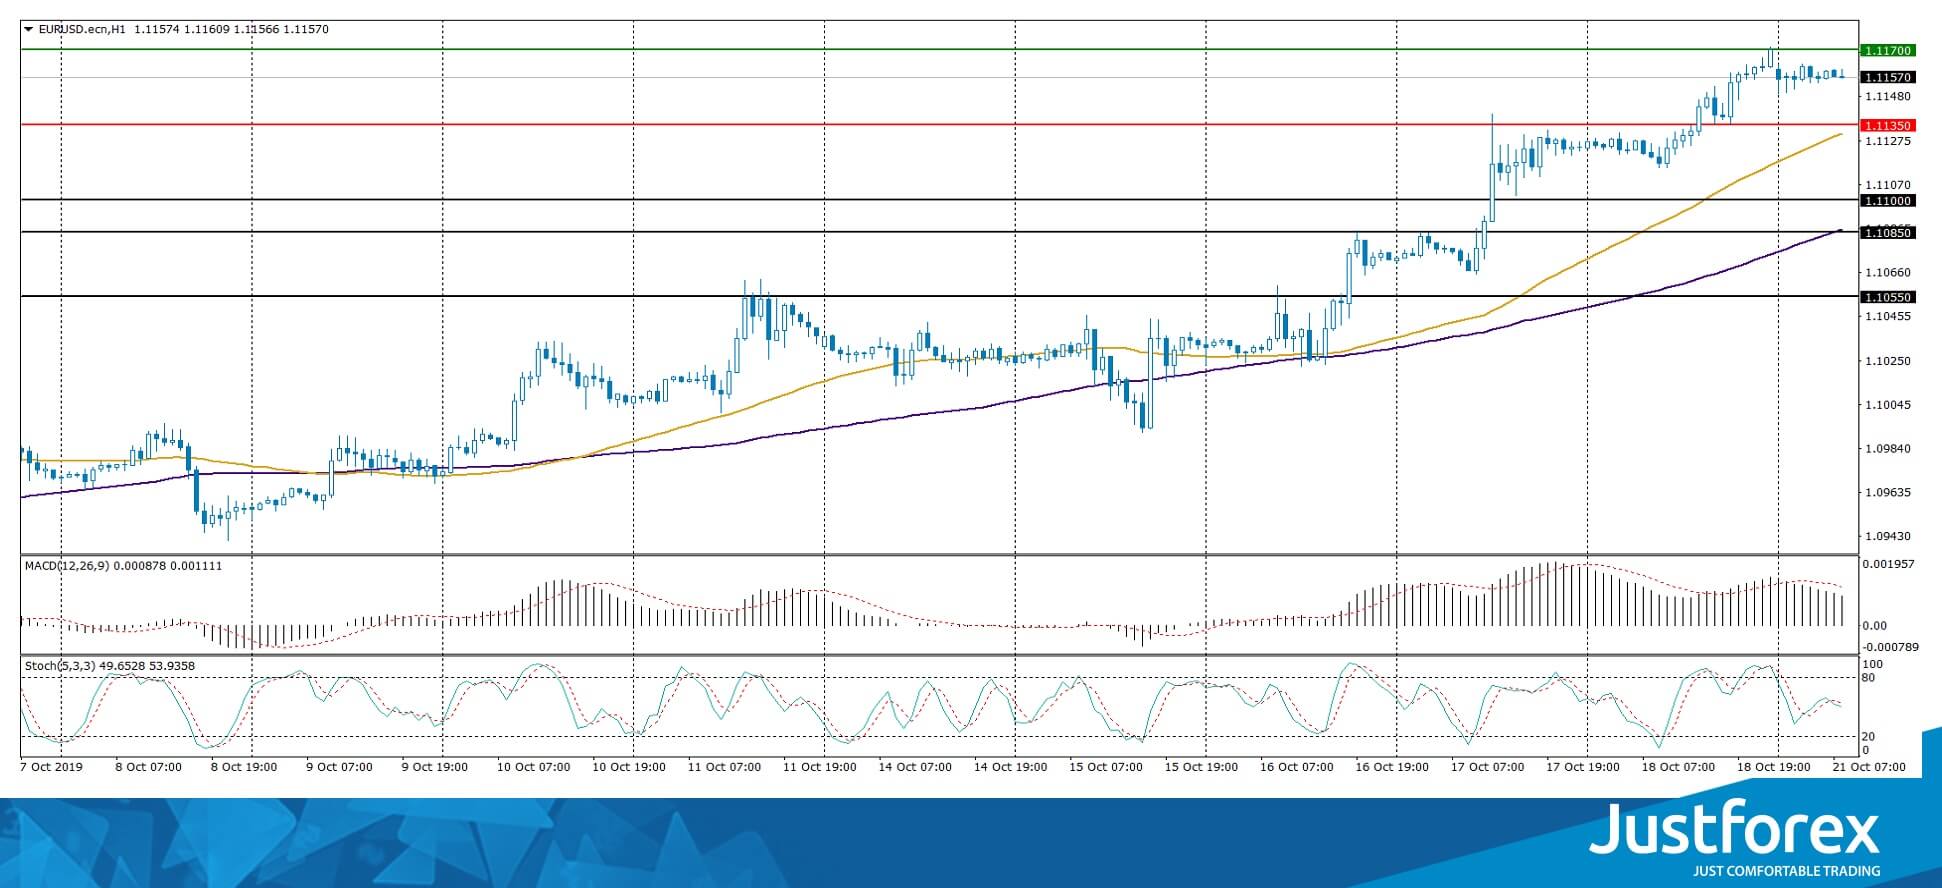
The price fixed above 50 MA and 100 MA, which signals the strength of buyers.
The MACD histogram is in the positive zone, but below the signal line, which gives a weak signal to buy EUR/USD.
Stochastic Oscillator is in the neutral zone, the %K line crossed the %D line. There are no signals at the moment.
Trading recommendations
Support levels: 1.11350, 1.11000, 1.10850
Resistance levels: 1.11700, 1.12000
If the price consolidates above the resistance level of 1.11700, 1.12000-1.12200.
Alternatively, the quotes can descend toward 1.11000.
The GBP/USD currency pair
Technical indicators of the currency pair:
Prev Open: 1.28907
Open: 1.29488
% chg. over the last day: -0.54
Day’s range: 1.28741 – 1.29502
52 wk range: 1.1959 – 1.3385
The GBP/USD currency pair stabilized after a protracted rally. GBP is currently consolidating. The key support and resistance levels are 1.28550 and 1.29800, respectively. Market participants are waiting for new information regarding the Brexit process. Voting on an agreement reached last week between London and Brussels is postponed until Monday. British lawmakers on Saturday supported the amendment, requiring Boris Johnson to request the EU to postpone Brexit. We recommend opening positions from key levels.
The Economic News Feed for 21.10.2019 is calm.
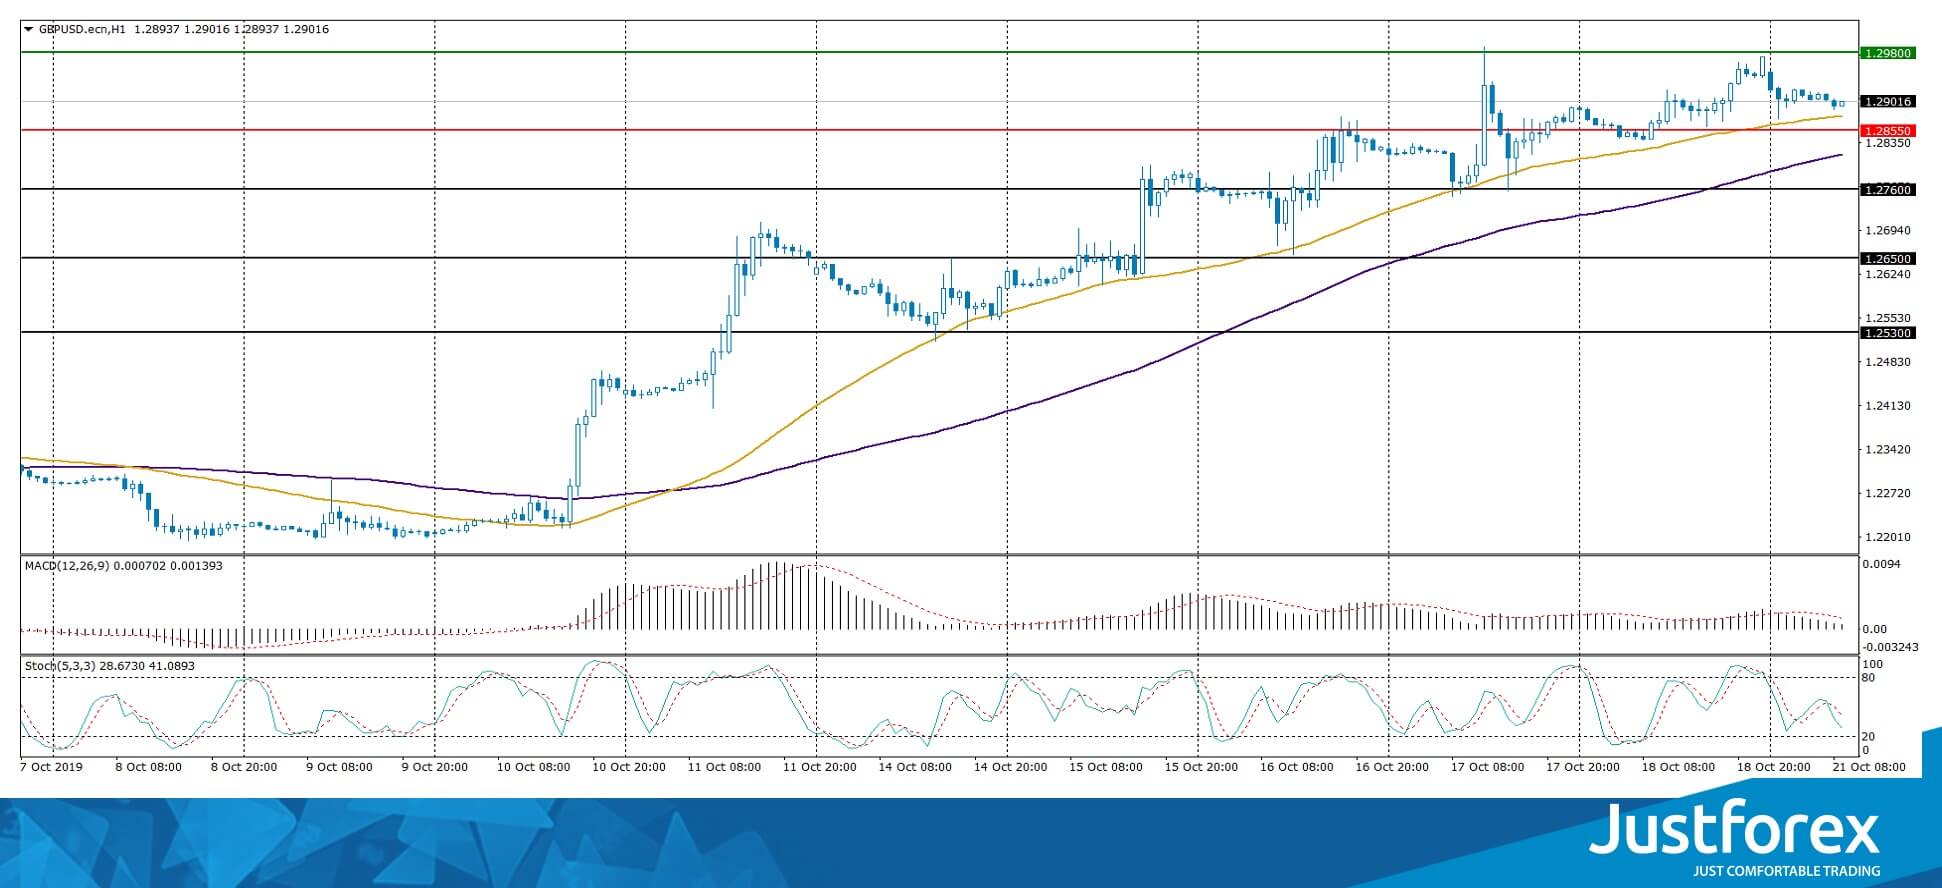
Indicators do not give accurate signals: the price is consolidating near 50 MA.
The MACD histogram has approached 0.
Stochastic Oscillator is in the neutral zone, the %K line is below the %D line, which indicates a bearish sentiment.
Trading recommendations
Support levels: 1.28550, 1.27600, 1.26500
Resistance levels: 1.29800, 1.30500
If the price consolidates above the resistance level of 1.29800, expect further growth toward 1.30400-1.30600.
Alternatively, the quotes could reduce toward 1.27600-1.27400.
The USD/CAD currency pair
Technical indicators of the currency pair:
Prev Open: 1.31352
Open: 1.31330
% chg. over the last day: -0.02
Day’s range: 1.31266 – 1.31382
52 wk range: 1.2727 – 1.3664
The USD/CAD currency pair is dominated by bearish sentiment. The trading instrument has reached the three-month lows. CAD is currently consolidating. The local support and resistance levels are: 1.31200 and 1.31500, respectively. USD/CAD quotes have the potential to further decline. We recommend that you pay attention to the dynamics of prices of “black gold”. Positions must be opened from key levels.
The Economic News Feed for 21.10.2019 is calm.
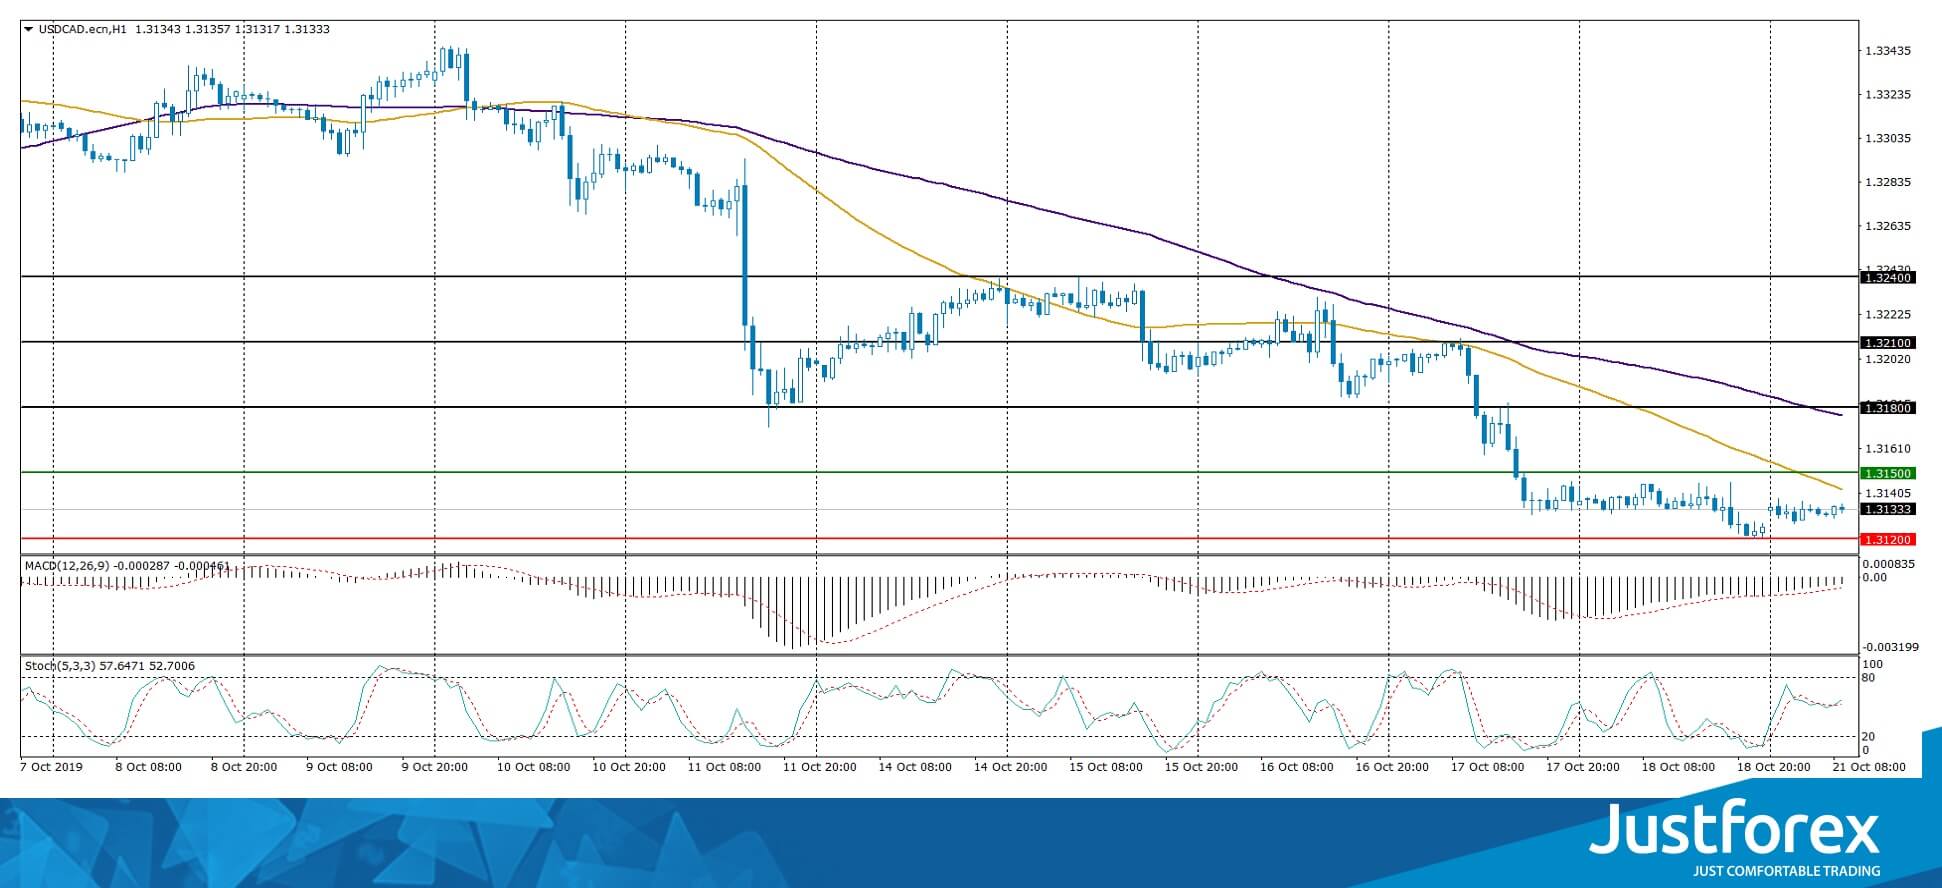
Indicators point to the strength of sellers: the price has fixed below 50 MA and 100 MA.
The MACD histogram is in the negative zone, but above the signal line, which gives a weak signal to sell USD/CAD.
The Stochastic Oscillator is in the neutral zone, the %K line crossed the %D line. There are no signals at the moment.
Trading recommendations
Support levels: 1.31200, 1.31000
Resistance levels: 1.31500, 1.31800, 1.32100
If the price consolidates below 1.31200, expect a further drop toward 1.30800-1.30600.
Alternatively, the quotes could grow toward 1.31800-1.32000.
The USD/JPY currency pair
Technical indicators of the currency pair:
Prev Open: 108.648
Open: 108.434
% chg. over the last day: -0.08
Day’s range: 108.289 – 108.554
52 wk range: 104.97 – 114.56
The technical picture on the USD/JPY currency pair is still ambiguous. The trading instrument is in lateral movement. Investors expect additional drivers. At the moment, the local support and resistance levels are 108.300 and 108.650, respectively. In the near future, technical correction of the USD/JPY quotes is highly possible. We recommend that you pay attention to the dynamics of the yield of US government securities. Positions must be opened from key levels.
During the Asian trading session, Japan published a weak report on the trading balance.
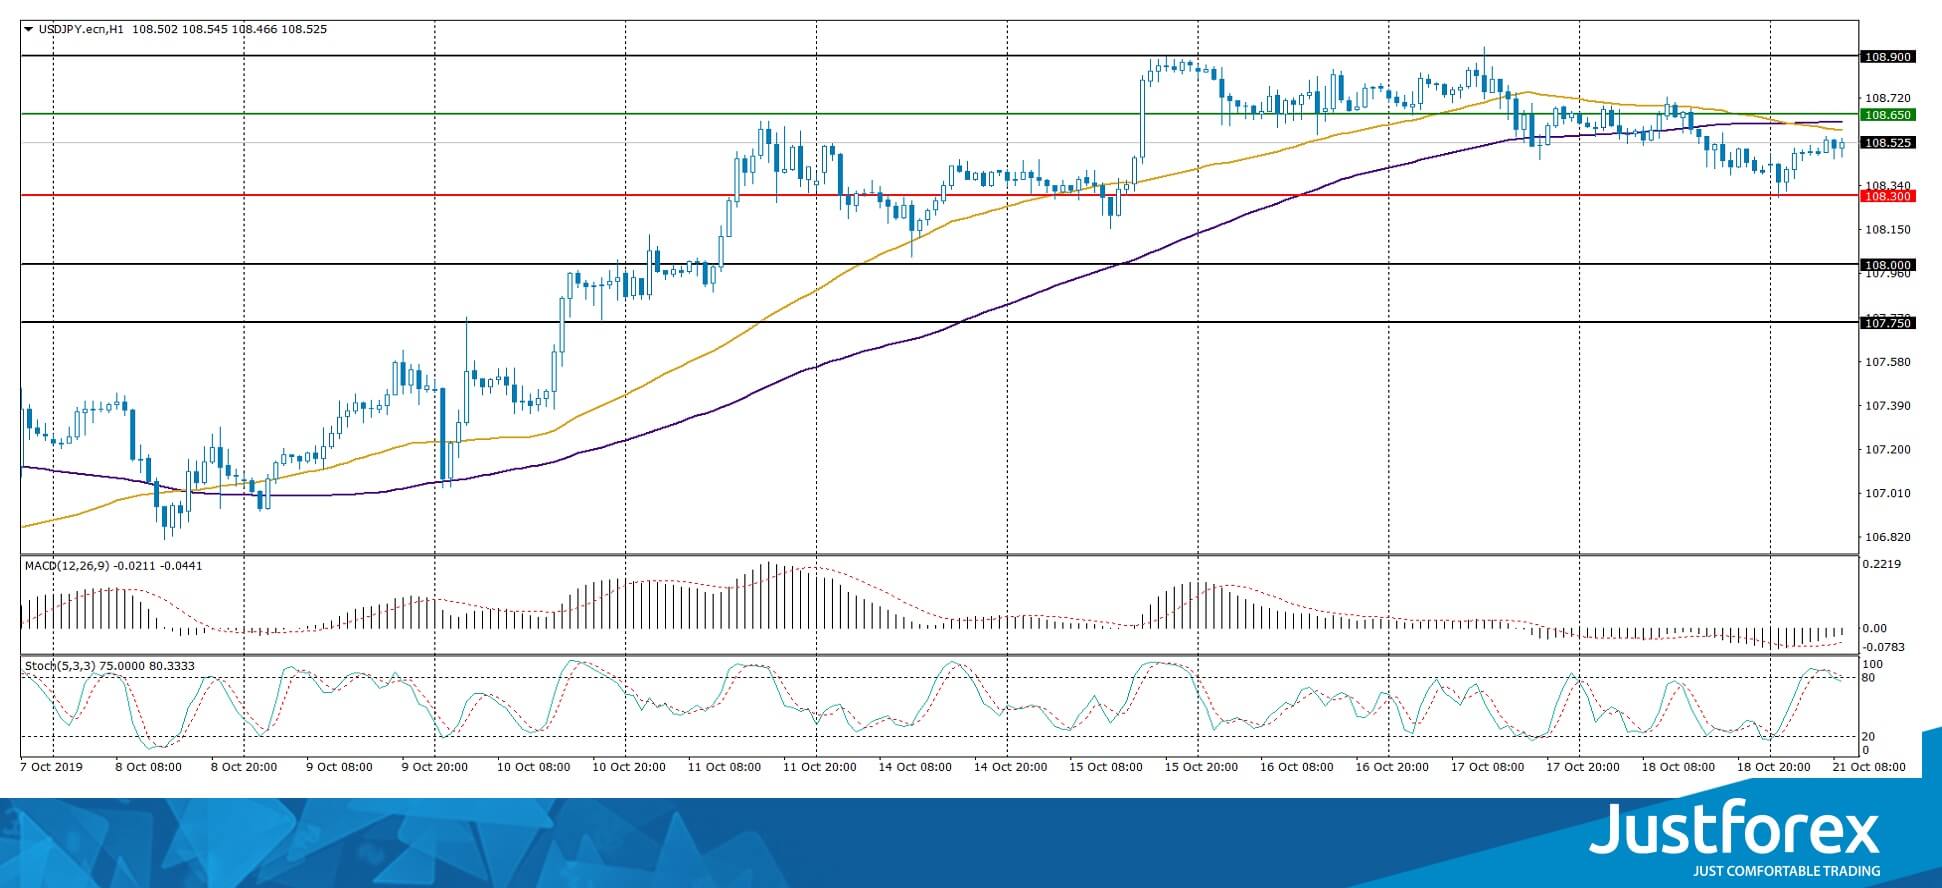
Indicators do not give accurate signals: 50 MA crossed 100 MA.
The MACD histogram is in the negative zone but above the singal line, which gives a weak signal for selling USD/JPY.
The Stochastic Oscillator is in the overbought zone, the %K line crossed the %D line. There are no signals at the moment.
Trading recommendations
Support levels: 108.300, 108.000, 107.750
Resistance levels: 108.650, 108.900
If the price consolidates above 108.650, expect further growth of the USD/JPY toward 108.900-109.200.
Alternatively, the quotes could decrease toward 108.000-107.800.


