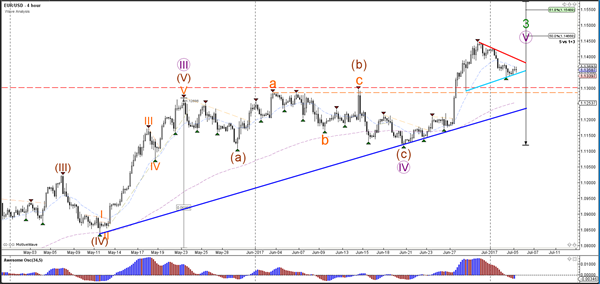
Currency pair EUR/USD
The EUR/USD pullback is creating a contracting triangle chart pattern via the trend lines (blue/red). A bullish break above resistance (red) could see price approach the Fibonacci targets of wave 5 (purple) which could complete wave 3 (green). A bearish break could see price retest the broken resistance levels.
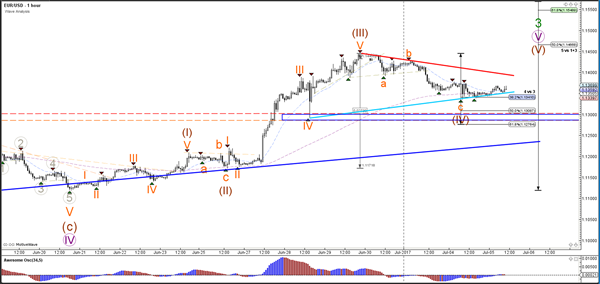
The EUR/USD is still completing its ABC zigzag correction (orange) within wave 4 (brown). The Fibonacci levels of wave 4 vs 3 (brown) plus the broken resistance levels (blue box) are a key support zone. A bullish bounce confirms the wave 4 whereas a bearish beak invalidates it.
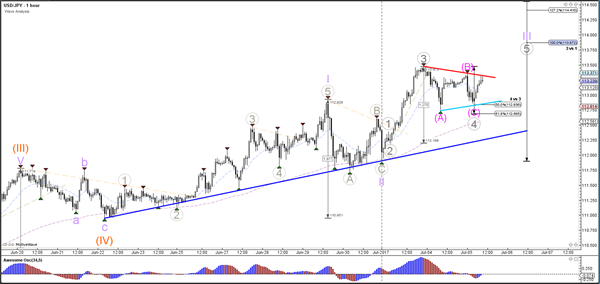
Currency pair USD/JPY
The USD/JPY uptrend is still intact as long as price stays above the support trend line (blue). A new higher high could indicate a bullish continuation towards the Fibonacci targets of wave 3 (purple) and wave 5 (orange).
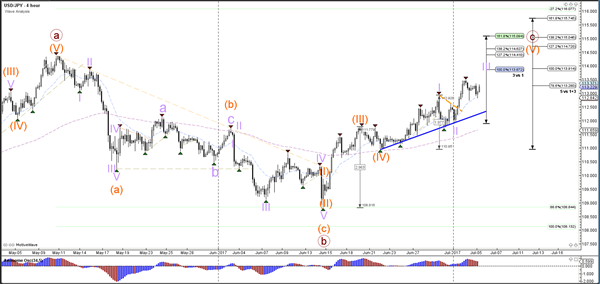
The USD/JPY is in a contracting triangle chart pattern (blue/red lines) after completing an ABC correction (pink). A break below the 61.8% invalidates the wave 4 (grey) whereas a bullish break confirms the wave 5 (grey).
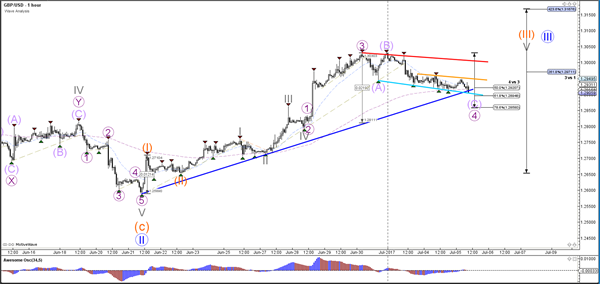
Currency pair GBP/USD
The GBP/USD bullish momentum is losing steam as price is falling lower. The resistance level (red) could be proving to be too tough to break. The support trend lines however could still provide a potential turn around (green/blue).
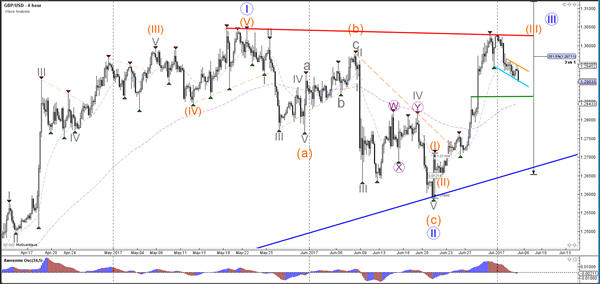
The GBP/USD is attempting to break below the support levels (blue) and 61.8% Fibonacci of wave 4 vs 3, which would invalidate the retracement.