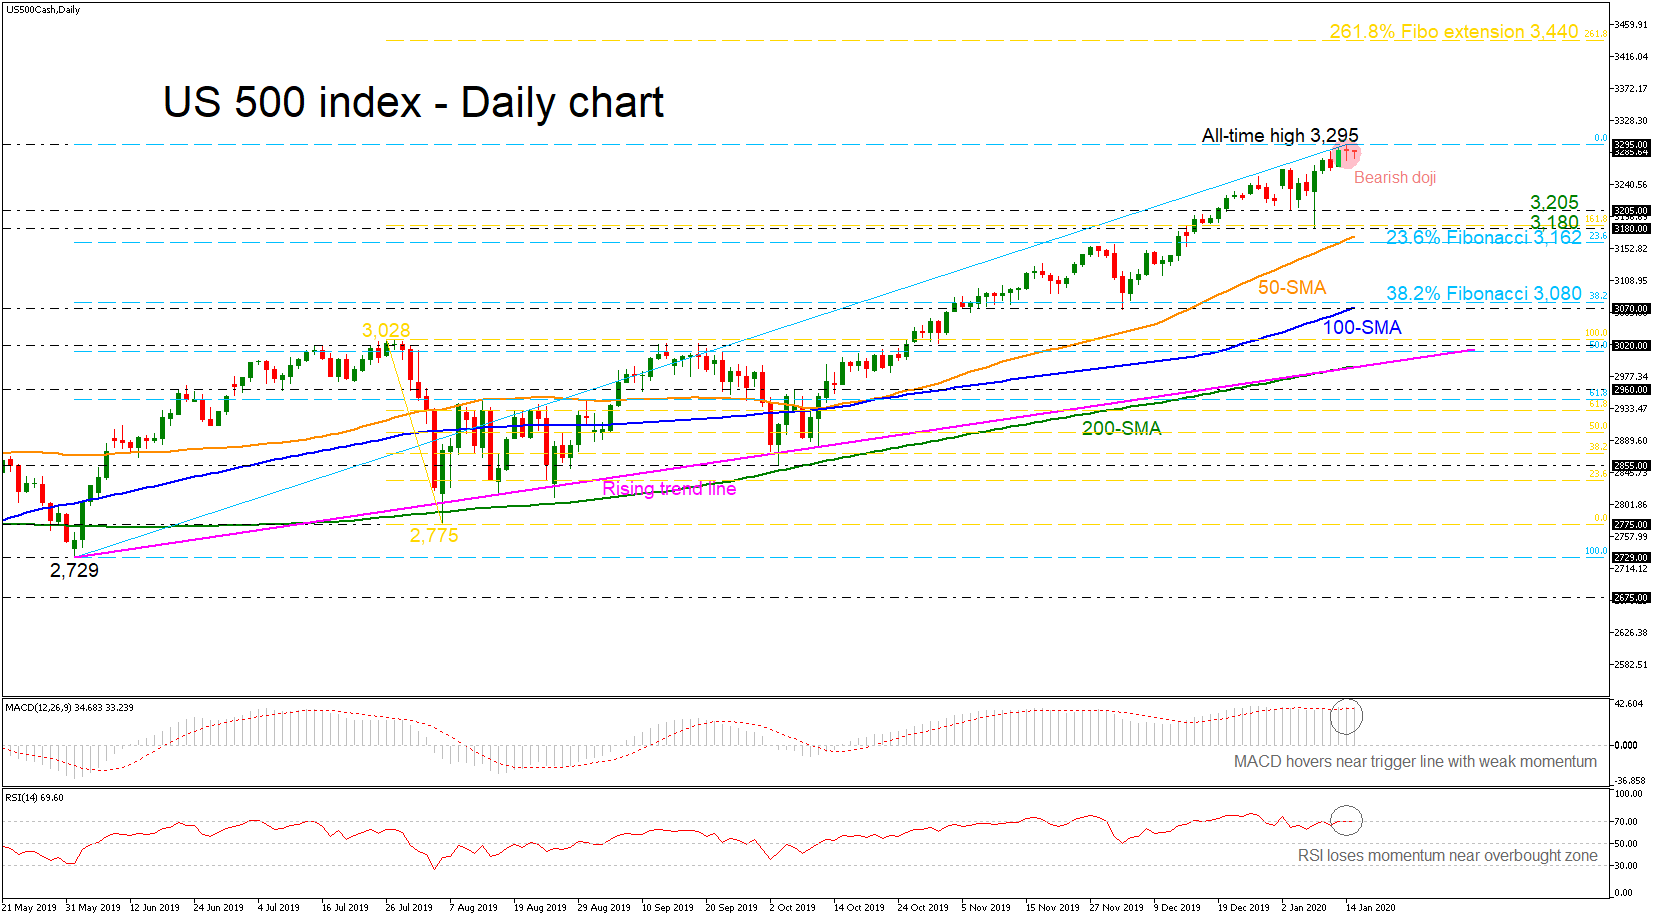
The US 500 stock index (cash) seems to be completing a bearish doji star formation if it ends the day in the red. The price recorded a fresh all-time high of 3,295 on Tuesday but the overbought conditions have already been detected as the RSI has been flattening near the 70 level over the last month. The slowdown in the MACD further increases the case for a downside correction or at least for some stabilization.
Traders would like to see the price retreating lower towards the next immediate support of 3,205 and 3,180. Below that, the 23.6% Fibonacci retracement level of the upward wave from 2,729 and 3,295 of 3,162 could come in focus but before that, the price needs to slip below the 50-day simple moving average (SMA).
In case the bulls dominate the market, they may next look for fresh all-time highs somewhere near the 261.8% Fibonacci extension level of the downleg from 3,028 to 2,775 of 3,440.
Overall, the US500 stock index could face some downside pressure in the near-term but overall the market is expected to hold its upside direction.