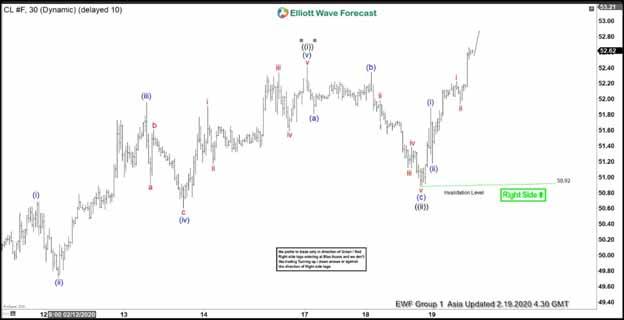
Short term Elliott wave view in Oil (CL_F) suggests the rally from February 5 low shows a 5 swing bullish sequence. We label the rally as an impulse Elliott Wave structure with a nest. Up from February 5 low, wave 1 ended at 52.2 and wave 2 pullback ended at 49.42. Wave 3 higher is in progress and nesting in another 5 waves. Up from wave 2 low at 42.42, wave ((i)) ended at 52.41 as a diagonal. Wave (i) ended at 50.69 and wave (ii) pullback ended at 49.71. Wave (iii) ended at 51.96, wave (iv) ended at 50.60 and the final leg wave (v) of ((i)) ended at 52.41.
Pullback in wave ((ii)) ended t 50.9 as a zigzag. Wave (a) of ((ii)) ended at 51.81, wave (b) of ((ii)) ended at 52.34, and wave (c) of ((ii)) ended at 50.90. Oil has broken above wave ((i)) at 52.41 suggesting the next leg higher wave ((iii)) has started. Near term, while dips stay above 50.90, expect Oil to extend higher. Potential target higher is 100% Fibonacci extension of wave ((i)) – ((ii)) which comes at $53.9 – 55.8.
Oil (CL_F) 1 Hour Elliott Wave Chart