
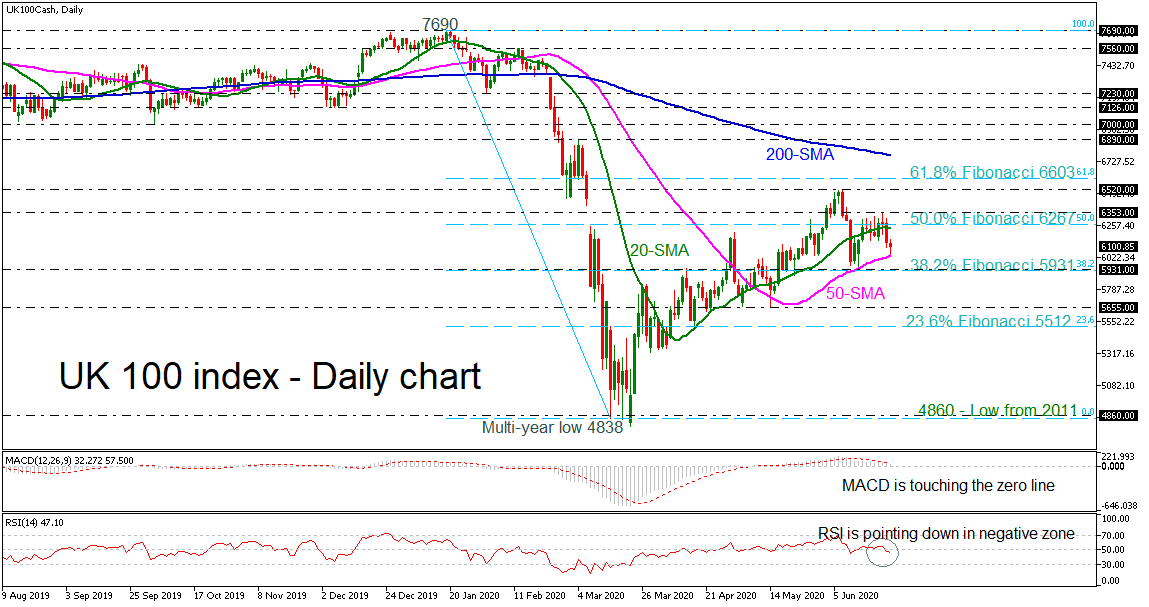
The UK 100 index (Cash) is pausing its downside movement around the 50-day simple moving average (SMA) shifting the very short-term picture to the downside.
According to the momentum indicators, the MACD is moving beneath its trigger line, marginally above the zero level, while the RSI dropped into the negative zone and is pointing south.
A clear move below the 50-day SMA could send prices towards the 38.2% Fibonacci retracement level of the downward wave from 7,690 to 4,860 at 5,931. Further weakening could drive the market to 5,655, losing some of the ground that it created in the preceding weeks. Slightly below this level could hit the 23.6% Fibonacci of 5,512.
Alternatively, a surge to the 20-day SMA, which stands near the 50.0% Fibonacci of 6,267 could give the opportunity to test the 6,353 and the 6,520 resistance, achieved on June 9. Above the latter level, traders would have eyes for the 61.8% Fibonacci of 6,603.
In brief, the UK 100 index has been in an uptrend over the last three months and this outlook may change if the price falls below the 23.6% Fibo of 5,512.


