EUR/USD
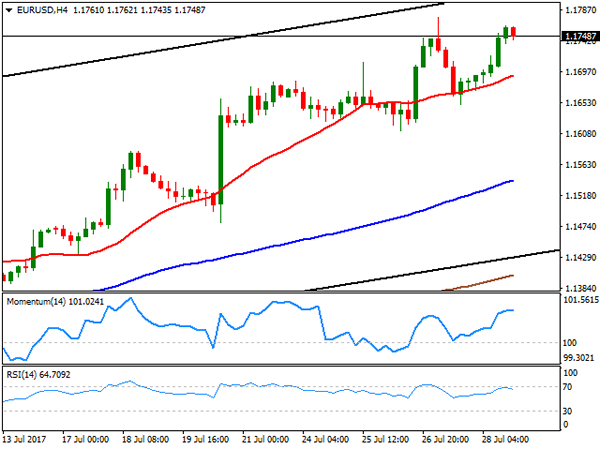
The EUR/USD pair closed the week at 1.1748, its highest settlement since January 2015, on fresh signs of decreasing inflationary pressures in the US. On Friday, the country released its advanced Q2 GDP figures, which showed that the economy expanded at a healthy annual rate of 2.6%, well above a previously revised 1.2% and in line with market’s expectations, but the GDP price index for the three months to June resulted at 1.0%, down from previous 2.0% and the expected 1.3%. Also, the core PCE price index advanced by just 0.3% in the quarter, down from previous 2.2% and denting further expectations of a tighter monetary policy coming from the Fed. Additionally, German’s preliminary July inflation came better-than-expected, growing annually by 1.7%, somehow increasing the pressure over the ECB on a sooner decision on tapering. The imbalance between central banks keeps shrinking, whilst the US in undermined by local political jitters, fundamentally poising a risk towards the upside.
The pair closed not far from a year high of 1.1776, the immediate resistance for this Monday, and the daily chart for the pair shows that technical indicators have resumed their advances after a modest correction, holding within overbought territory. The pair is also well above bullish moving averages in the daily chart, all of which favors additional gains. The pair also advanced for a third consecutive week, which increases the risk of a downward correction in the starting one, not expected to be significant at this point. In the 4 hours chart, technical indicators lost upward strength and turned modestly lower near overbought territory, whilst the 20 SMA aims north around 1.1690, in line with the dominant bullish trend, but also indicating that the pair may correct lower this Monday.
Support levels: 1.1715 1.1670 1.1620
Resistance levels 1.1780 1.1810 1.1845
USD/JPY
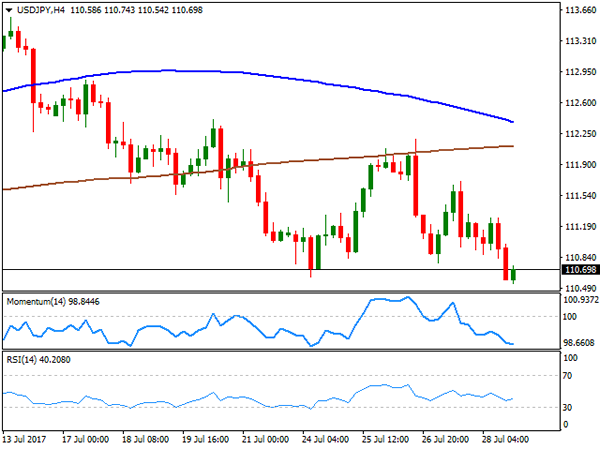
The USD/JPY pair reached a fresh July’s low of 110.54 on Friday, settling not far above it and looking poised to extend its decline. The JPY appreciated on Friday, not only on US poor inflation within the Q2 GDP release, but also on headlines indicating new missile tests in North Korea, which once again hit the Japanese sea. Over the weekend, the US flew two bombers over the peninsula, in a show of force, while President Trump stated its "disappointment" over Chinese response to the matter. The escalating conflict could spur risk aversion at the beginning of the week, resulting in a JPY appreciation. Additionally, Japan will release industrial production and housing data early Monday, which may also have a saying on the pair’s faith. In the daily chart, the pair settled well below its 100 DMA, while the RSI maintains a bearish slope around 36, as the Momentum consolidates near its July lows, all of which favors a bearish extension for the upcoming sessions. In the 4 hours chart, the 100 SMA accelerated lower, approaching the 200 SMA both well above the current level, while technical indicators hold near oversold territory, also in line with additional declines ahead.
Support levels: 110.50 110.00 109.65
Resistance levels: 110.90 111.25 111.60
GBP/USD
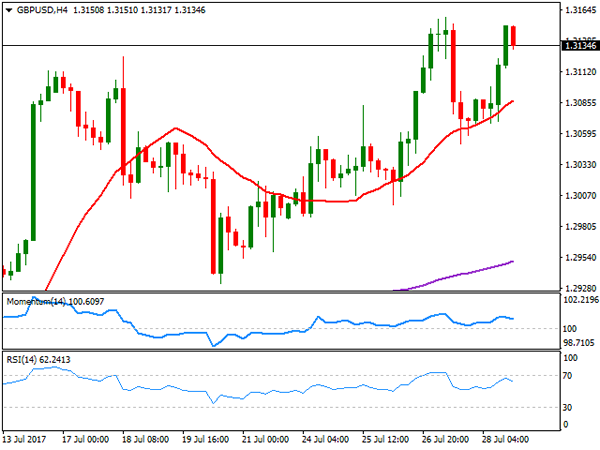
The GBP/USD pair closed the week with gains at 1.3134, level last seen in September 2016, and extending its yearly advance modestly, reaching 1.3158 on Thursday. There were no major macroeconomic of Brexit news this past week to move the Pound, with the pair’s advance solely backed by persistent dollar’s weakness. The mentioned yearly high was reached after late Wednesday, the US Federal Reserve made its monetary policy announcement, seen by the market as dovish on inflation. UK’s Markit PMIs for July will release this week, whilst the BOE will meet next Thursday, the main events for the week. Changes of a change in monetary policy are limited given that, despite holding well above the BOE’s 2% target, inflation has eased this past month. In fact, a dovish stance could be priced in ahead of the event, although broad dollar’s weakness may result in a shallow retracement in the pair. From a technical point of view, the daily chart shows that the price is well above a bullish 20 SMA, while the RSI turned hither around 64 and the Momentum keeps consolidating within positive territory, favoring additional gains on an acceleration through 1.3160. In the 4 hours chart, technical indicators eased modestly within bullish territory, but the price also holds above a bullish 20 SMA, all of which limits chances of a steep decline ahead.
Support levels: 1.3100 1.3060 1.3020
Resistance levels: 1.3160 1.3200 1.3250
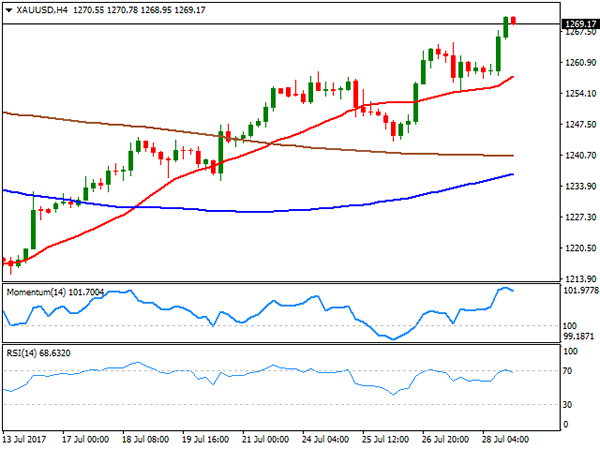
GOLD
Spot gold extended its advance to a fresh July high of $ 1,270.78 a troy ounce on Friday, ending the day slightly below it, but maintaining its bullish stance. Following a dovish Fed on Wednesday, the commodity got additional support from US GDP data, as despite the US is estimated to have grew by 2.6% in the second quarter, price inflation came in well below expectations, with core PCE up by just 0.3% in the same period. Gold settled at its highest since mid June, and technical readings in the daily chart favor an upward extension ahead, as indicators extended their advances to fresh 1-month highs, maintaining their bullish slopes, despite being in overbought territory. The same chart shows that the 20 DMA is gaining upward strength below the current level, while the 100 and 200 DMAs, remain flat, but also under the current price. In the 4 hours chart, technical indicators have turned lower within overbought territory, rather reflecting shrinking volumes at the end of the week than suggesting a downward movement, whilst the price remains well above all of its moving averages, keeping the risk towards the upside.
Support levels: 1,267.90 1,254.75 1,245.20
Resistance levels: 1,274.10 1,283.30 1,290.10
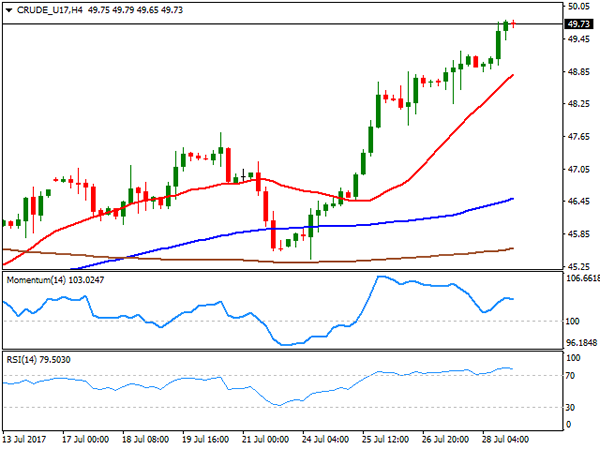
WTI CRUDE OIL
Crude oil prices extended their advance on Friday to levels last seen in May, with West Texas Intermediate crude futures settling at $49.73, up on the week by 8.6%. Oil prices surged on the back of positive market news, as US inventories fell by more than expected, while Saudi Arabia pledged to reduce further its oil output in August. The Baker Hughes report released on Friday, showed that the number of active rigs drilling oil in the US rose by 2 to 766 this past week, indicating the upward pace of US production began to decelerate. WTI’s daily chart favors additional gains ahead, given that the price is above its 20 and 100 SMAs, with the shortest advancing below the largest, and the 200 DMA holding flat above the current level, around 50.00. Indicators in the mentioned time frame resumed their advances after a modest correction, now entering overbought territory with strong upward slopes. In the 4 hours chart, the RSI indicator turned modestly lower, but holds around 79, while the Momentum indicator is diverging lower, but still within positive territory, a first sign that the rally won’t extend much more before at least correcting. The 20 SMA in this last time frame heads north around 48.80, providing a strong dynamic support.
Support levels: 49.45 48.80 48.20
Resistance levels: 50.10 50.65 52.20
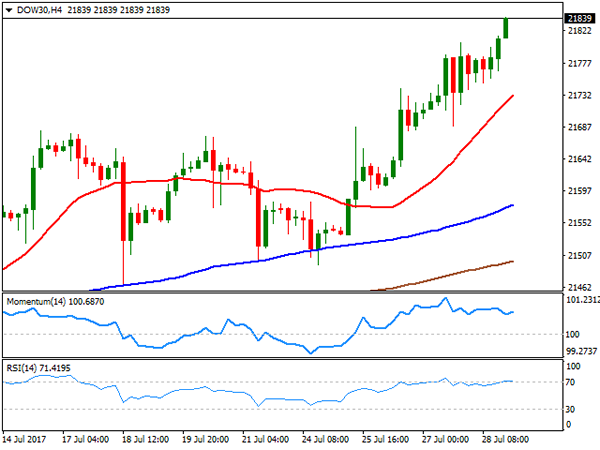
DJIA
Wall Street closed mixed on Friday, with the Dow Jones Industrial Average ending up 33 points or 0.15% at new all-time highs of 21,880.31. The Nasdaq Composite lost 7 points, to 6,374.68, while the S&P settled at 2,472.10, down 3 points or 0.13%. The technology sector was the worst performer, dragged lower by a mixed quarterly result from Amazon, as the company beat revenue estimates, but fell short on earnings. Chevron led advancers, up 1.89%, while Exxon mobile was the worst performer, shedding 1.52%, both led by earnings reports, the main driver these days. The daily chart for the Dow shows that the index closed at its highs, up for a fourth consecutive day, and with moving averages still heading north below the current level, but technical indicators paring gains near overbought readings. In the 4 hours chart, however, the risk remains towards the upside, as the 20 SMA accelerated north below the current level, while the Momentum indicator turned modestly higher well into bullish territory, and the RSI consolidates around 71.
Support levels: 21,814 21,766 21,718
Resistance levels: 21,900 21,945 21,990
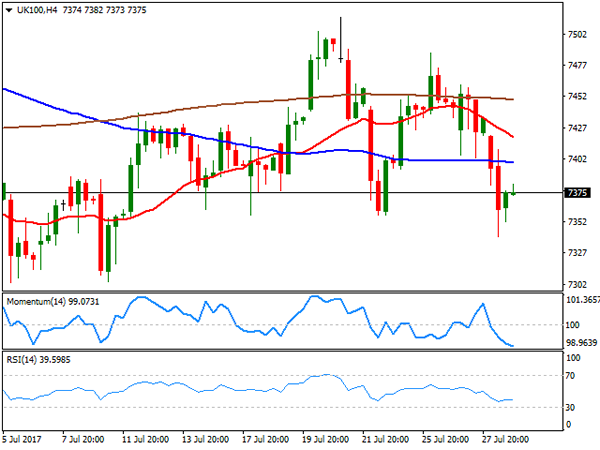
FTSE100
The FTSE 100 lost 1.0% or 73 points last Friday to close at 7,368.37. A US regulatory decision about the tobacco industry led the way lower, as the FDA proposed to lower nicotine levels to non-addictive levels. British American Tobacco plunged 6.80%, leading the way lower, followed by Imperial Brands that shed 3.79%. Miners and energy-related equities led the advance, with AstraZeneca leading the way higher, up 3.62%. The daily chart for the Footsie shows that the index closed below its 20 and 100 DMAs, that anyway remain flat and within a tight range, whilst technical indicators turned south, currently pressuring their mid-lines, all of which is not enough to confirm a bearish extension. In the shorter term, and according to the 4 hours chart, however, the bearish stance is clearer, given that technical indicators head south within negative territory, whilst the index develops below all of its moving averages, and particularly with the 20 SMA gaining downward strength.
Support levels: 7,340 7,294 7,257
Resistance levels: 7,398 7,434 7,587
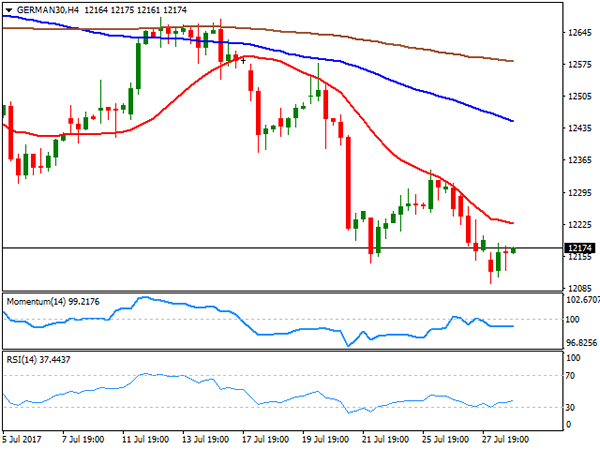
DAX
The German DAX lost 49 points last Friday to settled at 12,162.70, down for a second consecutive week and at levels last seen in April, as EUR’s strength kept local shares under pressure. All European indexes closed in the red, led by automakers and chemicals companies. Emissions scandal hit all German big names in the automotive sector, on allegations they had colluded for decades to limit the pace of technological advances in their vehicles and stifle competition. Within the DAX, only 9 members closed up on Friday, with Adidas leading the way, up 4.04%. Line on the other hand, was the worst performer, shedding 2.36%, and Volkswagen closing 1.01% lower. The daily chart for the benchmark shows that the index is further below its 20 and 100 DMAs, with the shortest crossing below the larger and technical indicators maintaining their bearish slopes within negative territory. In the 4 hours chart, technical indicators turned flat well into negative territory, as the index develops below all of its moving averages, also maintaining the risk towards the downside.
Support levels: 12,146 12,098 12,053
Resistance levels: 12,199 12,235 12,292