Thu, Jan 29, 2026 21:46 GMT
More
    HomeContributorsTechnical AnalysisUSD/JPY is Bullish Near-Term – Elliott Wave Analysis

    USD/JPY is Bullish Near-Term – Elliott Wave Analysis

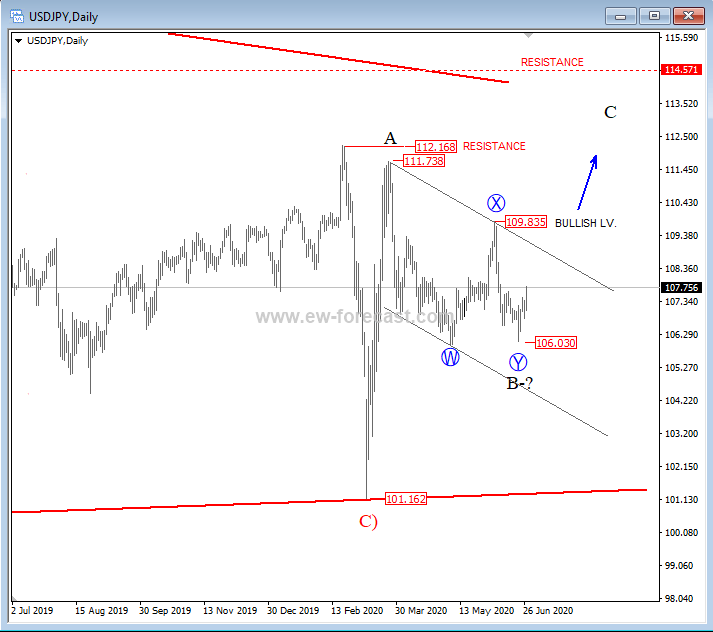
    On the daily chart of USDJPY we see price unfolding a bigger A-B-C move, up from 101.16 level, which can belong to a bigger triangle consolidation. As you can see, wave A found a high at the 111.74 level, from where a three-wave, complex set-back started developing. This set-back is a wave B, and can be near completion, therefore be aware of further upside, above the 109.84 level in days/weeks ahead. That said, we would like to see a rally in five legs of a lesser degree from current 106.03 swing low, which would be first evidence of a completed wave B correction, and that wave C is underway.

    USD/JPY, daily

    Elliott Wave Financial Service
    Elliott Wave Financial Servicehttp://www.ew-forecast.com/
    Trading forex, futures or futures options carries a high level of risk, and may not be suitable for all investors. The possibility exists that you could lose some or all of your initial investment; therefore you should not invest money that you cannot afford to lose. Our website and the information provided here should not be relied upon as a substitute for extensive independent research before making your investment decisions.

    Latest Analysis

    Learn Forex Trading