The USD/ZAR currency pair has been trading within a descending triangle pattern since the middle of June.
From a theoretical perspective, it is likely that the exchange rate could breach the given pattern south within the following trading sessions. Note that the rate could face the support level formed by the Fibo 38.20% at 16.25.
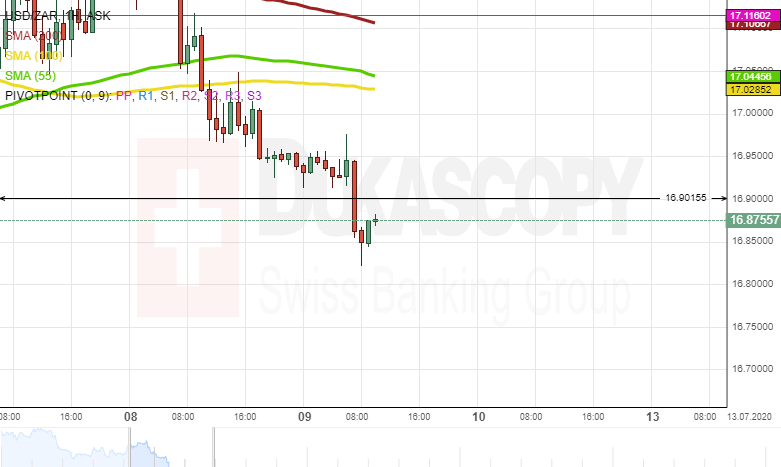
On the other hand, it is likely that the currency pair could gain support from the 55– and 100-hour SMAs. Thus, some upside potential could prevail in the market. In this case the pair could target the psychological level at 19.20.