
The EUR/USD currency pair
Technical indicators of the currency pair:
Prev Open: 1.17708
Open: 1.17627
% chg. over the last day: -0.16
Day’s range: 1.17521 – 1.17800
52 wk range: 1.0777 – 1.1781
The EUR/USD currency pair continues to consolidate. The technical pattern is ambiguous. Financial market participants expect additional drivers. Local support and resistance levels are 1.1735 and 1.1800, respectively. The trading instrument has the potential for a further correction after a prolonged rally. We recommend following up-to-date information regarding the coronavirus pandemic. Positions should be opened from key levels.
Today, the news feed is calm enough:
Factory orders in the US at 17:00 (GMT+3:00).
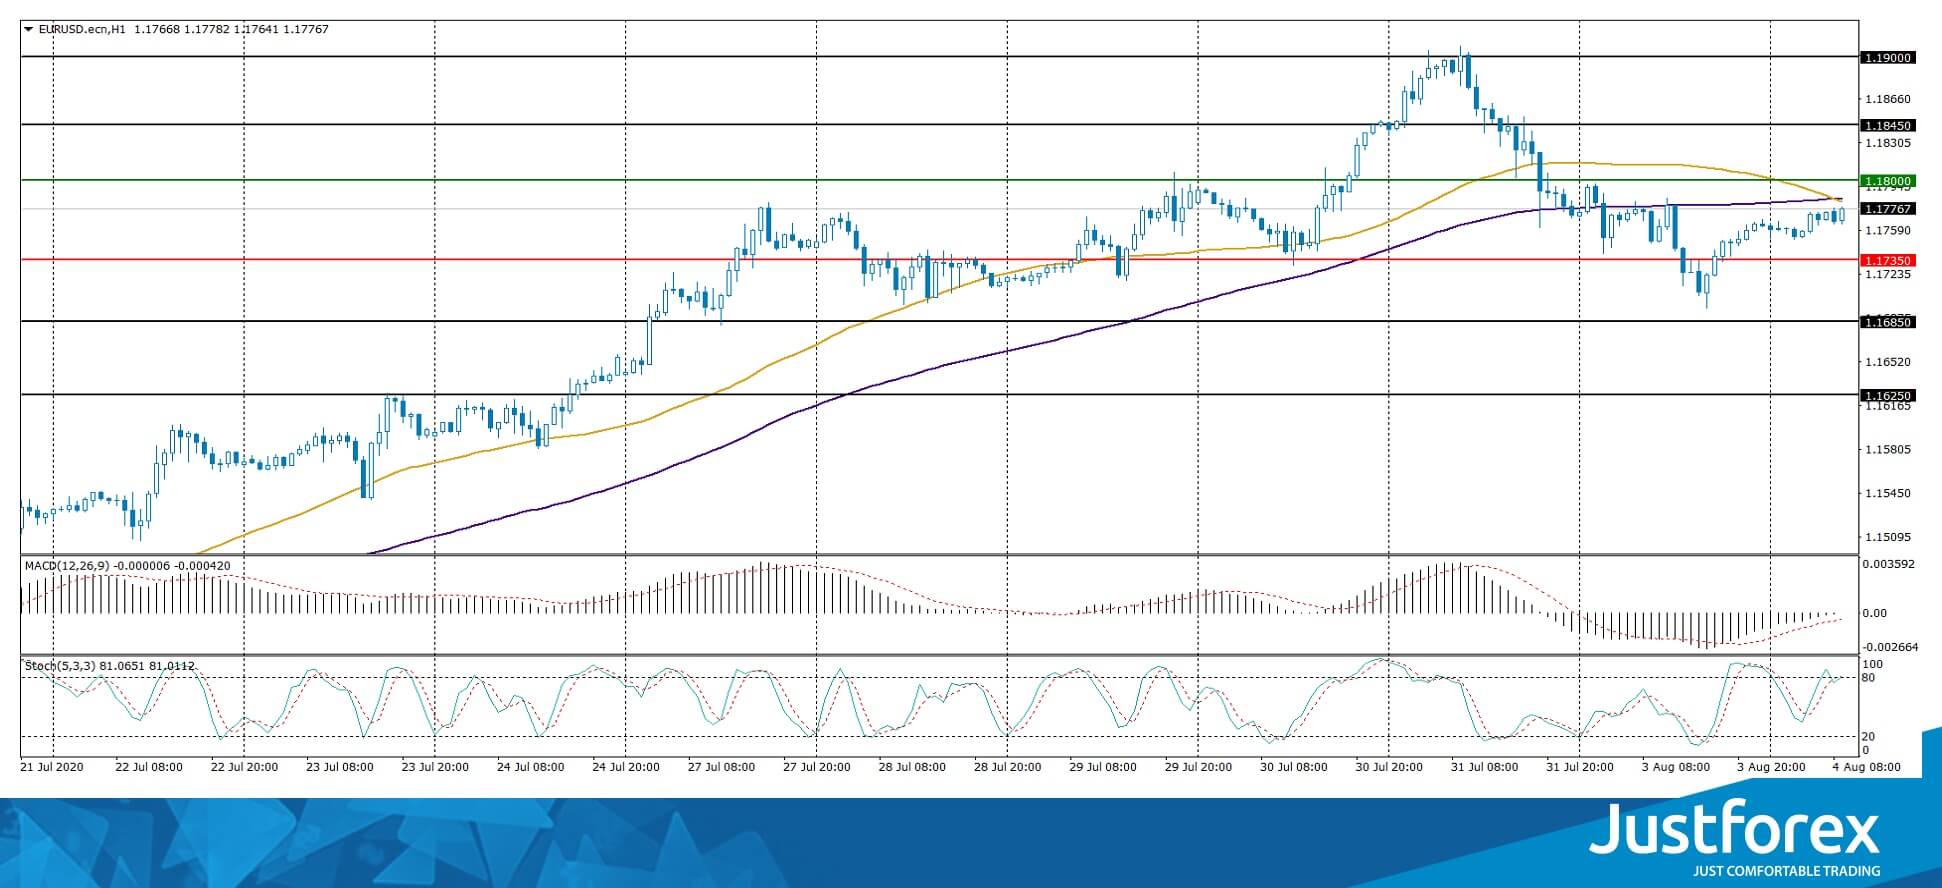
Indicators do not give accurate signals: 50 MA has crossed 100 MA.
The MACD histogram is near the 0 mark.
Stochastic Oscillator is near the overbought zone, the %K line has crossed the %D line. There are no signals at the moment.
Trading recommendations
Support levels: 1.1735, 1.1685, 1.1625
Resistance levels: 1.1800, 1.1845, 1.1900
If the price fixes below 1.1735, EUR/USD quotes are expected to correct. The movement is tending to 1.1685-1.1630.
An alternative could be the growth of the EUR/USD currency pair to 1.1840-1.1880.
The GBP/USD currency pair
Technical indicators of the currency pair:
Prev Open: 1.30755
Open: 1.30744
% chg. over the last day: -0.01
Day’s range: 1.30522 – 1.31035
52 wk range: 1.1466 – 1.3516
GBP/USD quotes continue to consolidate. There is no defined trend. Investors expect additional drivers. The British pound is testing local support and resistance levels: 1.3020 and 1.3100, respectively. In the near future, a technical correction of the GBP/USD currency pair is possible after a prolonged growth. Positions should be opened from key levels.
The news feed on the UK economy is calm.
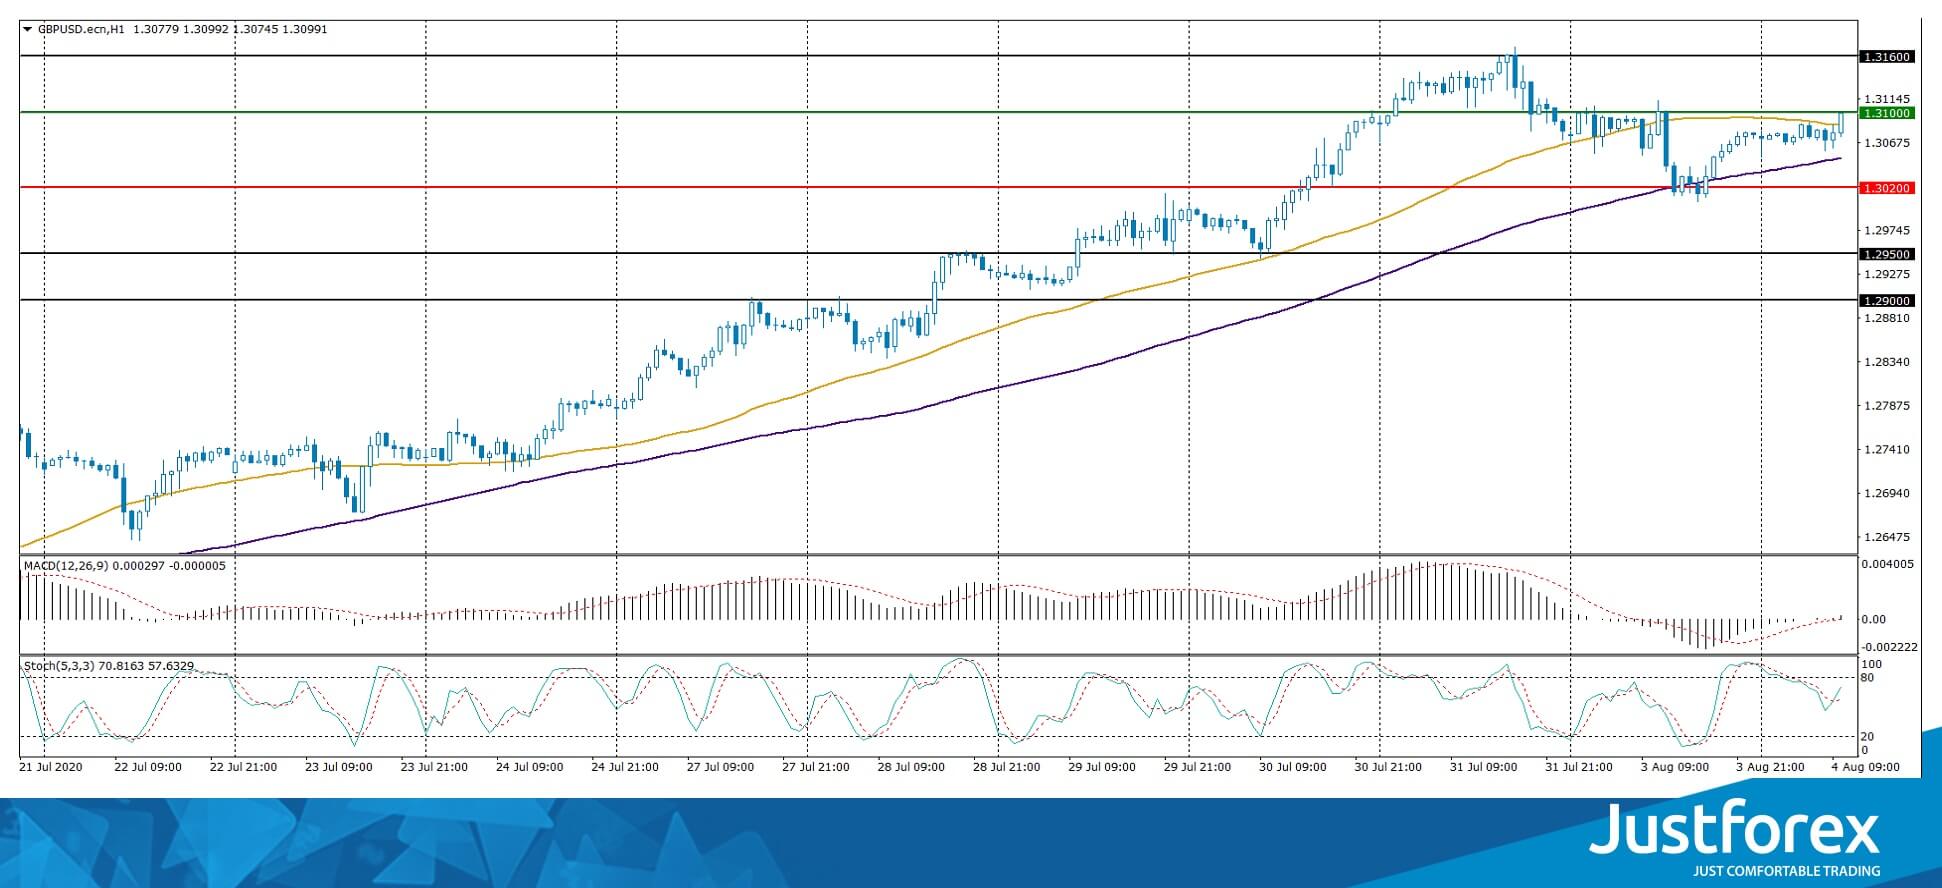
The indicators do not give accurate signals: the price has crossed the 50 MA and 100 MA.
The MACD histogram is near the 0 mark. There are no signals at the moment.
Stochastic Oscillator is in the neutral zone, the %K line has crossed the %D line. There are no signals at the moment.
Trading recommendations
Support levels: 1.3020, 1.2950, 1.2900
Resistance levels: 1.3100, 1.3160
If the price fixes below 1.3020, GBP/USD quotes are expected to correct. The movement is tending to 1.2960-1.2920.
An alternative could be the growth of the GBP/USD currency pair to 1.3150-1.3200.
The USD/CAD currency pair
Technical indicators of the currency pair:
Prev Open: 1.34015
Open: 1.33885
% chg. over the last day: -0.05
Day’s range: 1.33610 – 1.34045
52 wk range: 1.2949 – 1.4668
The USD/CAD currency pair is still being traded in a flat. The technical pattern is ambiguous. At the moment, the local support and resistance levels are 1.3360 and 1.3400, respectively. The positive dynamics of oil quotes support the loonie. We do not exclude a decrease in the trading instrument in the short term. Positions should be opened from key levels.
The news feed on Canada’s economy is calm.
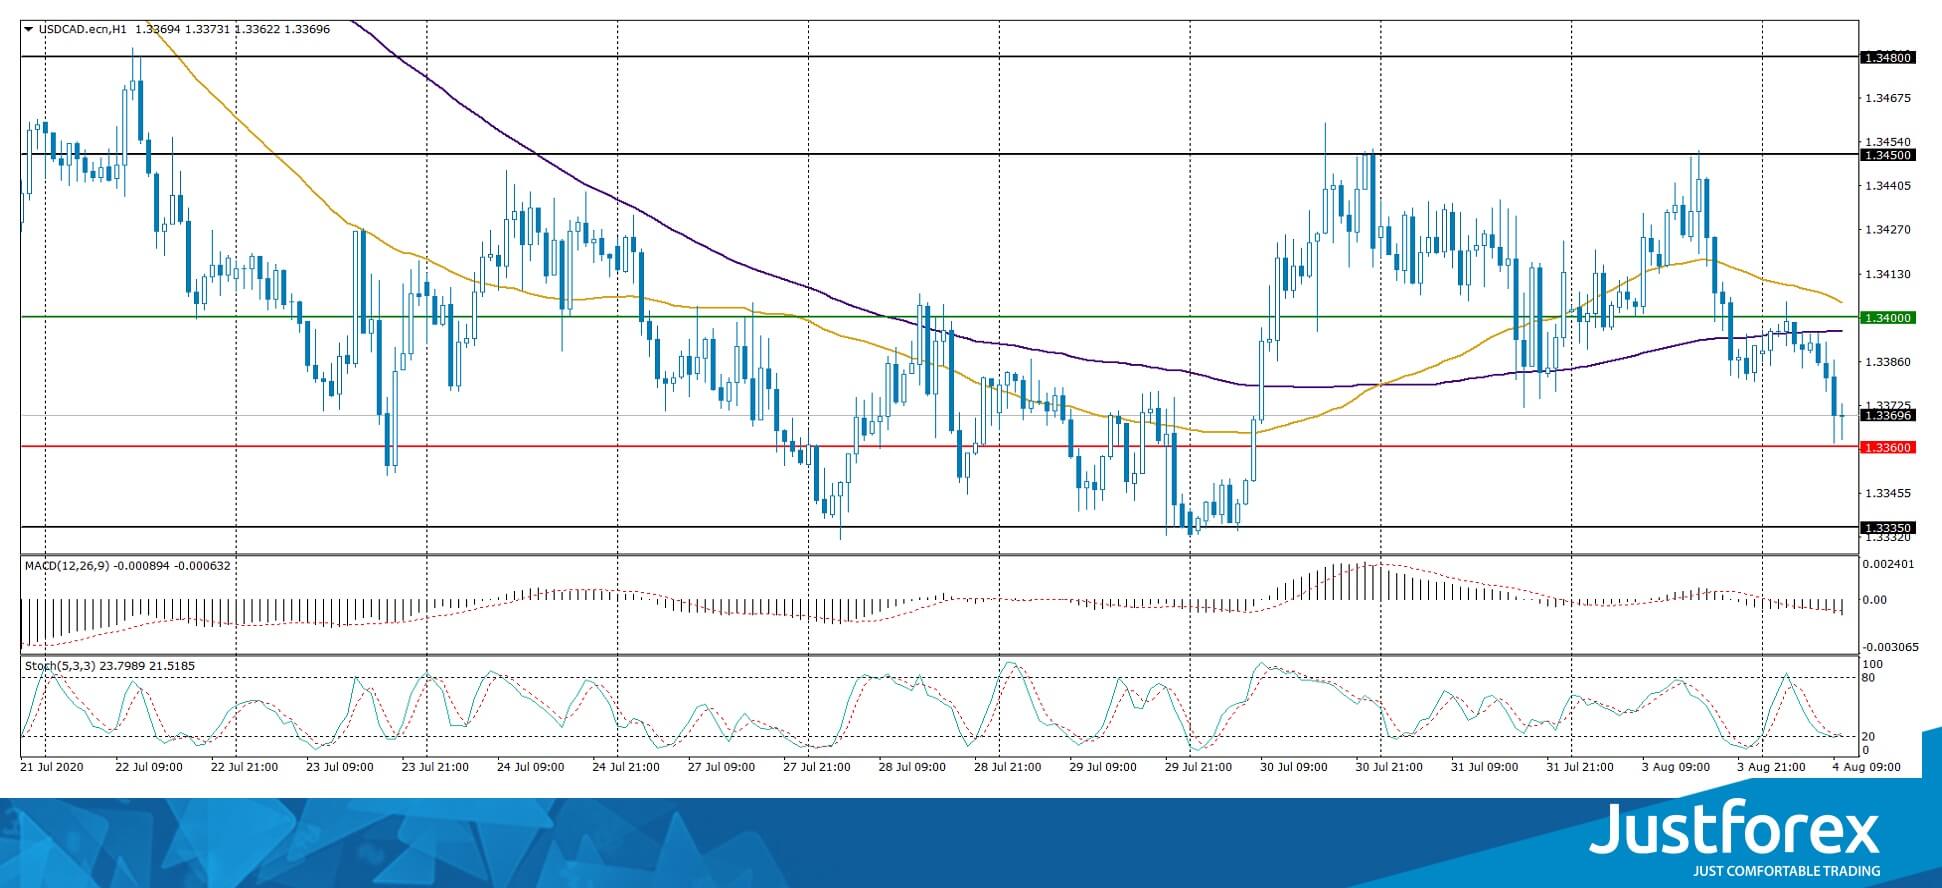
Indicators do not give accurate signals: 50 MA has started crossing 100 MA.
The MACD histogram has been declining, which indicates the development of bearish sentiment.
Stochastic Oscillator is in the neutral zone, the %K line has crossed the %D line. There are no signals at the moment.
Trading recommendations
Support levels: 1.3360, 1.3335, 1.3300
Resistance levels: 1.3400, 1.3450, 1.3480
If the price fixes below 1.3360, USD/CAD quotes are expected to fall. The movement is tending to 1.3335-1.3300.
An alternative could be the growth of the USD/CAD currency pair to 1.3430-1.3460.
The USD/JPY currency pair
Technical indicators of the currency pair:
Prev Open: 105.770
Open: 105.966
% chg. over the last day: +0.08
Day’s range: 105.836 – 106.191
52 wk range: 101.19 – 112.41
The USD/JPY currency pair has become stable after a sharp growth since the end of last week and is currently consolidating. Local support and resistance levels are 105.60 and 106.20, respectively. USD/JPY quotes have the potential for further recovery. We recommend paying attention to the dynamics of US government bonds yield. Positions should be opened from key levels.
Today, the news feed on Japan’s economy is calm enough.
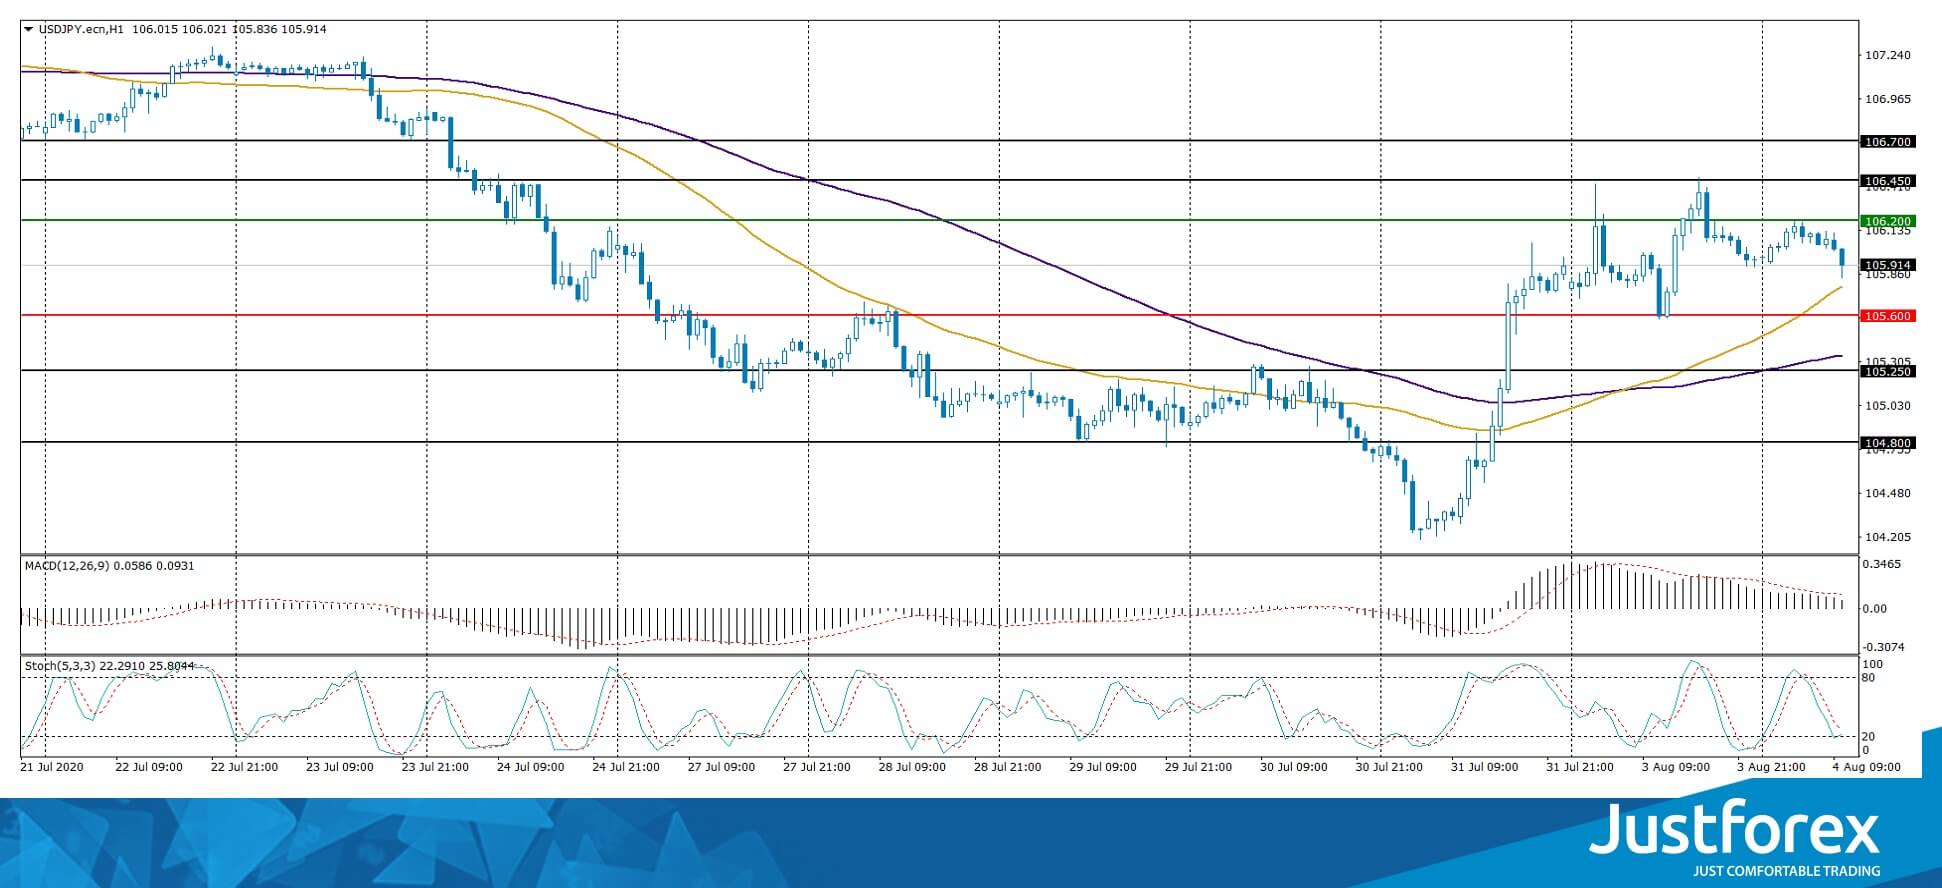
Indicators do not give accurate signals: the price is testing 50 MA.
The MACD histogram is in the positive zone, but below the signal line, which gives a weak signal to buy USD/JPY.
Stochastic Oscillator is in the neutral zone, the %K line is below the %D line, which indicates the bearish sentiment.
Trading recommendations
Support levels: 105.60, 105.25, 104.80
Resistance levels: 106.20, 106.45, 106.70
If the price fixes above 106.20, further growth of USD/JPY quotes is expected. The movement is tending to 106.60-106.80.
An alternative could be a decline in the USD/JPY currency pair to 105.25-104.80.


