
The EUR/USD currency pair
Technical indicators of the currency pair:
Prev Open: 1.18453
Open: 1.18118
% chg. over the last day: -0.14
Day’s range: 1.17951 – 1.18274
52 wk range: 1.0637 – 1.2012
The technical pattern on the EUR/USD currency pair is still ambiguous. The trading instrument continues to consolidate. Financial market participants have taken a wait-and-see attitude before the ECB meeting, which will be held later this week. At the moment, the local support and resistance levels are 1.1790 and 1.1830, respectively. EUR/USD quotes have the potential for further decline. We recommend opening positions from key levels.
At 12:00 (GMT+3:00), preliminary data on the Eurozone GDP will be published.
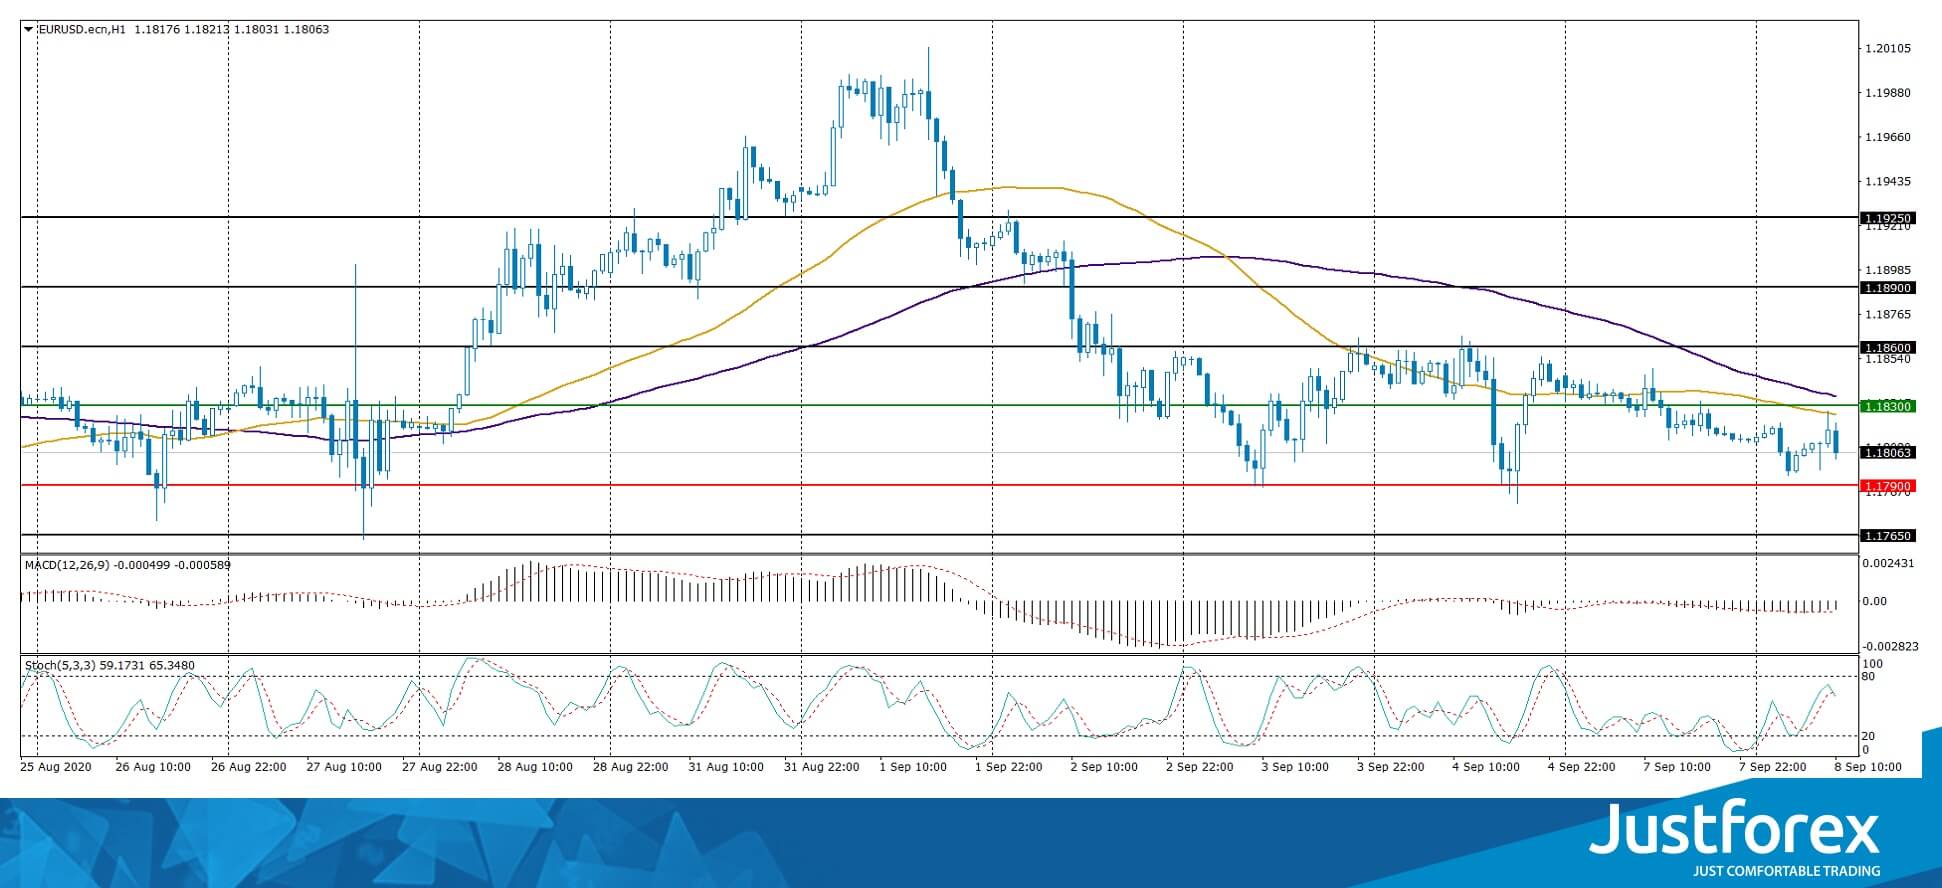
Indicators do not give accurate signals: the price is testing 50 MA and 100 MA.
The MACD histogram is in the negative zone, which indicates the development of bearish sentiment.
Stochastic Oscillator is in the neutral zone, the %K line has crossed the %D line. There are no signals at the moment.
Trading recommendations
Support levels: 1.1790, 1.1765, 1.1740
Resistance levels: 1.1830, 1.1860, 1.1890
If the price fixes below 1.1790, further correction of EUR/USD quotes is expected. The movement is tending to 1.1760-1.1740.
An alternative could be the growth of the EUR/USD currency pair to 1.1860-1.1900.
The GBP/USD currency pair
Technical indicators of the currency pair:
Prev Open: 1.32438
Open: 1.31609
% chg. over the last day: -0.61
Day’s range: 1.31248 – 1.31696
52 wk range: 1.1409 – 1.3516
GBP/USD quotes continue to show a negative trend. The British pound has set new local lows again. The pound is under pressure due to Brexit uncertainty. Boris Johnson said that the trade agreement with the EU should be concluded before October 15, otherwise it will never be met. At the moment, the GBP/USD currency pair is testing the 1.3120 mark. The 1.3180 mark is already a “mirror” resistance. A further decline in GBP/USD quotes is possible. Positions should be opened from key levels.
The publication of important UK economic reports is not planned.
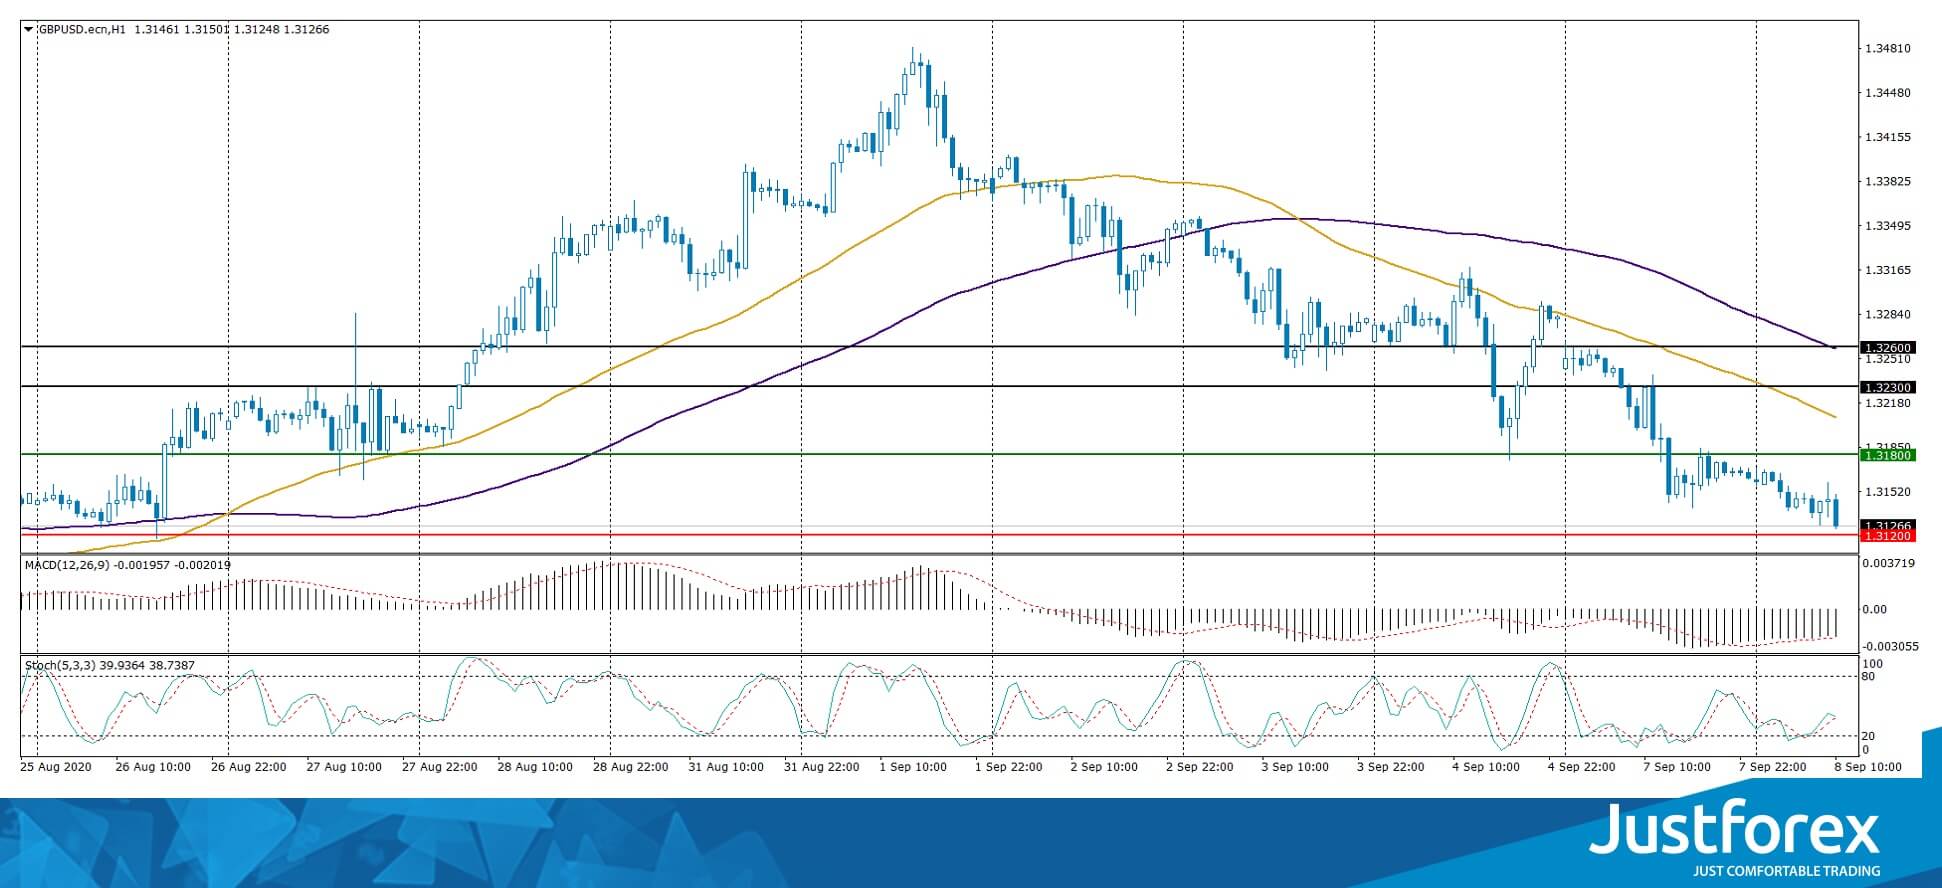
Indicators signal the power of sellers: the price has fixed below 50 MA and 100 MA.
The MACD histogram is in the negative zone, which gives a signal to sell GBP/USD.
Stochastic Oscillator is in the neutral zone, the %K line has started crossing the %D line. There are no signals at the moment.
Trading recommendations
Support levels: 1.3120, 1.3050
Resistance levels: 1.3180, 1.3230, 1.3260
If the price fixes below 1.3120, a further drop in GBP/USD quotes is expected. The movement is tending to 1.3070-1.3050.
An alternative could be the growth of the GBP/USD currency pair to 1.3230-1.3260.
The USD/CAD currency pair
Technical indicators of the currency pair:
Prev Open: 1.30464
Open: 1.30934
% chg. over the last day: +0.14
Day’s range: 1.30864 – 1.31200
52 wk range: 1.2949 – 1.4669
The loonie is in a sideways trend. The technical pattern is ambiguous. USD/CAD quotes are testing local support and resistance levels: 1.3080 and 1.3120, respectively. Financial market participants expect additional drivers. The trading instrument is tending to grow. We recommend paying attention to the dynamics of “black gold” prices. Positions should be opened from key levels.
The news feed on Canada’s economy is calm.
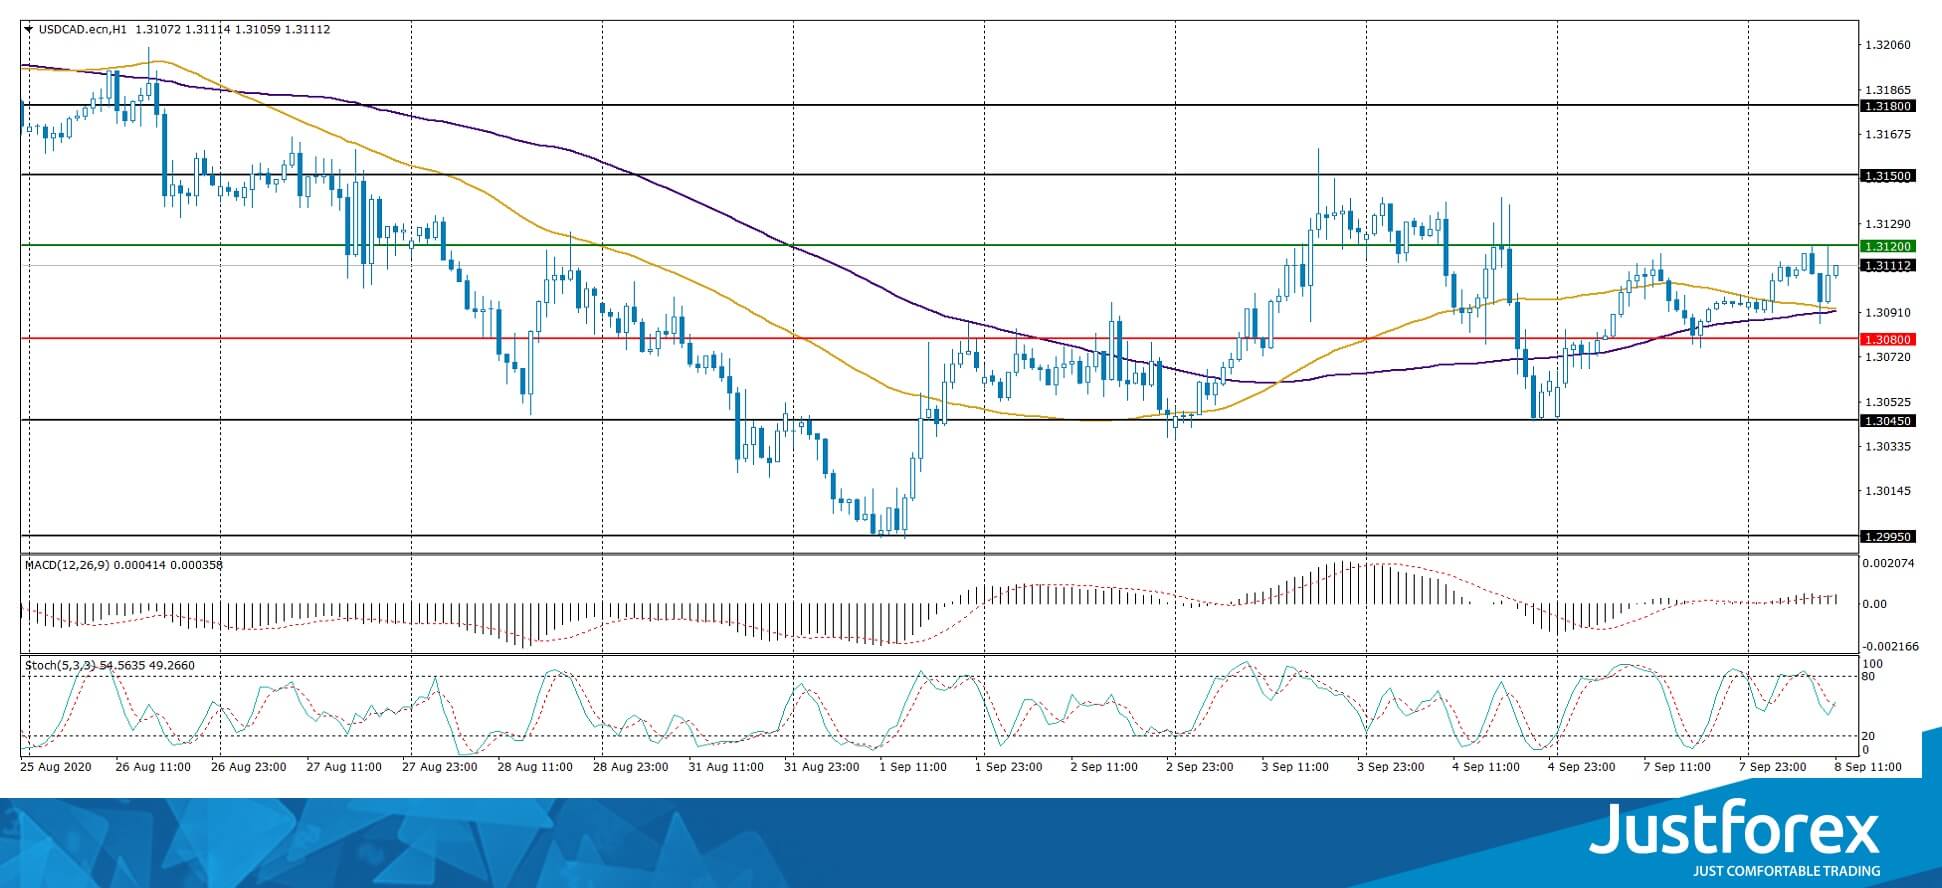
Indicators do not give accurate signals: 50 MA has crossed 100 MA.
The MACD histogram has started rising, which indicates the bullish sentiment.
Stochastic Oscillator is in the neutral zone, the %K line has crossed the %D line. There are no signals at the moment.
Trading recommendations
Support levels: 1.3080, 1.3045, 1.2995
Resistance levels: 1.3120, 1.3150, 1.3180
If the price fixes above 1.3120, USD/CAD quotes are expected to grow. The movement is tending to 1.3150-1.3180.
An alternative could be a decline in the USD/CAD currency pair to 1.3045-1.3020.
The USD/JPY currency pair
Technical indicators of the currency pair:
Prev Open: 106.217
Open: 106.270
% chg. over the last day: +0.03
Day’s range: 106.196 – 106.314
52 wk range: 101.19 – 112.41
USD/JPY quotes continue to consolidate. There is no defined trend. Investors expect additional drivers. Local support and resistance levels are still: 106.00 and 106.35, respectively. We recommend paying attention to the dynamics of US government bonds yield. Positions should be opened from key levels.
Japan’s GDP has shown the worst decline in post-war history amid the consequences of the COVID-19 epidemic. The figure decreased by 28.1%.
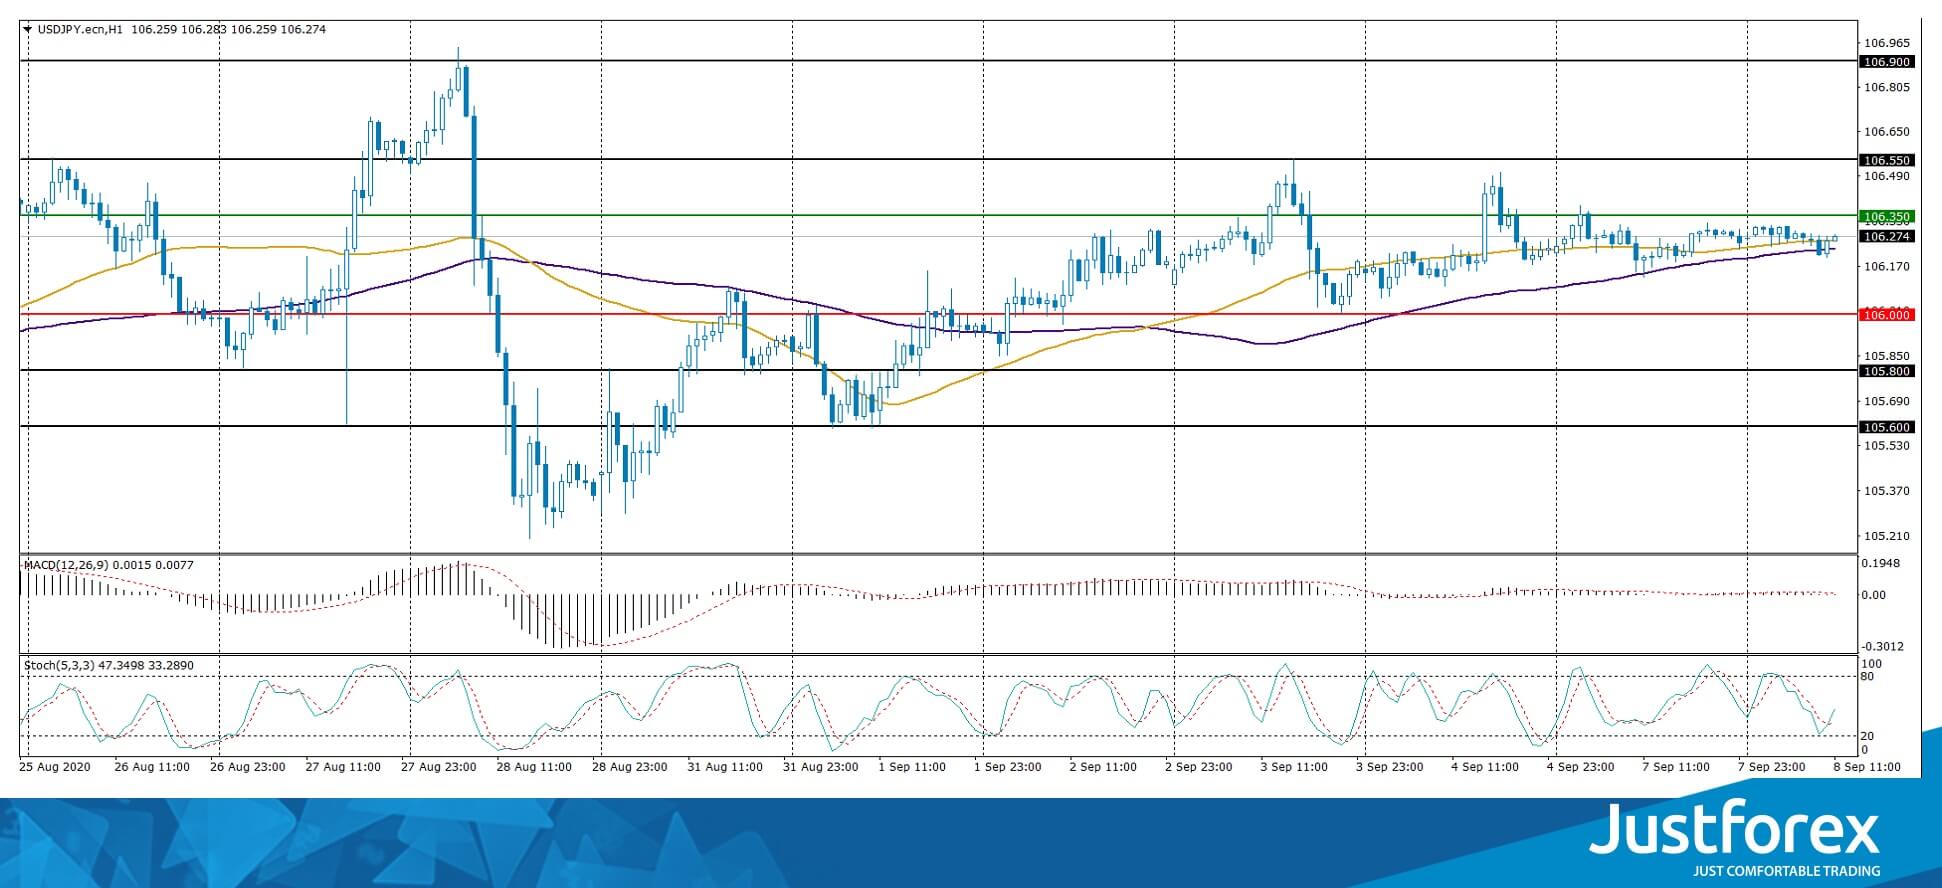
Indicators do not give accurate signals: the price has crossed the 50 MA and 100 MA.
The MACD histogram is near the 0 mark.
Stochastic Oscillator is in the neutral zone, the %K line has crossed the %D line. There are no signals at the moment.
Trading recommendations
Support levels: 106.00, 105.80, 105.60
Resistance levels: 106.35, 106.55, 106.90
If the price fixes above 106.35, USD/JPY quotes are expected to grow. The movement is tending to 106.65-106.90.
An alternative could be a decline in the USD/JPY currency pair to 105.70-105.50.


