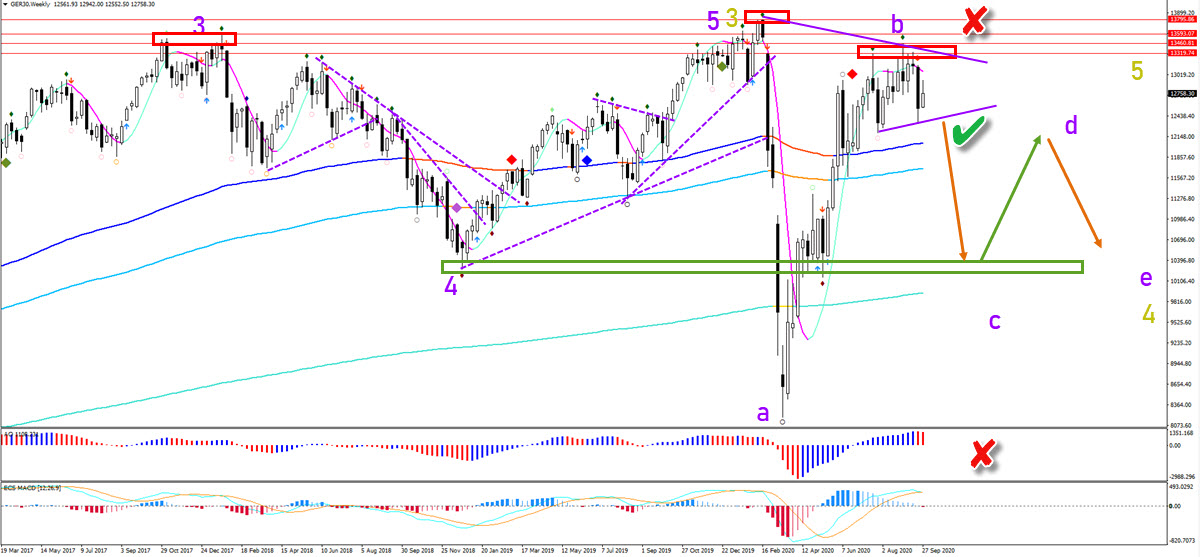
The German stock market (DAX 30 index) bullish price action is running into a heavy resistance zone (red lines). A bearish reversal could take place and create an ABCDE (purple) triangle chart pattern. When would this triangle become confirmed?
Price Charts and Technical Analysis
The DAX chart needs to break below the support trend line (purple) to increase the probability of a triangle chart pattern developing. A bearish breakout could confirm (green check) the push lower to test support (green box). If price action keeps respecting the tops and bottoms, then an ABCDE triangle chart pattern is likely to emerge. A break of the top or bottom would invalidate (red x) that outlook within a potential wave 4 (green).
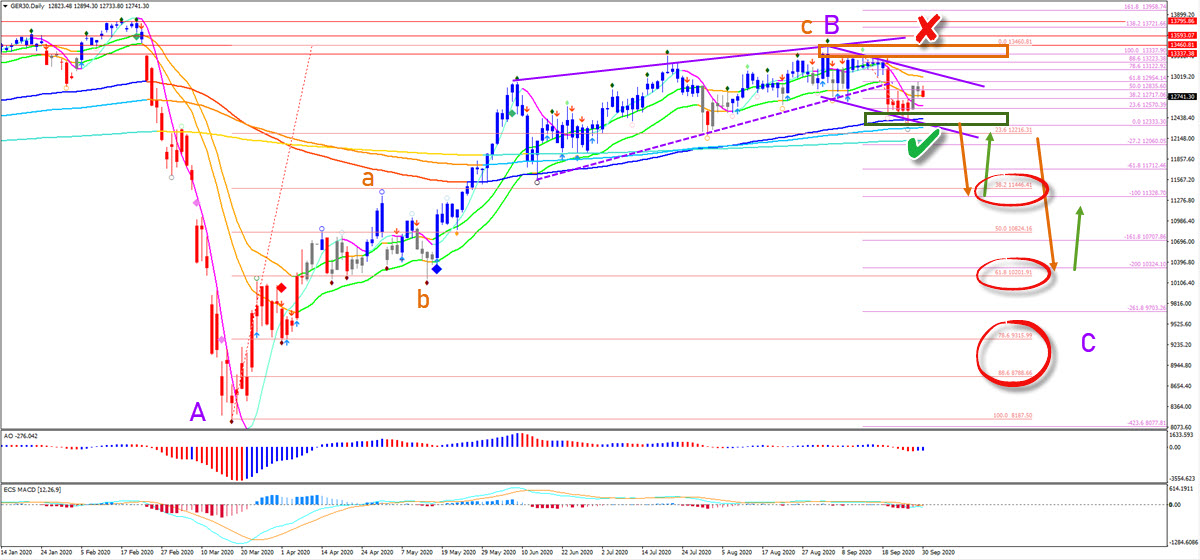
The SWAT candles are showing red color for the second time. Price action also broke below the support trend line (dotted purple) and the 21 ema zone. The trend lines also indicate a broken rising wedge reversal chart pattern. Price seems to have completed a bullish ABC (orange) within wave B (purple). A bearish breakout below the support zone (green box) could send the DAX lower towards the Fibonacci targets.