
The EUR/USD currency pair
Technical indicators of the currency pair:
Prev Open: 1.17424
Open: 1.17197
% chg. over the last day: -0.20
Day’s range: 1.17172 – 1.17575
52 wk range: 1.0637 – 1.2012
Trading activity and volatility on currency majors are still high. At the moment, the technical pattern on the EUR/USD currency pair is ambiguous. The trading instrument is consolidating. Local support and resistance levels are 1.1715 and 1.1755, respectively. Investors continue to monitor talks in the US Congress on a new stimulus package. Today, we expect important economic releases. Positions should be opened from key levels.
The news feed on 2020.10.01:
German manufacturing PMI at 10:55 (GMT+3:00);
Initial jobless claims in the US at 15:30 (GMT+3:00);
Personal spending in the US at 15:30 (GMT+3:00);
ISM manufacturing PMI at 17:00 (GMT+3:00).
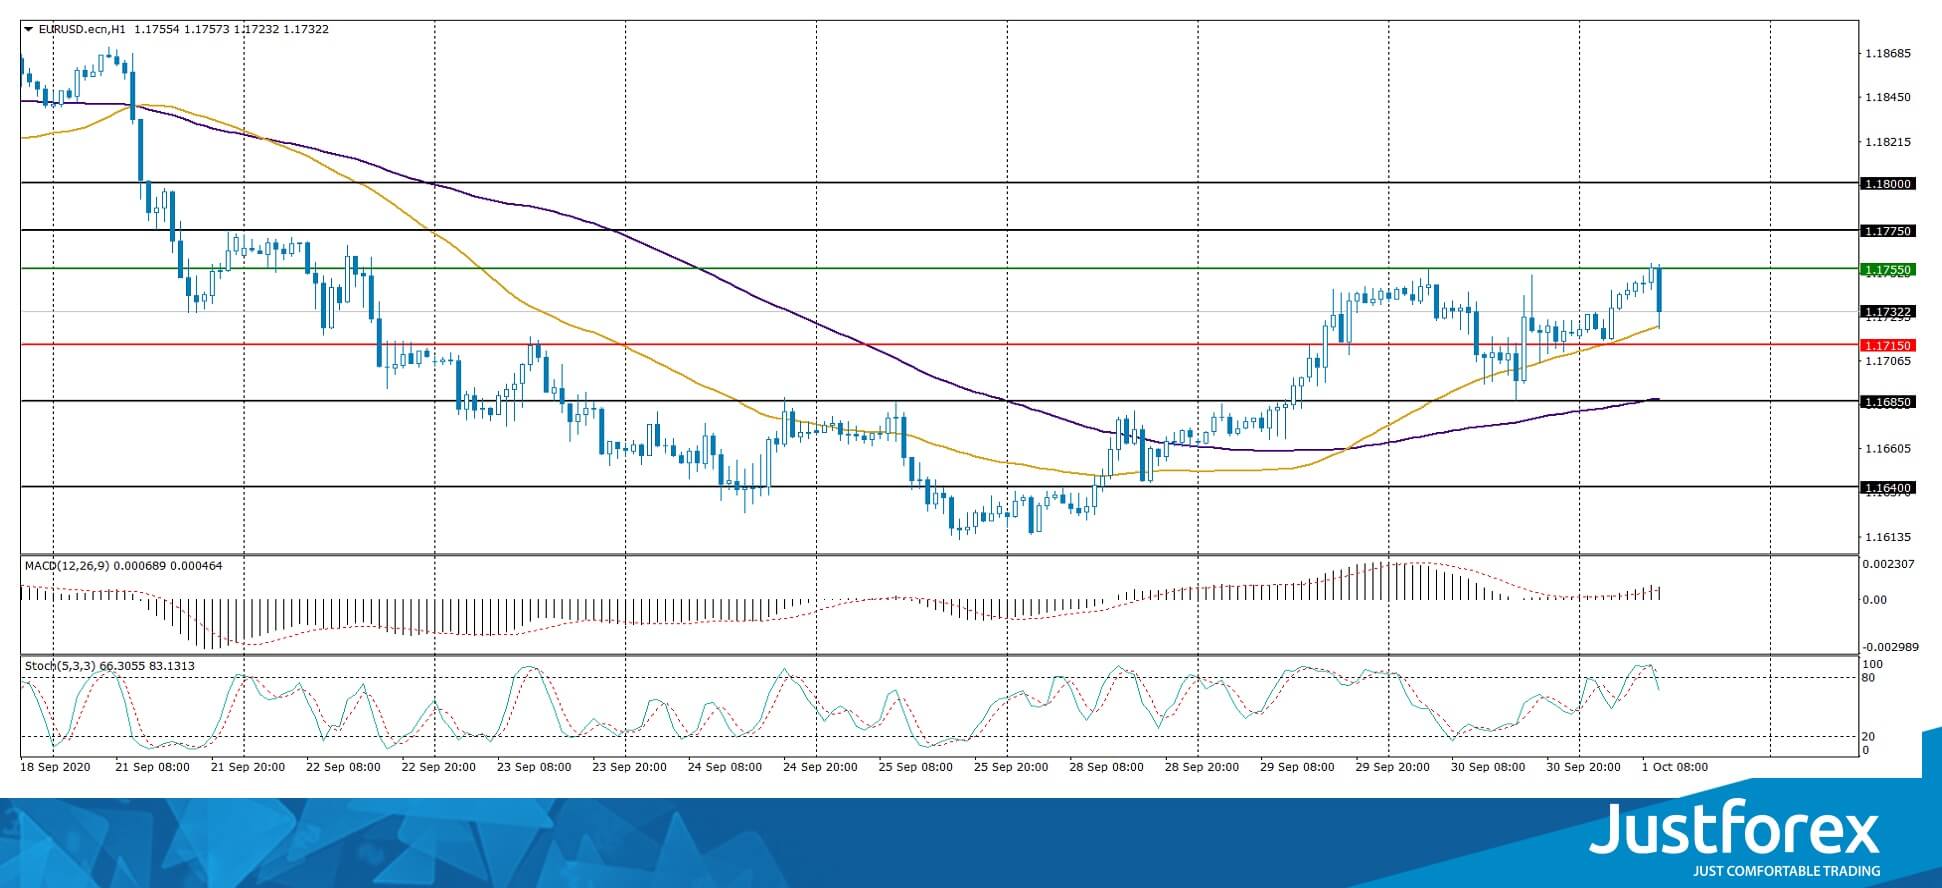
Indicators do not give accurate signals: the price is testing 50 MA.
The MACD histogram is in the positive zone, which indicates the bullish sentiment.
Stochastic Oscillator is in the overbought zone, the %K line has crossed the %D line. There are no signals at the moment.
Trading recommendations
Support levels: 1.1715, 1.1685, 1.1640
Resistance levels: 1.1755, 1.1775, 1.1800
If the price fixes above 1.1755, further growth in EUR/USD quotes is expected. The movement is tending to the round level of 1.1800.
An alternative could be a decrease in the EUR/USD currency pair to 1.1685-1.1660.
The GBP/USD currency pair
Technical indicators of the currency pair:
Prev Open: 1.28557
Open: 1.29142
% chg. over the last day: +0.43
Day’s range: 1.28734 – 1.29502
52 wk range: 1.1409 – 1.3516
In the last sessions, trades on the GBP/USD currency pair are very active. At the same time, there is no defined trend. At the moment, the local support and resistance levels are 1.2870 and 1.2920, respectively. The British pound is tending to recover. We recommend following up-to-date information regarding the Brexit negotiations. Positions should be opened from key levels.
At 11:30 (GMT+3:00), the UK Manufacturing PMI will be published.
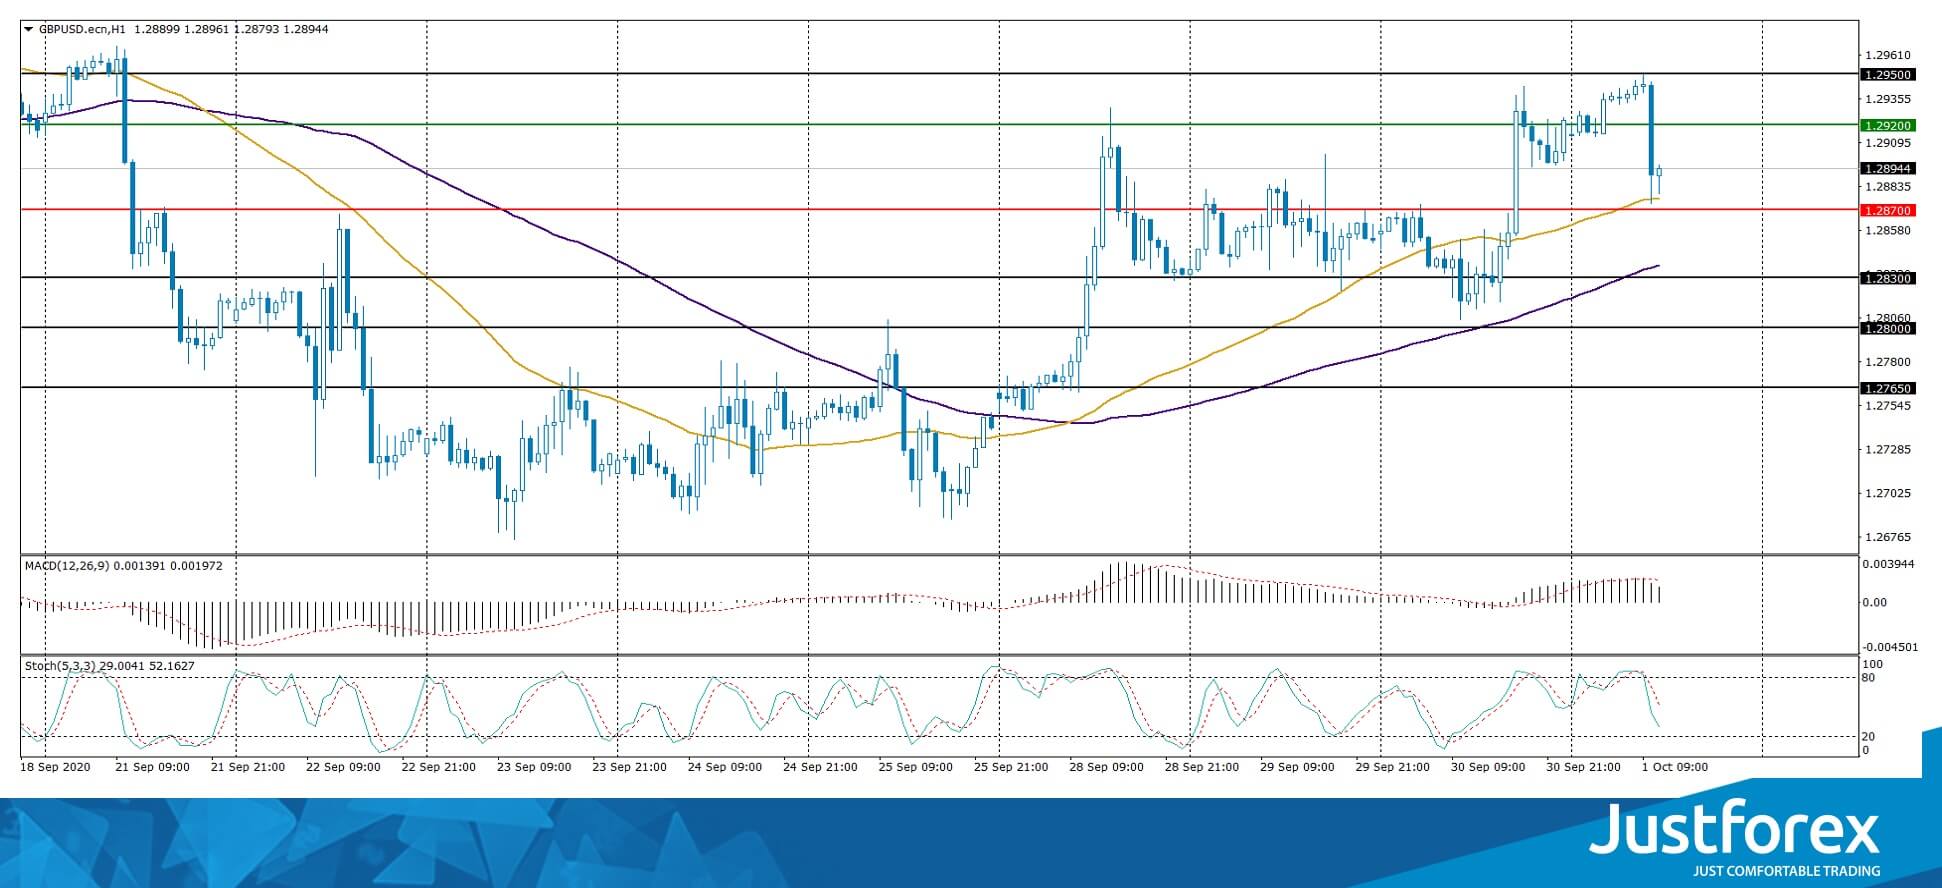
Indicators do not give accurate signals: the price is testing 50 MA.
The MACD histogram is in the positive zone, which indicates the development of bullish sentiment.
Stochastic Oscillator is in the neutral zone, the %K line is below the %D line, which gives a signal to sell GBP/USD.
Trading recommendations
Support levels: 1.2870, 1.2830, 1.2800
Resistance levels: 1.2920, 1.2950, 1.3000
If the price fixes above 1.2920, further growth of the GBP/USD currency pair is expected. The movement is tending to 1.2950-1.3000.
An alternative could be a drop in GBP/USD quotes to 1.2830-1.2800.
The USD/CAD currency pair
Technical indicators of the currency pair:
Prev Open: 1.33859
Open: 1.33177
% chg. over the last day: -0.51
Day’s range: 1.32797 – 1.33226
52 wk range: 1.2949 – 1.4669
USD/CAD quotes have been declining. During yesterday’s and today’s trading sessions, Canadian dollar added more than 100 points in price against the greenback. The USD/CAD currency pair has set new local lows. At the moment, the loonie is consolidating in the range of 1.3280-1.3330. USD/CAD quotes have the potential for further decline. We recommend paying attention to the dynamics of “black gold” prices. Positions should be opened from key levels.
Today, the news feed on Canada’s economy is quite calm.
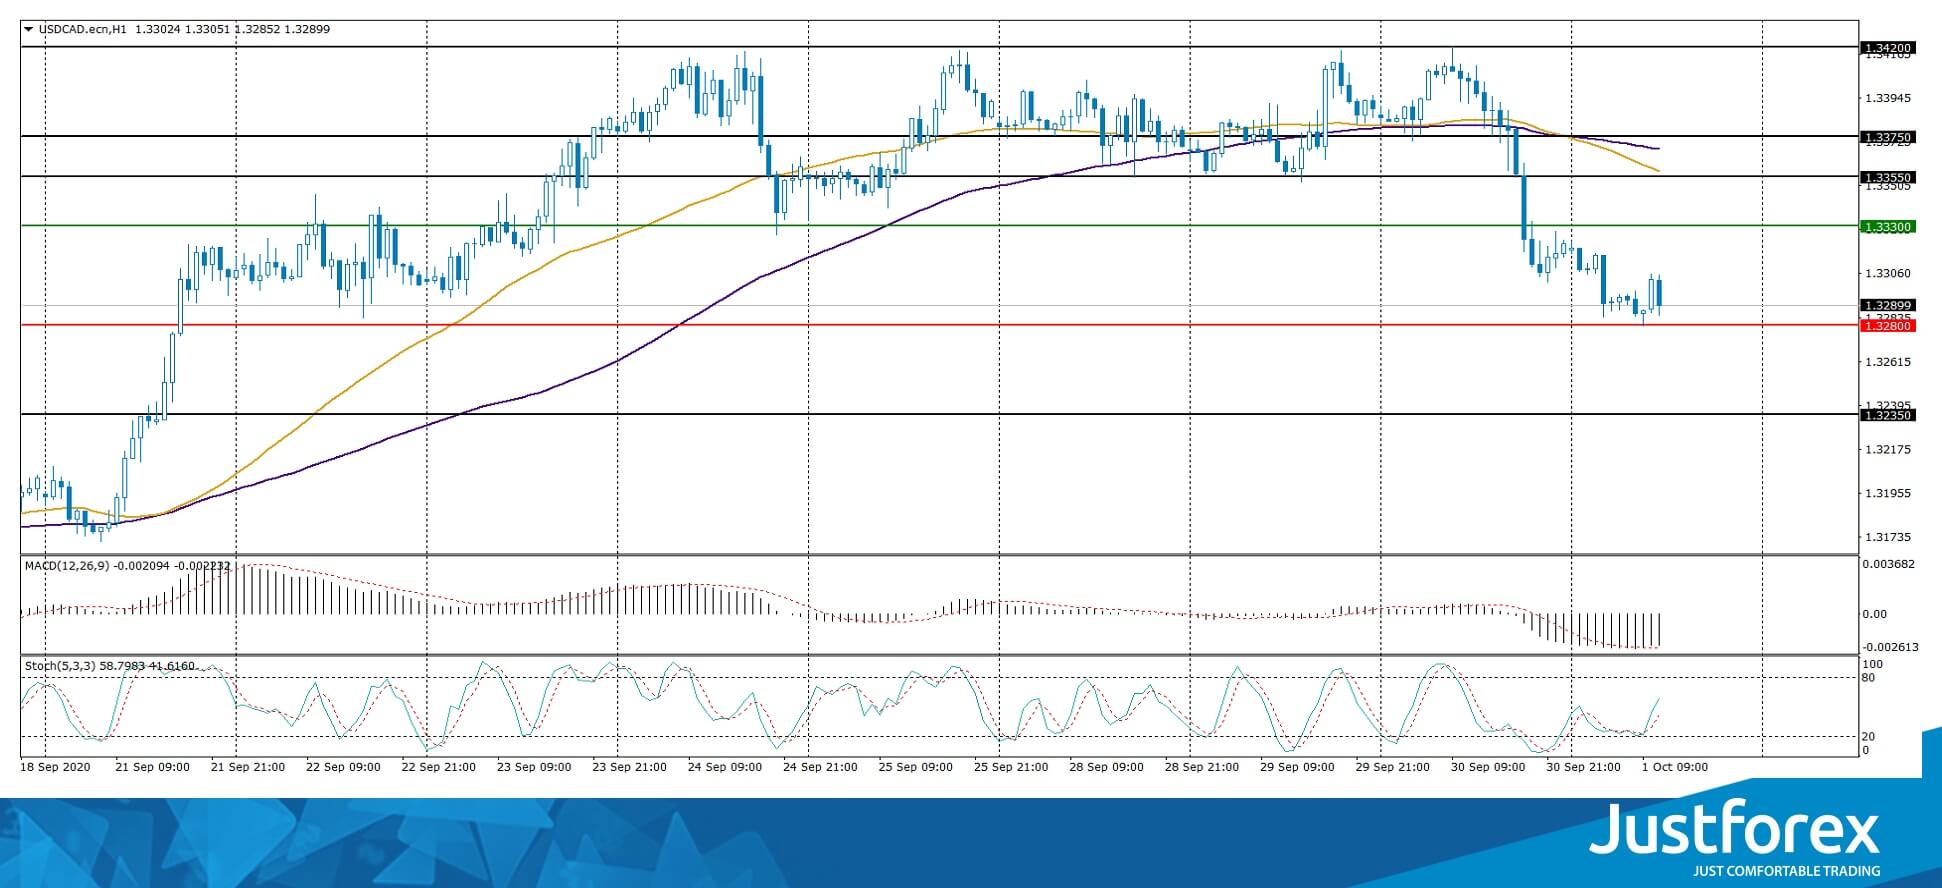
Indicators signal the power of sellers: the price has fixed below 50 MA and 100 MA.
The MACD histogram is in the negative zone, which indicates the bearish sentiment.
Stochastic Oscillator is in the neutral zone, the %K line is above the %D line, which gives a signal to buy USD/CAD.
Trading recommendations
Support levels: 1.3280, 1.3235, 1.3200
Resistance levels: 1.3330, 1.3355, 1.3375
If the price fixes below 1.3280, a further drop in USD/CAD quotes is expected. The movement is tending to 1.3240-1.3220.
An alternative could be the growth of the USD/CAD currency pair to 1.3355-1.3380.
The USD/JPY currency pair
Technical indicators of the currency pair:
Prev Open: 105.621
Open: 105.466
% chg. over the last day: -0.18
Day’s range: 105.403 – 105.585
52 wk range: 101.19 – 112.41
The USD/JPY currency pair is still being traded in flat. The technical pattern remains ambiguous. The key support and resistance levels are 105.40 and 105.80, respectively. Investors expect additional drivers. Today, we recommend paying attention to economic releases, as well as to the dynamics of US government bonds yield. Positions should be opened from key levels.
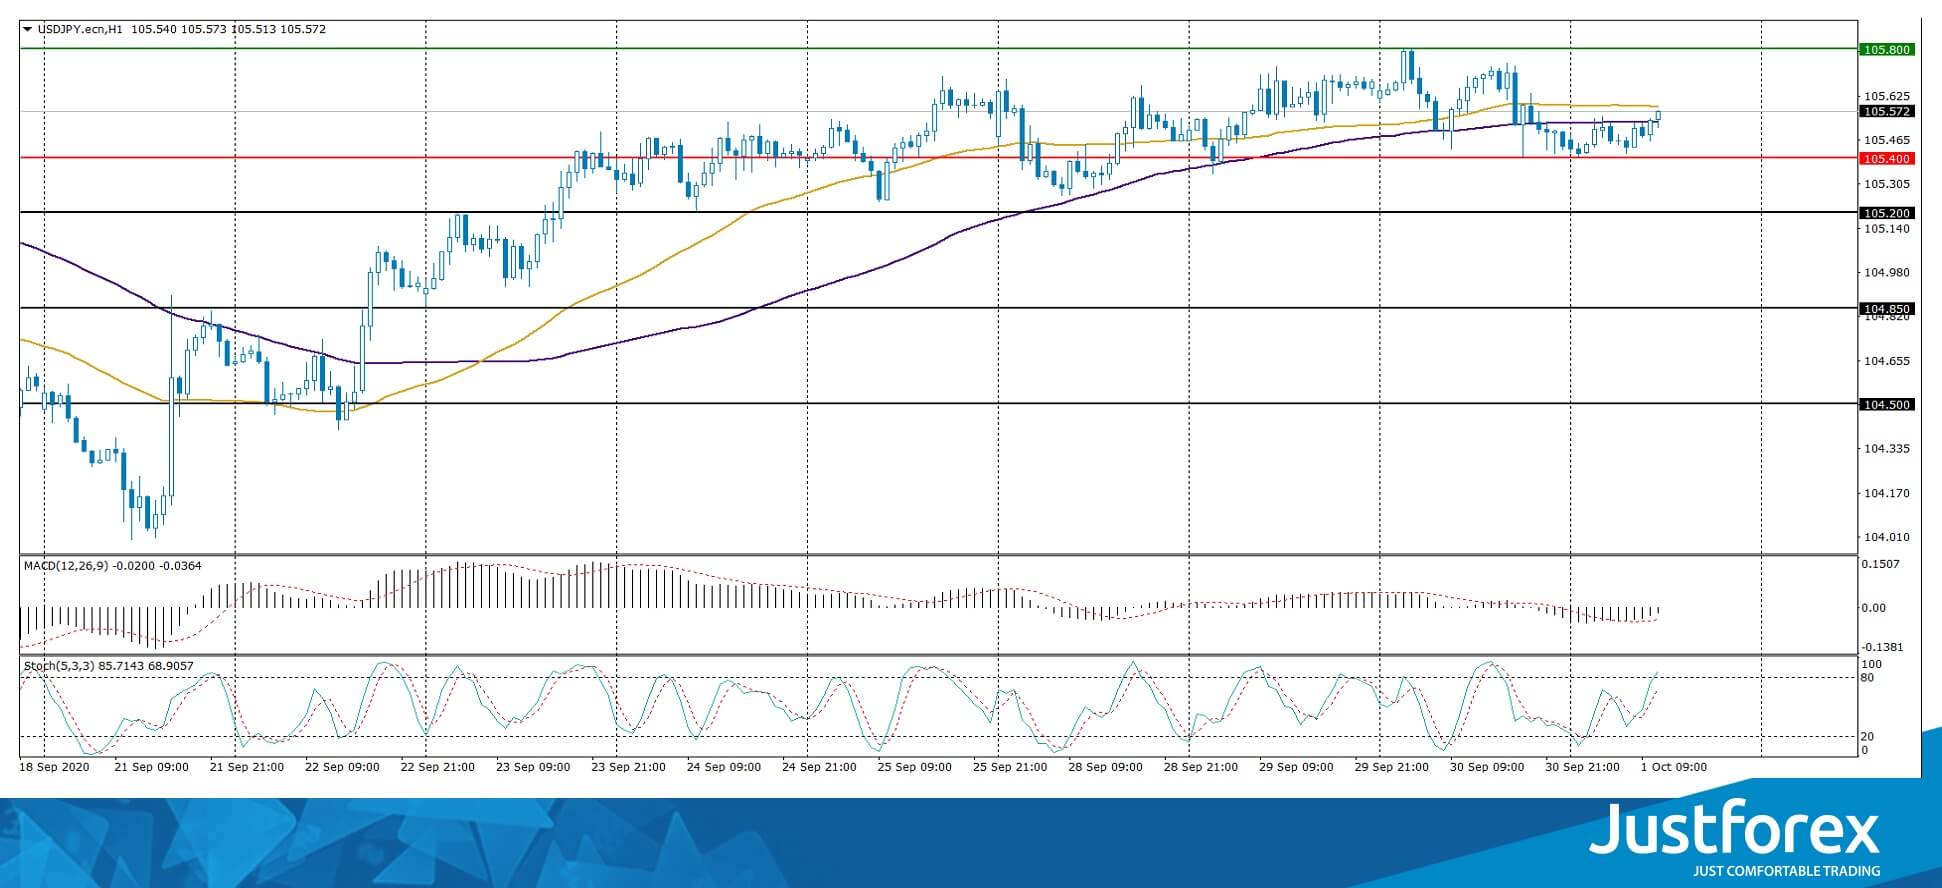
Indicators do not give accurate signals: the price has crossed the 50 MA and 100 MA.
The MACD histogram is near the 0 mark.
Stochastic Oscillator is in the neutral zone, the %K line is above the %D line, which gives a signal to buy USD/JPY.
Trading recommendations
Support levels: 105.40, 105.20, 104.85
Resistance levels: 105.80, 106.00
If the price fixes above the level of 105.80, further growth of USD/JPY quotes is expected. The movement is tending to 106.10-106.40.
An alternative could be a decline in the USD/JPY currency pair to 105.20-104.90.


