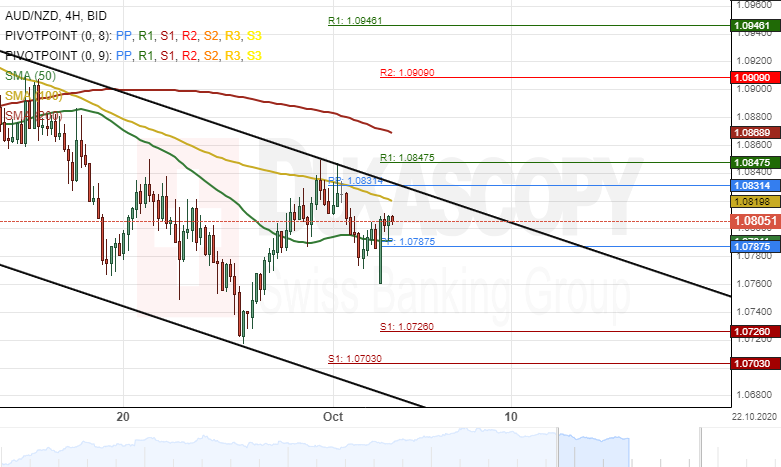
The Australian Dollar has surged by 118 pips or 1.10% against the New Zealand Dollar since last week’s trading sessions. The currency pair breached the 100– period simple moving average at 1.0831 on September 30.
Technical indicators suggest selling signals on the 4H time-frame chart. Most likely, the exchange rate could edge lower during this week’s trading sessions. The possible target for bears would be at the 1.0650.
However, given that the currency exchange rate is currently trading near the upper line of a descending channel pattern, a breakout could occur within this week’s sessions.