
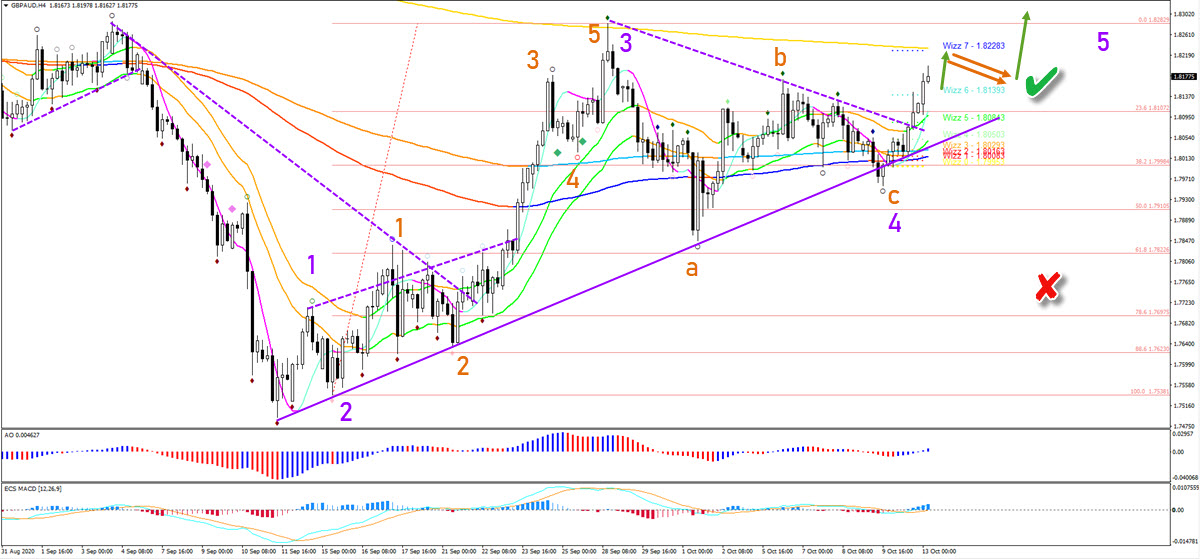
GBP/AUD bulls are breaking above the resistance trend line (dotted purple line). Price action seems to have completed a wave 4 (purple) pattern.
The GBP/AUD will probably build a bull flag chart pattern on the 4 hour chart (orange arrows). The main candidate is the resistance zone around 1.8225-50.
This remains valid as long as price action stays above the 61.8% Fib (red x) at 1.8050. The support zone and the Fibonacci retracement levels are two main candidates.
The GBP/AUD bulls are breaking above the resistance trend line (dotted purple line). Price action seems to have completed a wave 4 (purple) pattern. Price is now preparing for a target at 1.85. How could traders profit from this expected price movement?
Price Charts and Technical Analysis
The GBP/AUD will probably build a bull flag chart pattern on the 4 hour chart (orange arrows). The main candidate is the resistance zone around 1.8225-50 due to the long-term moving averages, previous tops, and Wizz 7 level.
A break above the flag could confirm the bullish continuation within wave 5 (purple). Whereas only a break below the 61.8% Fib invalidates (red x) this wave pattern and outlook.
On the 1 hour chart, the GBP/AUD is showing strong bullish momentum (green diamonds). Price action is probably completing a wave 3 and any potential pullback could be a wave 4 (orange).
This remains valid as long as price action stays above the 61.8% Fib (red x) at 1.8050. The support zone and the Fibonacci retracement levels are two main candidates for a bullish bounce.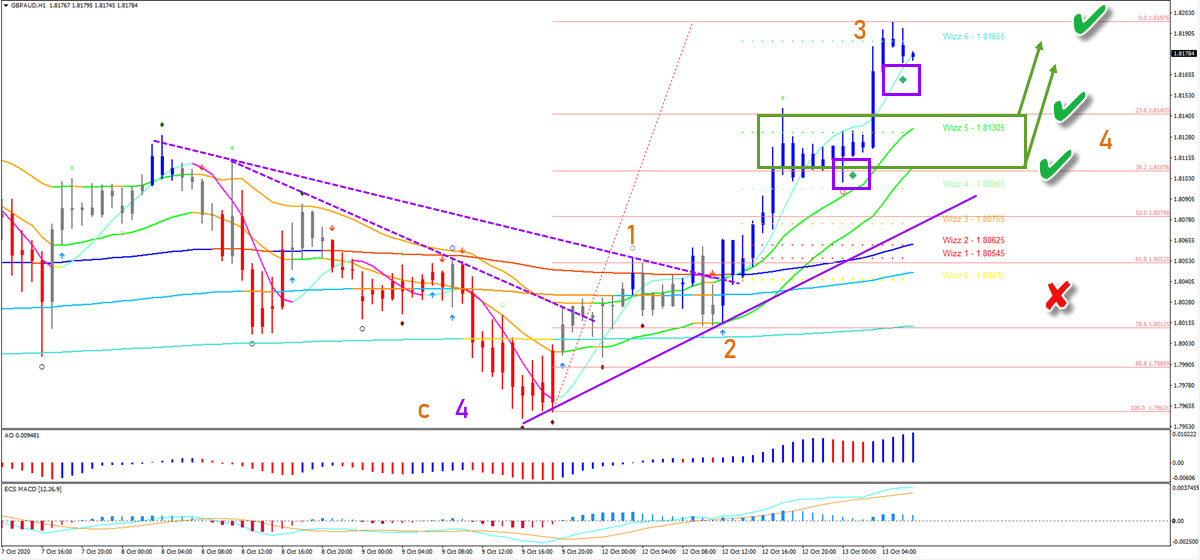


