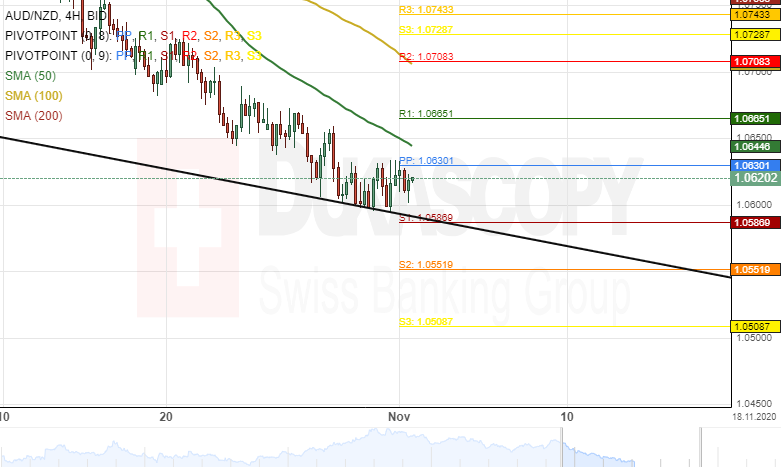
The Australian Dollar has declined by 2.29% against the New Zealand Dollar since October 13. The currency pair was pressured lower by the 50– period simple moving average during the past three weeks.
Technical indicators suggest selling signals on the 4 hours and daily time-frame charts. Most likely, bearish traders are likely to continue to edge lower during the following trading sessions.
However, the lower line of a descending channel pattern could provide support for the AUD/NZD currency exchange rate in the shorter term.