Pfizer (PFE) stock is in the news after announcing the development of Covid-19 vaccine – how is this impacting the price of Pfizer stock?
Pfizer stock has shown a significant bearish retracement on the weekly chart. The long-term MAs are flat and close to each other, which is indicating a range.
The bullish continuation (solid arrows) seems more likely at the moment. Bullish candlestick patterns are, however, needed to confirm the end of the retracement.
Pfizer (PFE) stock is in the news after announcing the development of Covid-19 vaccine by BioNTech-Pfizer. Early data suggested that the vaccine protects more than 90% of people developing symptoms. The E.U. has indicated it will buy 300 million – how is this impacting the price of Pfizer stock?
This article reviews the chart and wave patterns on the Pfizer stock chart. We will review the key decision zones and possible breakout areas.
Price Charts and Technical Analysis
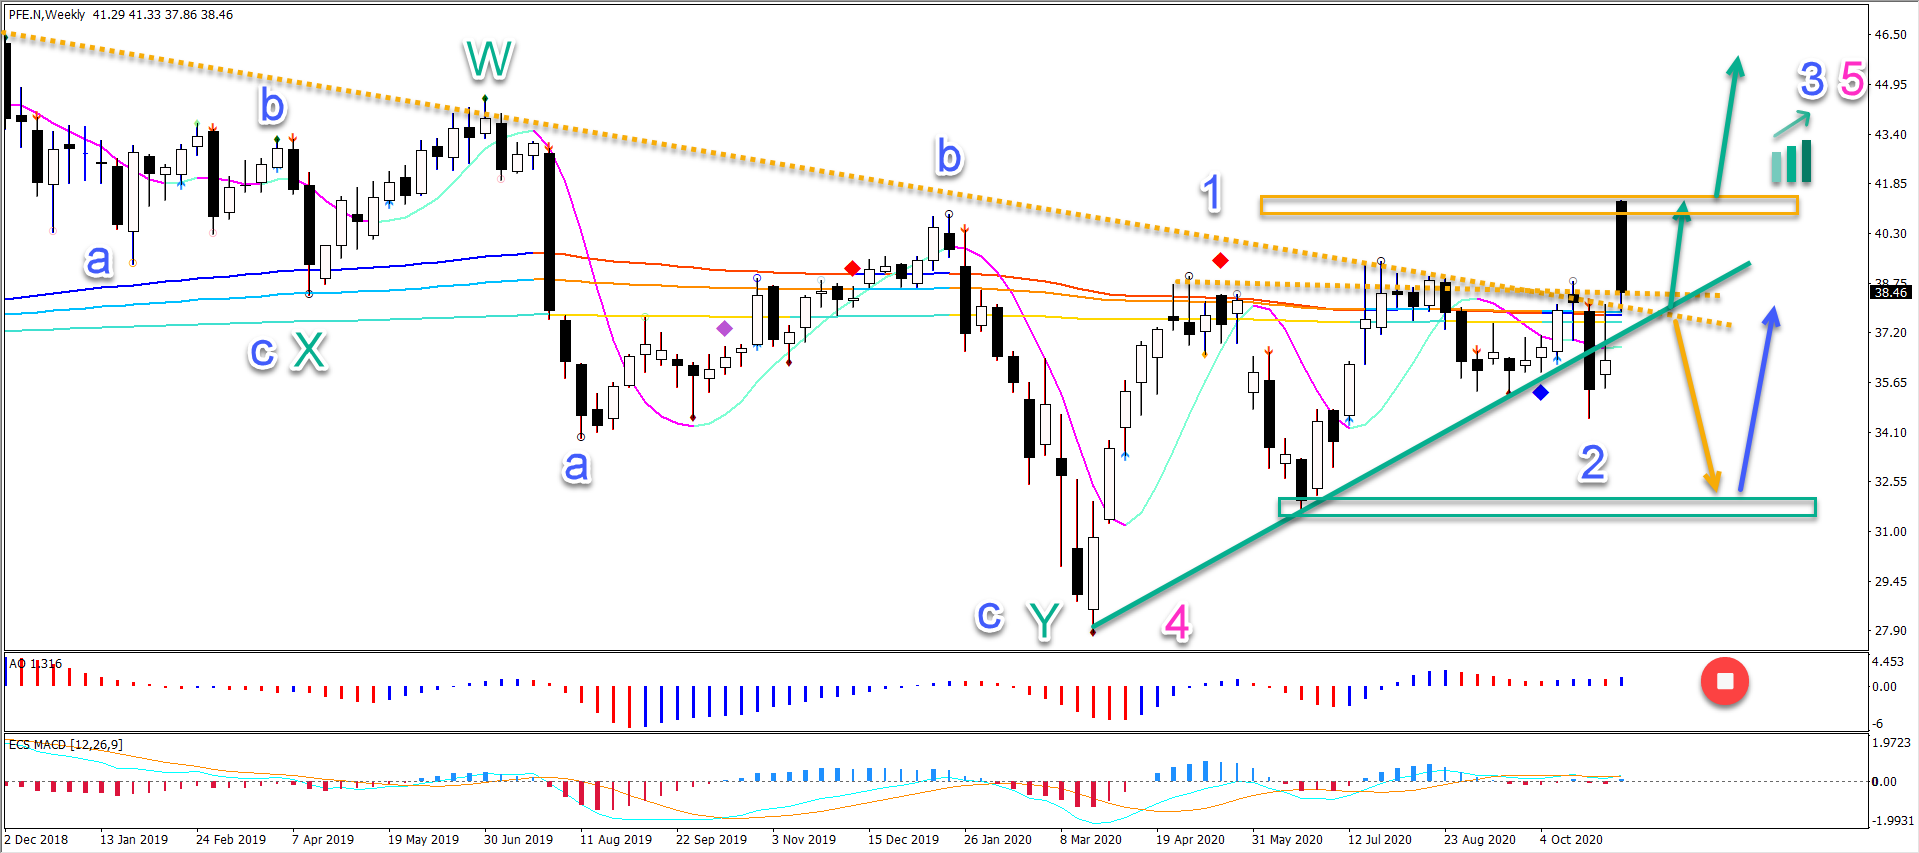
Pfizer stock has shown a significant bearish retracement on the weekly chart. The long-term moving averages are flat and close to each other, which is indicating a range.
The long-term Elliott Wave patterns suggest the end of a wave 4 (green) correction at the most recent low. This could indicate the potential start of an uptrend.
Price action has already broken above the resistance trend line (dotted lines). This confirms the first higher high besides the higher lows.
Price action is now in a retracement and retesting the broken resistance, which now becomes potential support. This is a key decision for a bullish bounce or bearish breakout:
Bullish bounce: price stays above the trend lines and moving averages. Eventually price needs to break above the resistance box (orange) for a full uptrend confirmation.
Bearish breakout: this indicates a larger retracement and price could test the support zone (green box) within a deeper wave 2 (blue).
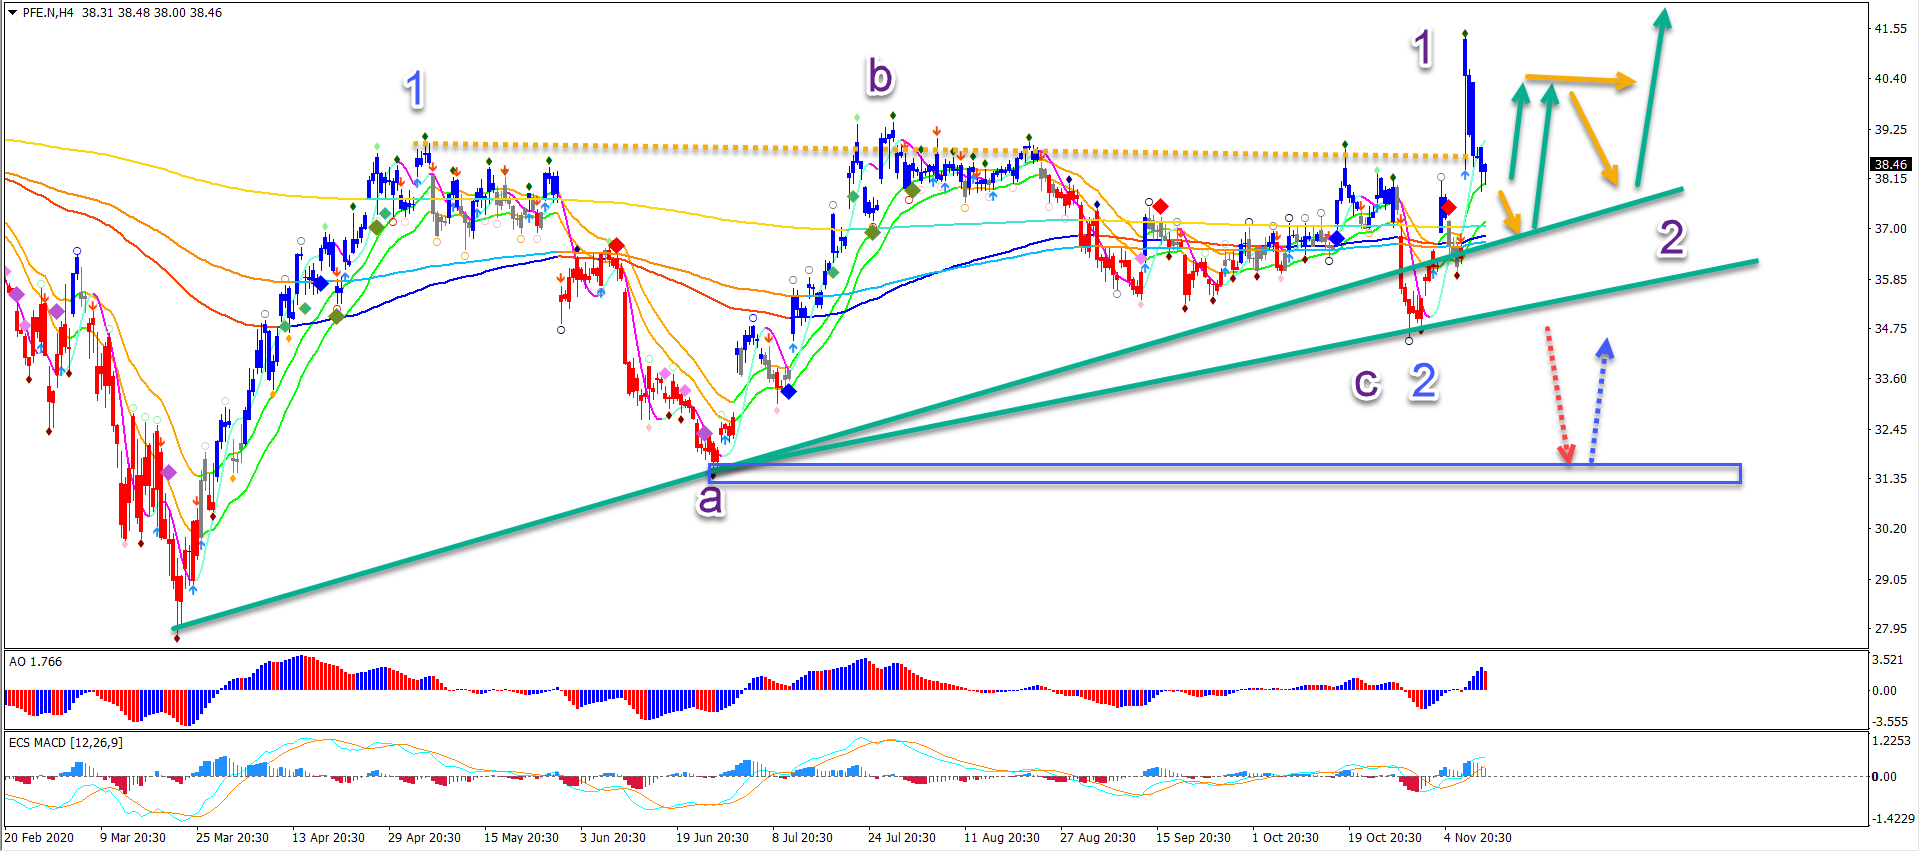
On the 4 chart, price action is either in a wave 2 or has completed a wave 2 (purple). This will depend if price action uses the support zone for a bounce. Or if price makes a bearish break and tests the support zone (blue box).
The bullish continuation (solid arrows) seems more likely at the moment. Especially after price action closed the gap. Bullish candlestick patterns are, however, needed to confirm the end of the retracement.