
The EUR/USD currency pair
Technical indicators of the currency pair:
Prev Open: 1.1852
Prev Close: 1.1840
% chg. over the last day: -0.10%
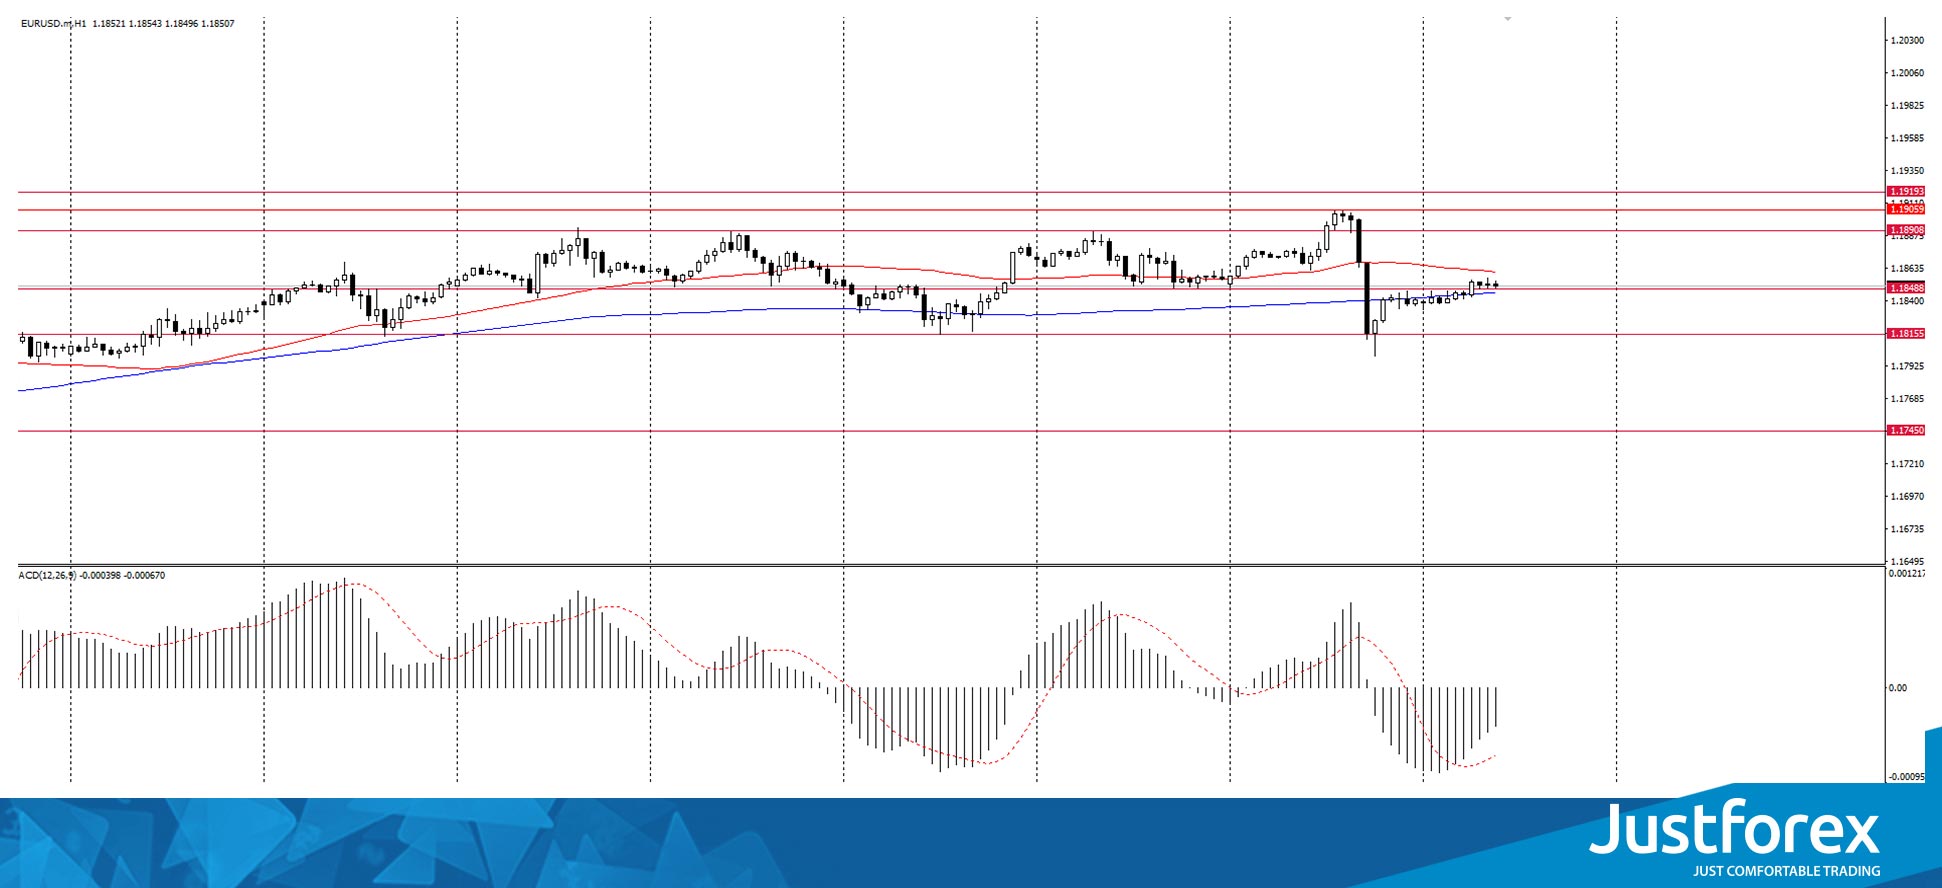
Eurozone economic activity has fallen sharply in November as renewed restrictions aimed at preventing the coronavirus spread forced many companies in the bloc’s services sector to close temporarily. The EUR/USD currency pair showed a negative trend of 0.10% amid these data. The currency pair is growing this morning. An uptrend is observed on the chart, which indicates the predominance of purchases on this asset. On the hourly timeframe, the price is being traded above the moving average MA 200. On the H4 timeframe, the situation is similar. The MACD indicator is in the negative zone. Based on the above, it is worth considering only buy positions while the price is above MA200 on H1.
Trading recommendations
Support levels: 1.1848, 1.1815, 1.1745
Resistance levels: 1.1890, 1.1905, 1.1920
The main scenario for EUR/USD trading is looking for buy entry points. If the price breaks through and fixes above 1.1890, it is better to consider purchases. After breaking through the 1.1890 mark, quotes may move to the level of 1.1920.
Alternative scenario: if the price fixes below 1.1848 on the H1 timeframe and below MA200 on H1, the currency pair is likely to decline to 1.1815.
News feed for 2020.11.24:
- German GDP at 9:00 (GMT+2);
- German business climate index at 11:00 (GMT+2);
- Speech by ECB President Lagarde at 16:00 (GMT+2);
- US consumer confidence index at 17:00 (GMT+2).
The GBP/USD currency pair
Technical indicators of the currency pair:
Prev Open: 1.3289
Prev Close: 1.3324
% chg. over the last day: +0.26%
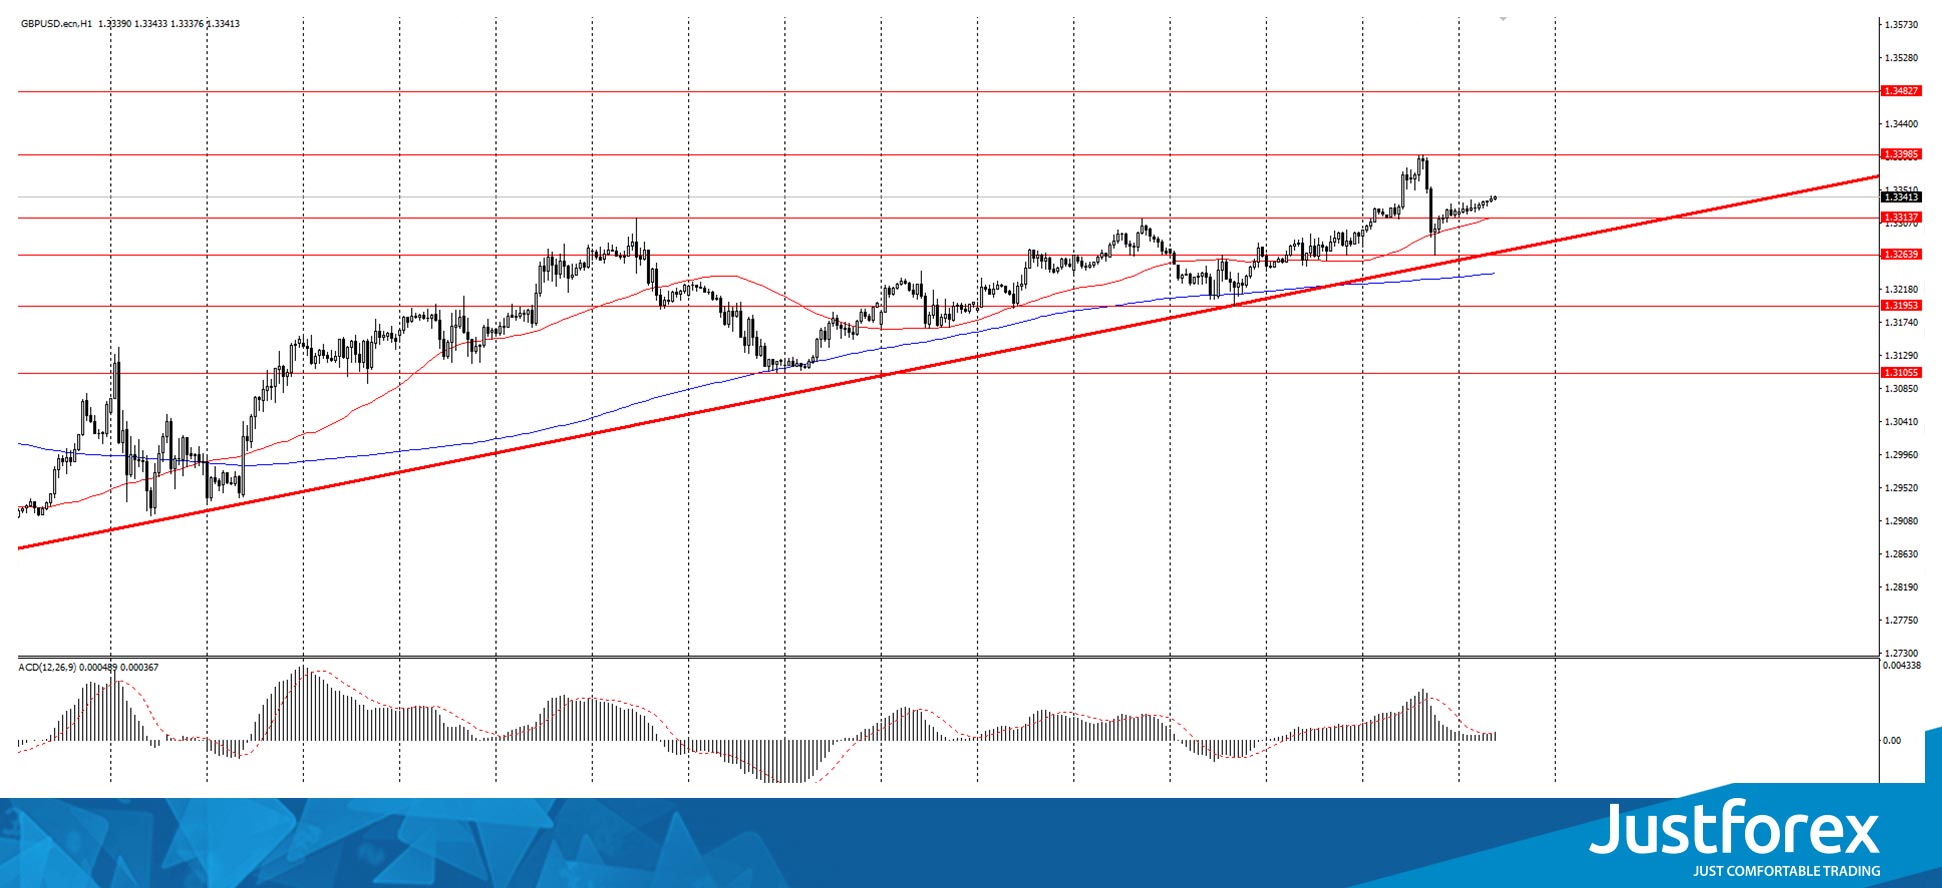
UK economic activity has decreased in November as a new wave of coronavirus restrictions hit the services industry, but news of possible vaccines has brought hopes for 2021. As a result, the currency pair has fallen by 100 points. Yesterday, the currency pair closed the day with +0.26%. On the hourly chart, GBP/USD is being traded above the moving average MA (200) H1. The situation is similar on the four-hour chart. The MACD indicator is in the positive zone. There is still an uptrend. Based on the above, it is necessary to look for buy entry points while the pair remains above MA 200 H1.
Trading recommendations
Support levels: 1.3314, 1.3263, 1.3195, 1.3105
Resistance levels: 1.3398, 1.3482
The main scenario: look for buy entry points. If the price fixes above the level of 1.3314, one should consider purchases. Quotes may move to the level of 1.3398. It should also be noted that divergence is drawn on the MACD on the H4 timeframe. This may signal the beginning of a pair correction.
Alternative scenario: if the price fixes below 1.3314, then the asset may fall to $1.3263.
News feed for 2020.11.24:
- US consumer confidence index at 17:00 (GMT+2);
- UK autumn forecast statement.
The USD/JPY currency pair
Technical indicators of the currency pair:
Prev Open: 103.77
Prev Close: 104.54
% chg. over the last day: +0.74%
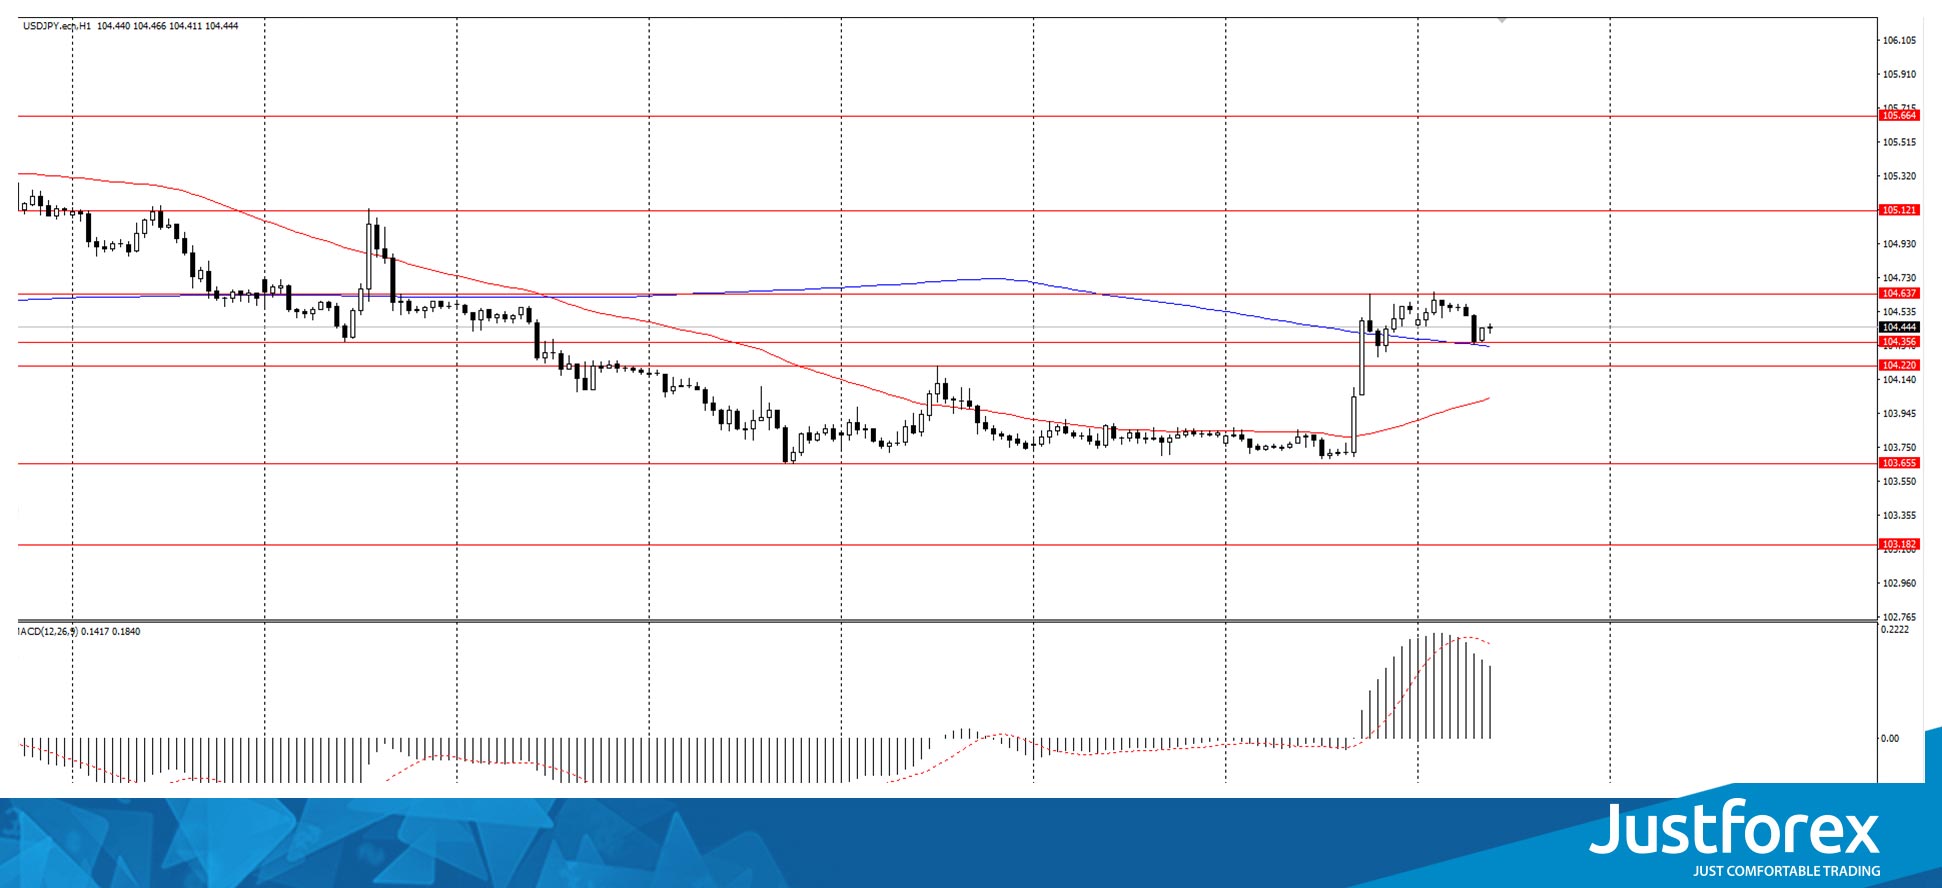
Yesterday, the USD/JPY currency pair was traded in an uptrend. The growth of the pair was caused by positive data on the US economic activity. The currency pair closed the day with +0.74%. Today, USD/JPY is being traded at yesterday’s close. On the hourly chart, the USD/JPY currency pair has fixed above the moving average MA (200). On the four-hour chart, the price is below MA200. The MACD indicator is in the positive zone. Based on the above, one should probably consider purchases while the pair remains above MA 200 on H1. We also recommend paying attention to how the currency pair will test MA200 on H4.
Trading recommendations
Support levels: 104.22, 103.65
Resistance levels: 104.63, 105.12
The main scenario: consider purchases. If the price breaks through the level of 104.63 and fixes above it, the currency pair may move to the level of 105.12.
An alternative scenario assumes consolidation below the level of 103.65, followed by a fall to the level of 103.18.
News feed for 2020.11.24:
- US consumer confidence index at 17:00 (GMT+2).
The USD/CAD currency pair
Technical indicators of the currency pair:
Prev Open: 1.3084
Prev Close: 1.3085
% chg. over the last day: 0%
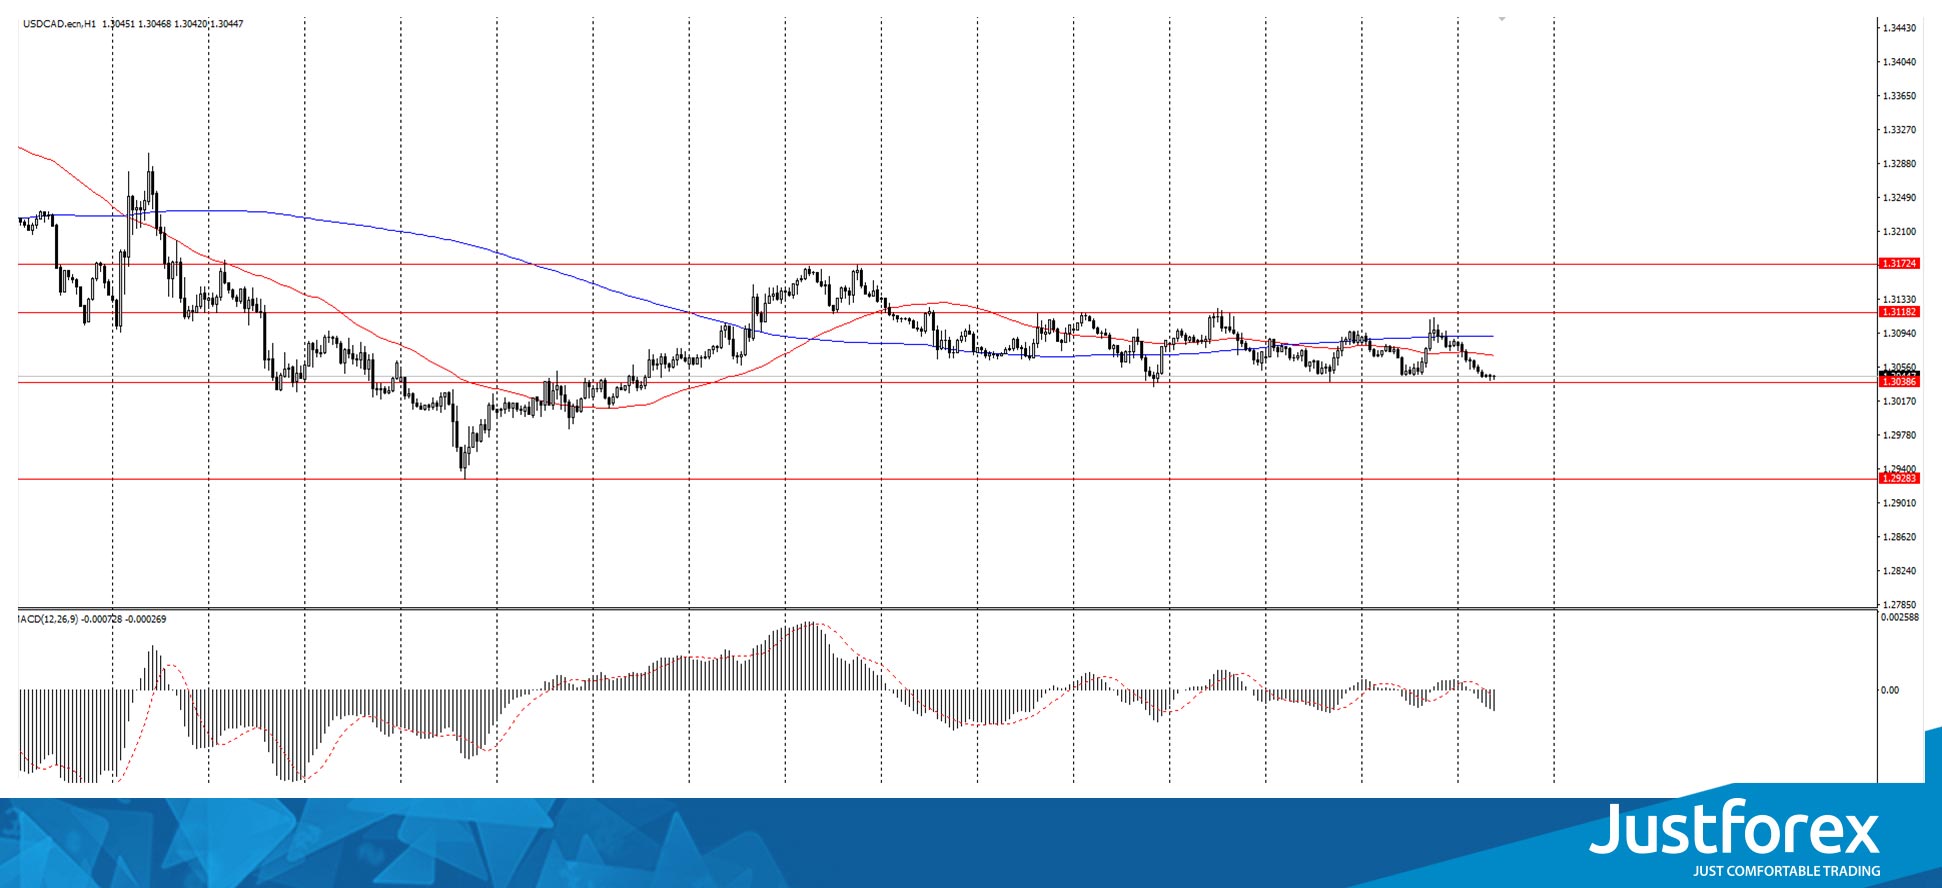
The USD/CAD currency pair is being traded in the 1.3038-1.3100 price range. Yesterday, it closed with a result of 0%. Today, the pair is being traded in a downtrend. On the H1 timeframe, USD/CAD is below the moving average MA 200. On the four-hour chart, the price is below the moving average. At the moment, a prolonged consolidation in the range of 1.3038-1.3110 is observed. If the price breaks through and fixes below the trading channel, one should consider selling the asset.
Trading recommendations
Support levels: 1.3038, 1.2928
Resistance levels: 1.3118, 1.3172
The main scenario: if the price breaks through and fixes below the level of 1.3038, it is worth considering sales with a target up to 1.2928
Alternative scenario: if the price breaks through the level of 1.3118 and fixes above the MA200 on H1, you may consider a buy position to the level of 1.3172
News feed for 2020.11.24:
- US consumer confidence index at 17:00 (GMT+2).


