EUR/USD
Dollar gains extended on Tuesday, as easing geopolitical tensions coupled with better-than-expected US data. The EUR/USD pair extended its monthly decline down to 1.1686, early US session, with the following bounce well contained and with the pair ending the day around 1.1730. Partially responsible of the EUR’s decline was the German’s Q2 preliminary GDP, as the county grew at a slower-than-expected pace in the three months two June, although Q1 figures suffered upward revisions, and the figures were solid enough to indicate steady growth in the country. According to Destatis the economy grew by 0.6% in the quarter, while on a YoY, unadjusted basis, the economy advanced by 0.8%, well below previous 3.2%.
In the US, July retail sales figures were better-than-expected, with the main monthly reading rising 0.6%, above the consensus 0.3% forecast, whilst June figure was upwardly revised from -0.2%MoM to +0.3%MoM. Also, business activity grew at a much stronger-than-expected pace in the NY State according to the local manufacturing index that jumped to 25.2 in August from 9.0 in July. Overall, and while inflation is still a drag, the US economy seems to be strong enough to tolerate a third rate hike this year.
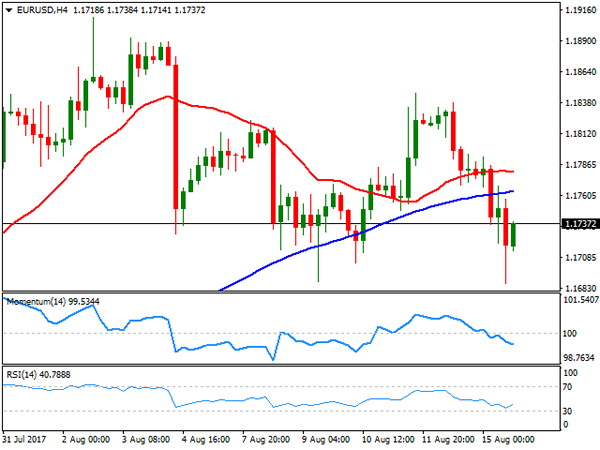
The EUR/USD pair has set a lower high for the week, with an early attempt to rally beyond 1.1800 being quickly reverted, adding to the case of a bottom to the latest dollar slump. From a technical point of view, however, the 1.1690 region is still proving to be a nice "buying on dips" level, although if the price does not advance beyond 1.1760, bulls may prefer to take profits out. Technical readings in the 4 hours chart, indicate that the pair may continue falling, as the Momentum indicator keeps grinding south within negative territory while the RSI consolidates around 40, and the price below its moving averages. These lasts, are losing directional strength and within a limited range, reflecting the uncertainty going on about where to go next.
Support levels: 1.1770 1.1735 1.1690
Resistance levels: 1.1820 1.1860 1.1910
USD/JPY
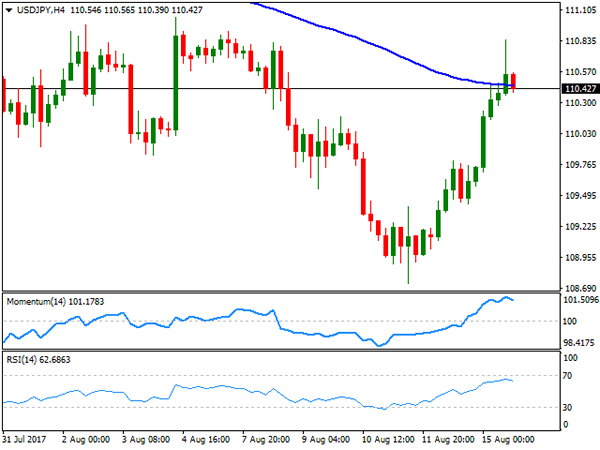
The USD/JPY pair settled at 110.43 after trading as high as 110.84 early US session, fueled by easing geopolitical concerns and a batch of solid US data that spooked away fears of an on-hold Fed for the rest of the year. The Yen was hit during Asian trading hours by news that North Korea backed away from its threat to launch missiles towards Guam, later pressured by rising stocks and bond yields. The US Treasury 10-year note yield peaked at 2.27% for the day, up from Friday’s settlement at 2.19%, although the poor performance of Wall Street and yields retreating modestly in the US afternoon, helped the pair correcting lower. The Japanese calendar will remain empty this Wednesday, with the focus on US housing data and the latest FOMC minutes to be released later on the day. In the meantime, the 4 hours chart shows that the price settled around its 100 SMA, while technical indicators are losing upward strength near overbought readings, indicating decreasing buying interest at current levels. The pair needs to advance beyond 111.05 to be able to resume its advance during the upcoming sessions, and approach then to the 112.00 figure.
Support levels: 110.35 110.00 109.70
Resistance levels: 111.05 111.40 111.80
GBP/USD
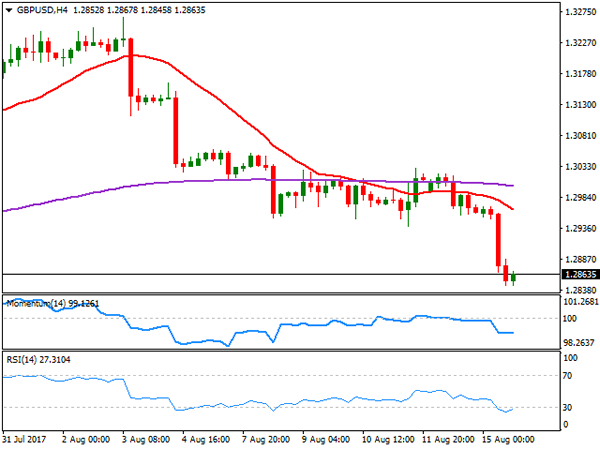
The GBP/USD pair plunged to 1.2845 its lowest in over a month, after a second consecutive UK inflation reading below expected, dented further the case of a near-term rate hike in the kingdom. Headline inflation remained unchanged in July at 2.6% YoY and against expectations of higher readings, while for the month, the CPI fell by 0.1%. The Producer Price index also proved weak, with output prices up by 0.1% against previous and expected 0.2%. While still above the central bank’s 2.0% target, inflation easing from near 3.0% and the uncertainty surrounding the Brexit will likely keep the Pound subdued, regardless dollar’s self-strength or weakness. Anyway, better-than-expected US sales and manufacturing data fueled the decline for the pair, leaving it at risk of falling further. Having shed over 100 pips for the day, the pair is now consolidating around 1.2870, with the 4 hours chart showing that the price is well below a now bearish 20 SMA, while the Momentum indicator consolidates within negative territory and the RSI indicator in oversold levels, with no signs of upward corrective movement ahead.
Support levels: 1.2830 1.2795 1.2760
Resistance levels: 1.2910 1.2950 1.2990
GOLD
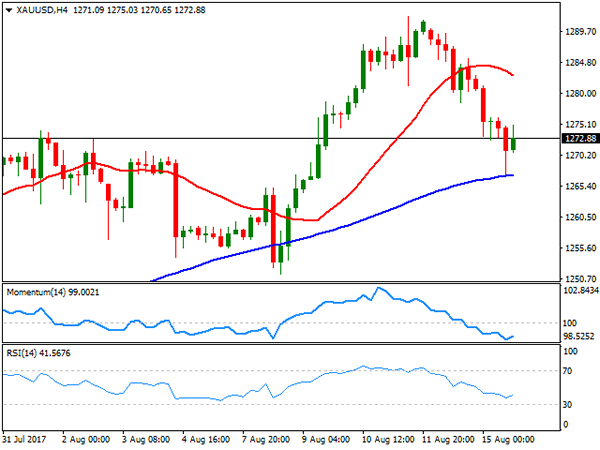
Gold prices fell strongly for a second consecutive day, although recovered partially ahead of Wall Street’s close, as dollar’s momentum faded in the US afternoon. Risk aversion kept easing on Tuesday on cooling tensions between North Korea and the US, whilst strong US retail sales and manufacturing data underpinned the greenback. Spot gold settled at $1,274.06 a troy ounce after trading as low as 1,267.24. The daily chart shows that timid buying interest surged around a bullish 20 DMA, a few cents above the mentioned daily low, while technical indicators extended their slides within positive territory, now getting closer to their mid-lines. In the 4 hours chart and for the shorter term, the risk is towards the downside, as the 20 SMA is gaining downward strength well above the current level, whilst technical indicators barely bounced from near oversold readings. In this last time frame, the daily low converges with a modestly bullish 100 SMA making of the 1,267.00 area a major support for this Wednesday, as a break below it will likely result in a new leg lower.
Support levels: 1,267.00 1,260.90 1,251.90
Resistance levels: 1,276.15 1,285.50 1,295.60
WTI CRUDE OIL
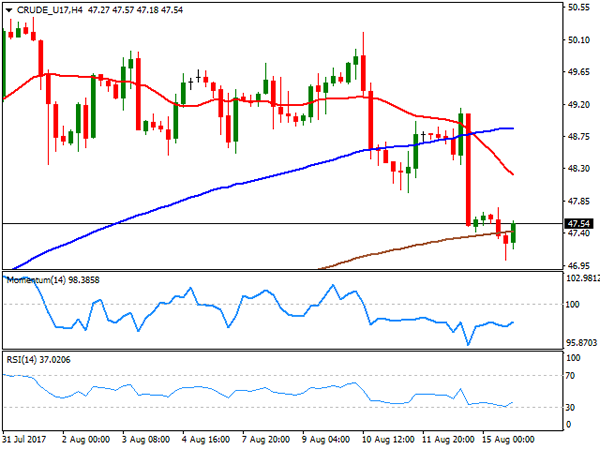
West Texas Intermediate crude futures closed the day unchanged around $47.50 a barrel, recovering in the US afternoon from an early slide to 47.02 a three-week low reached on concerns over growing supply from worldwide producers and slowed demand coming from China. US weekly crude oil stockpiles are expected to show another drawn for the week ended August 11th, with investors anticipating a 3.1 million barrels’ decline. Easing dollar demand by the end of the day, helped the commodity bouncing, but the risk remains towards the downside, as in the daily chart, technical indicators maintain their bearish slopes within negative territory, while the price is hovering around a bearish 100 DMA. In the 4 hours chart, the price is stuck around the 200 SMA, and well below the 20 and 100 SMAs, with the shortest extending its slide below the largest, also favoring the downside. Technical indicators in this last time frame, have lost their bearish strength, but remain within negative territory and with limited upward strength, also in line with the ongoing downward momentum.
Support levels: 47.00 46.60 45.90
Resistance levels: 47.95 48.60 49.10
DJIA
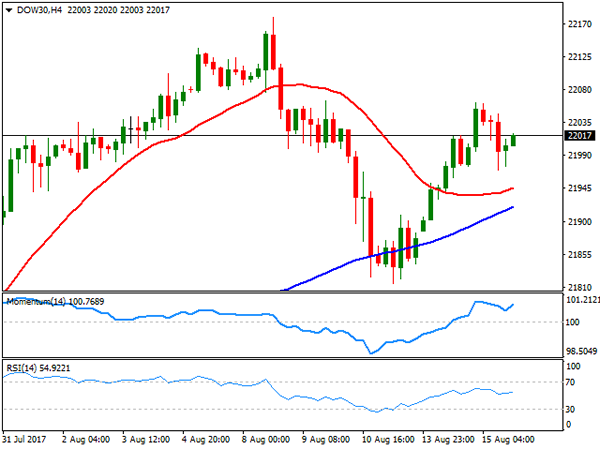
US indexes hovered between gains and losses for most of this Tuesday, ending the mixed, but not far from their opening levels, on fading enthusiasm over easing risk aversion and investors needing fresh clues to take decisions, in the form of FOMC Minutes, to be unveiled this Wednesday. The Dow Jones Industrial Average ended the day at 21,998.99, up 5 points, whilst the Nasdaq Composite shed 7 points, to 6,333.01 and the S&P closed 0.05% lower at 2,464.61. Gainers outpaced losers within the Dow, with American Express leading advancers with a1.67% gain, followed by Apple that added 1.33%. Home Depot, on the other hand, was the worst performer, shedding 2.77%. From a technical point of view, the daily chart shows that the positive tone persists, as the index developed above a bullish 20 DMA, while technical indicators maintain modest upward slopes within positive territory, as the index posted a higher high and a higher low. For the shorter term, the 4 hours chart presents a bullish bias, as the 20 SMA gains upward strength below the current level, whilst technical indicators resumed their advances within positive territory after a modest downward correction, although standing below previous weekly highs.
Support levels: 21,970 21,931 21,892
Resistance levels: 22,062 22,096 22,137
FTSE100
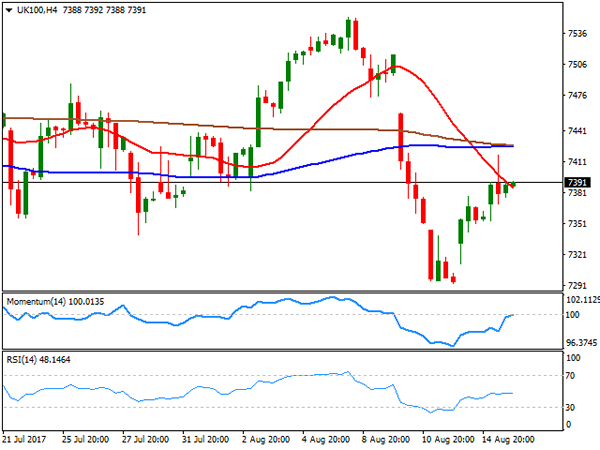
The FTSE 100 closed the day with modest gains at 7,383.85, up 30 points daily basis, as Pound’s weakness offset a decline in mining-related equities. A weaker GDP usually boosts the index, as most of its listed companies make profits abroad. Travel-related shares led the way higher across the region, and in the UK, TUI was the best performer, adding 7.15%, followed y EasyJet that closed 4.51% higher. Provident Financial led decliners, down 3.78%, followed by Randgold Resources and Fresnillo, both down around 3.0%. Holding near the mentioned close, the daily chart shows that the Footsie settled a few points below its 20 and 100 SMAs, while technical indicators aim modestly higher, still within negative territory and with limited upward strength. In the 4 hours chart, a bearish 20 SMA continues attracting selling interest, now around the current level, while technical indicators lost upward strength within negative territory, indicating that further recoveries are unlikely at the time being.
Support levels: 7,343 7,312 7,281
Resistance levels: 7,415 7,440 7,477
DAX
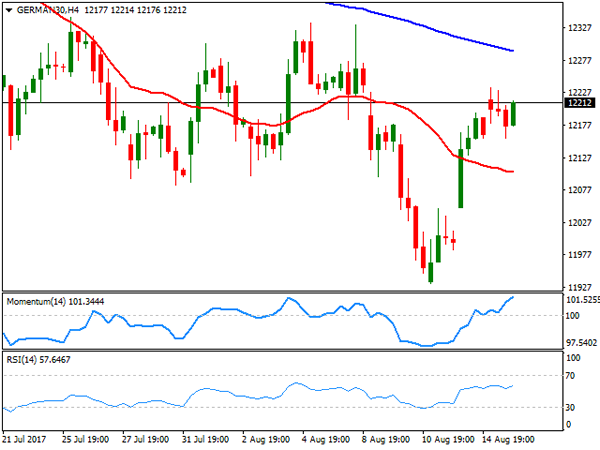
European equities ended the day with modest gains, with the German DAX adding 11 points to its Monday’s rally to settle at 12,177.04. Within the benchmark, Lufthansa rose 4.92%, leading advancers, on reports that the company is in talks aimed at rescuing Air Berlin, followed by RWE AG which added 1.96%. ProSiebenSat.1 was the worst performer, down 0.94%, followed by Henkel AG that closed 0.89% lower. The index stands at 12,210 ahead of the Asian opening, with the daily chart showing that technical indicators extended their advances, but lost upward momentum within neutral territory, while the index is unable to settle above a bearish 20 DMA. In the 4 hours chart, the benchmark presents a more bullish-constructive stance, as it holds above its 20 SMA, whilst technical indicators keep heading north above their mid-lines. The weekly high is at 12,235, the level to surpass to see the index actually turning bullish this Wednesday.
Support levels: 12,178 12,131 12,095
Resistance levels: 12,235 12,272 12,316