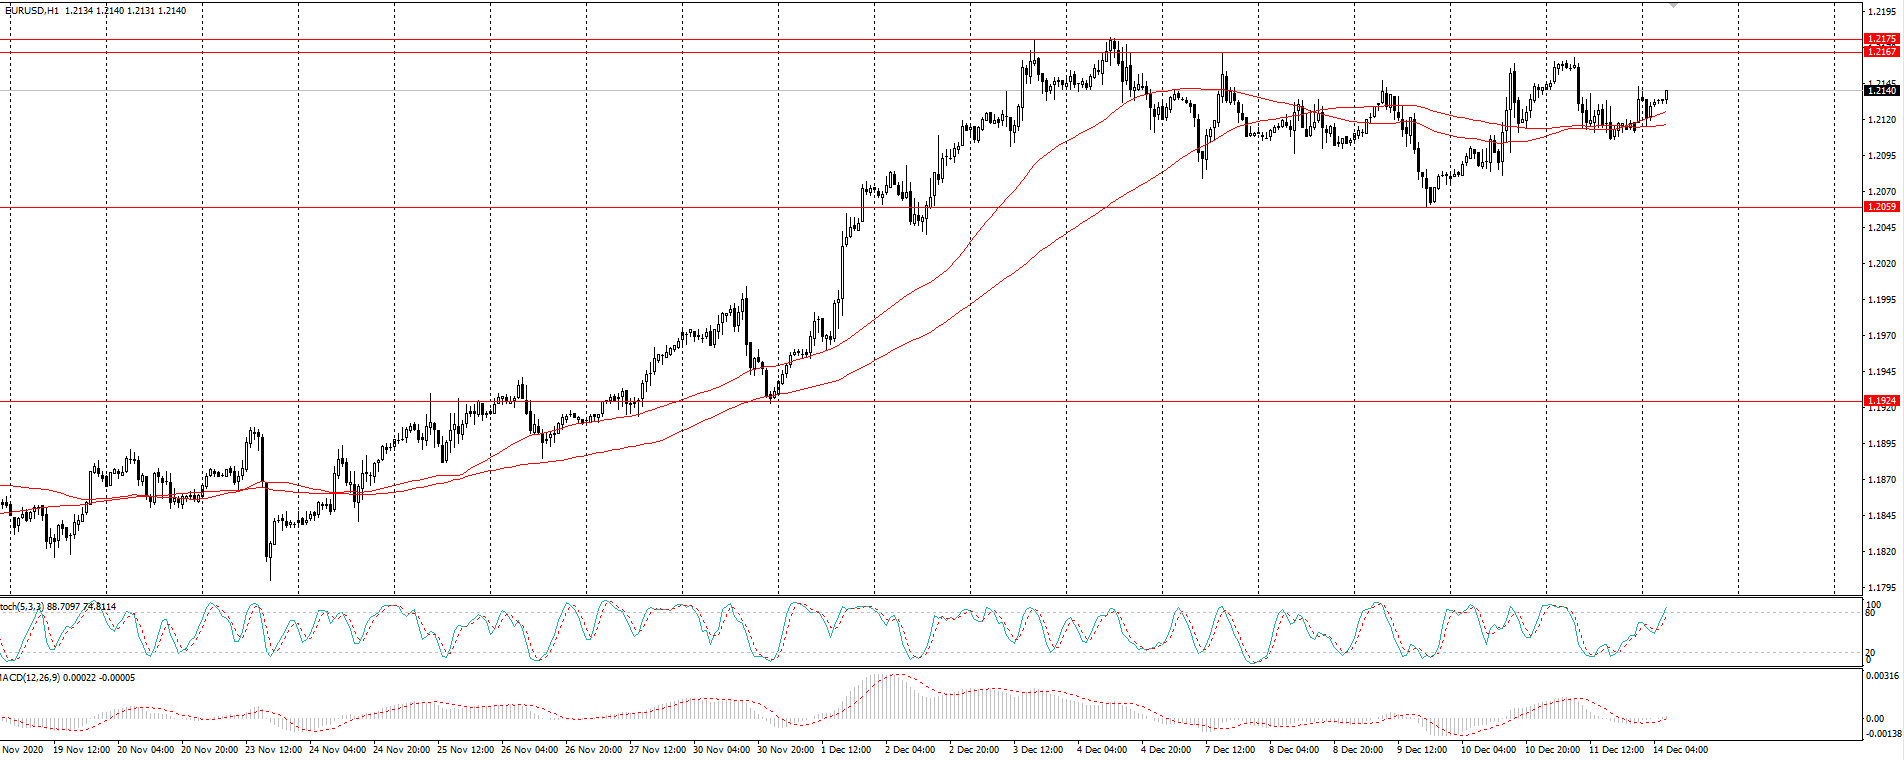
The EUR/USD currency pair
Technical indicators of the currency pair:
Prev Open: 1.2140
Prev Close: 1.2112
% chg. over the last day: -0.23%
EUR/USD returns lost positions in the Asian session, but the overall picture isn’t changing. Since December 4, the currency pair has been stuck in a range and will consolidate after a monthly rally, indicating the possibility of further gains in the mid-term. Information about negotiations around the Brexit agreement supports the European currency, but the continuation of the upward trend is still in question.
Trading recommendations
Support levels: 1.2175, 1.2167
Resistance levels: 1.2059, 1.1924
The main scenario: buying on a decline. Technical indicators and fundamental background are still on the bulls’ side, but be cautious. First, the price is close to annual highs. Secondly, a break-through of 1.2175 is required to continue the trend. As long as the pair is above SMA 100 and SMA 50, the likelihood of a bullish breakout remains. The MACD is in the positive zone, Stochastic has reached the overbought zone and indicates an approaching pullback.
Alternative scenario: if the price fixes below the level of 1.2116 on the H1 timeframe, the currency pair is likely to decline to 1.2159.
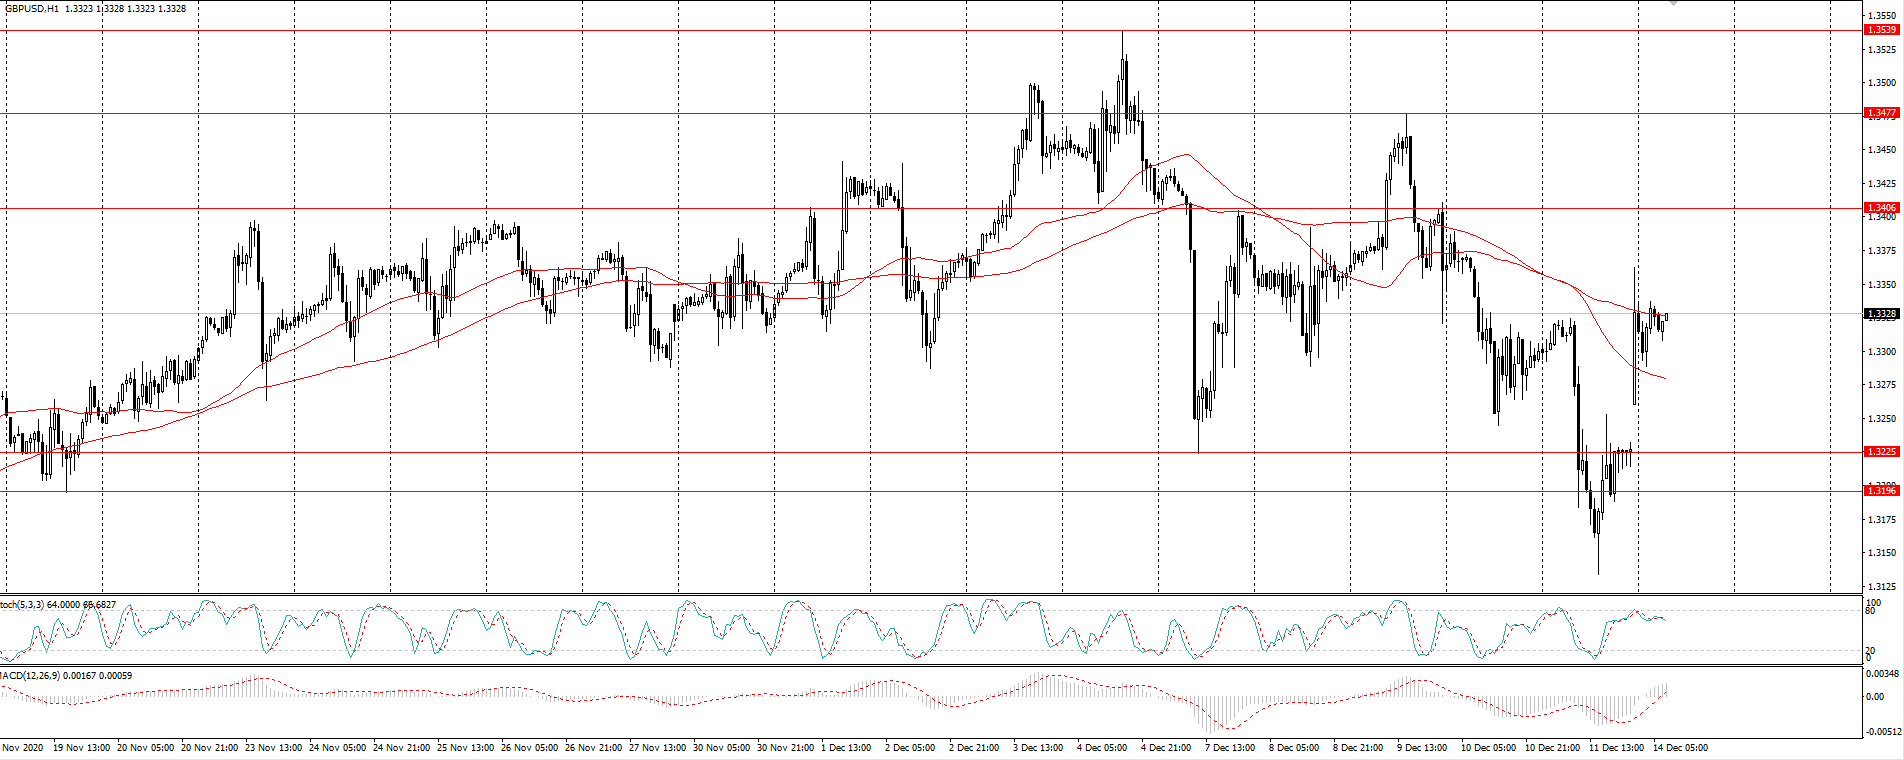
The GBP/USD currency pair
Technical indicators of the currency pair:
Prev Open: 1.3294
Prev Close: 1.3227
% chg. over the last day: -0.51%
Sterling regained its lost positions in the Asian session and remains bullish in the short term. Investors reacted positively to the information about the continuation of the negotiations. It is unlikely that this will be able to resume growth in the mid-term, but the likelihood of the sterling growth increased significantly.
Trading recommendations
Support levels: 1.3225, 1.3196
Resistance levels: 1.3407, 1.3477
The main scenario: buying on a decline. The price is stuck between the SMA 50 and SMA 100 levels, but the MACD has already moved into the positive zone, and the Stochastic has not reached the overbought level. The likelihood of the continuation of the northward movement remains high. The fixation above the moving average at 1.3327 of the H1 timeframe will strengthen the bullish signal.
Alternative scenario: if the price fixes below 1.3279, the bullish impetus will be lost, and buying the instrument can be considered.
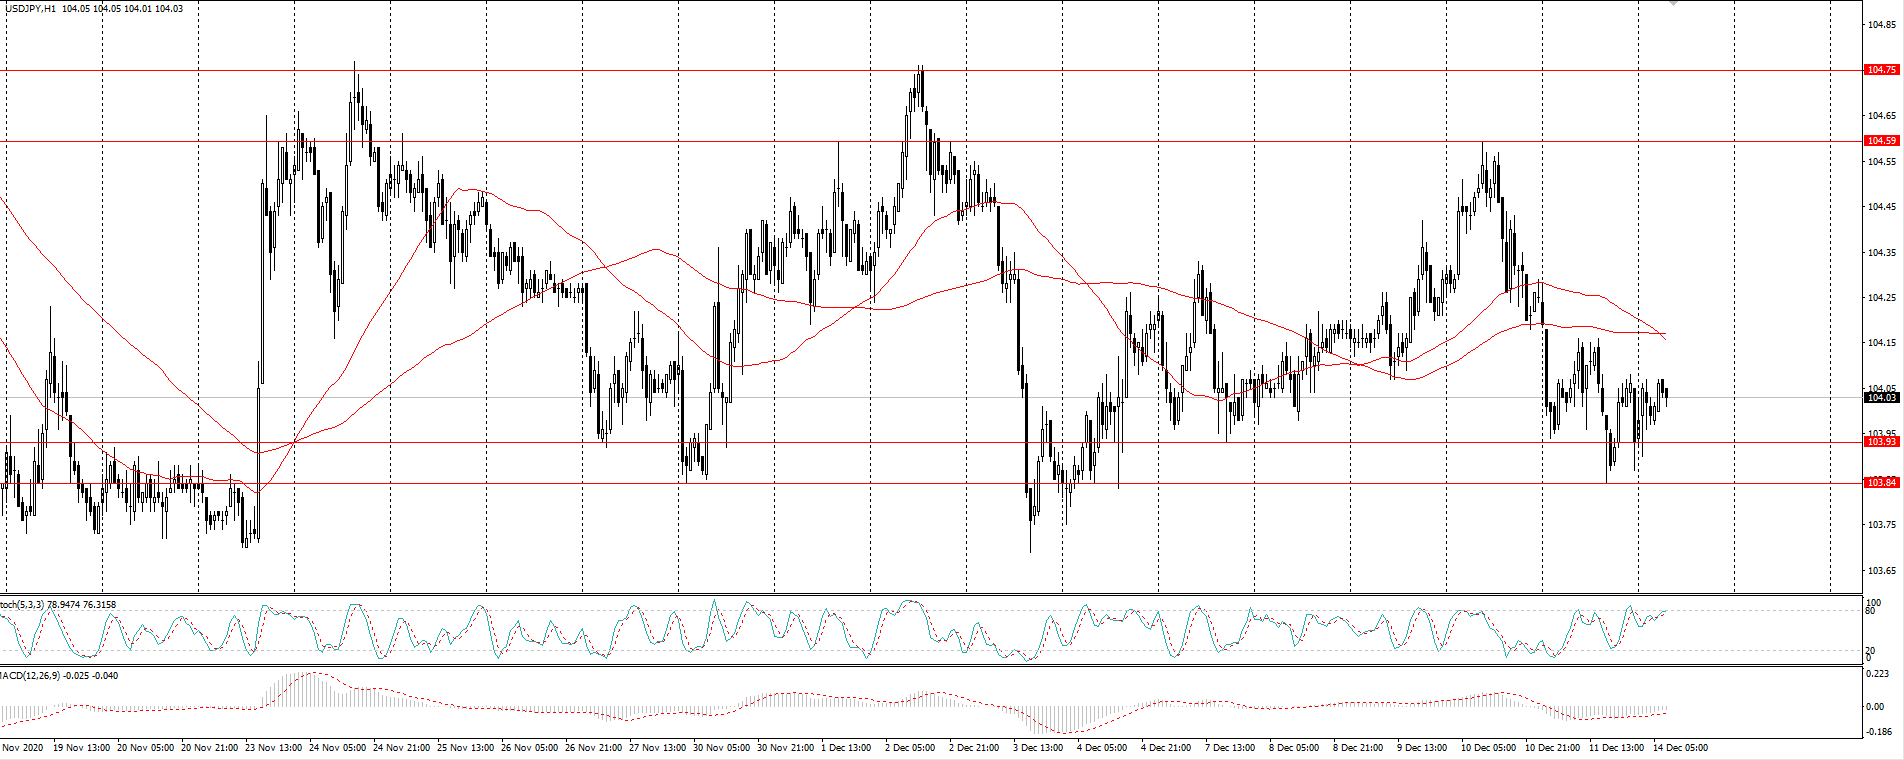
The USD/JPY currency pair
Technical indicators of the currency pair:
Prev Open: 104.25
Prev Close: 104.06
% chg. over the last day: -0.18%
On Friday, the trading session has closed in the red on the background of the aggravation of the situation in trade negotiations, but already with the beginning of the Asian session, the appetite for risk is recovering. The Japanese yen is gradually losing ground against the dollar. But the volatility in the currency pair continues to decline and it is difficult to expect any serious hike.
Trading recommendations
Support levels: 103.83, 103.93
Resistance levels: 104.59, 104.74
The main trading scenario for the pair – we consider trading in a sideways range between the levels of 104.59 and 103.83. Since the currency pair is near the lower border, you can try to buy with the target of 104.59 – 104.74. The expectations of a short-term upward movement will be strengthened by the break-through of the two moving averages in the 104.17 area. Oscillators don’t give any clear signal.
An alternative scenario assumes a breakdown to 103.83 and a fall to 103.19.
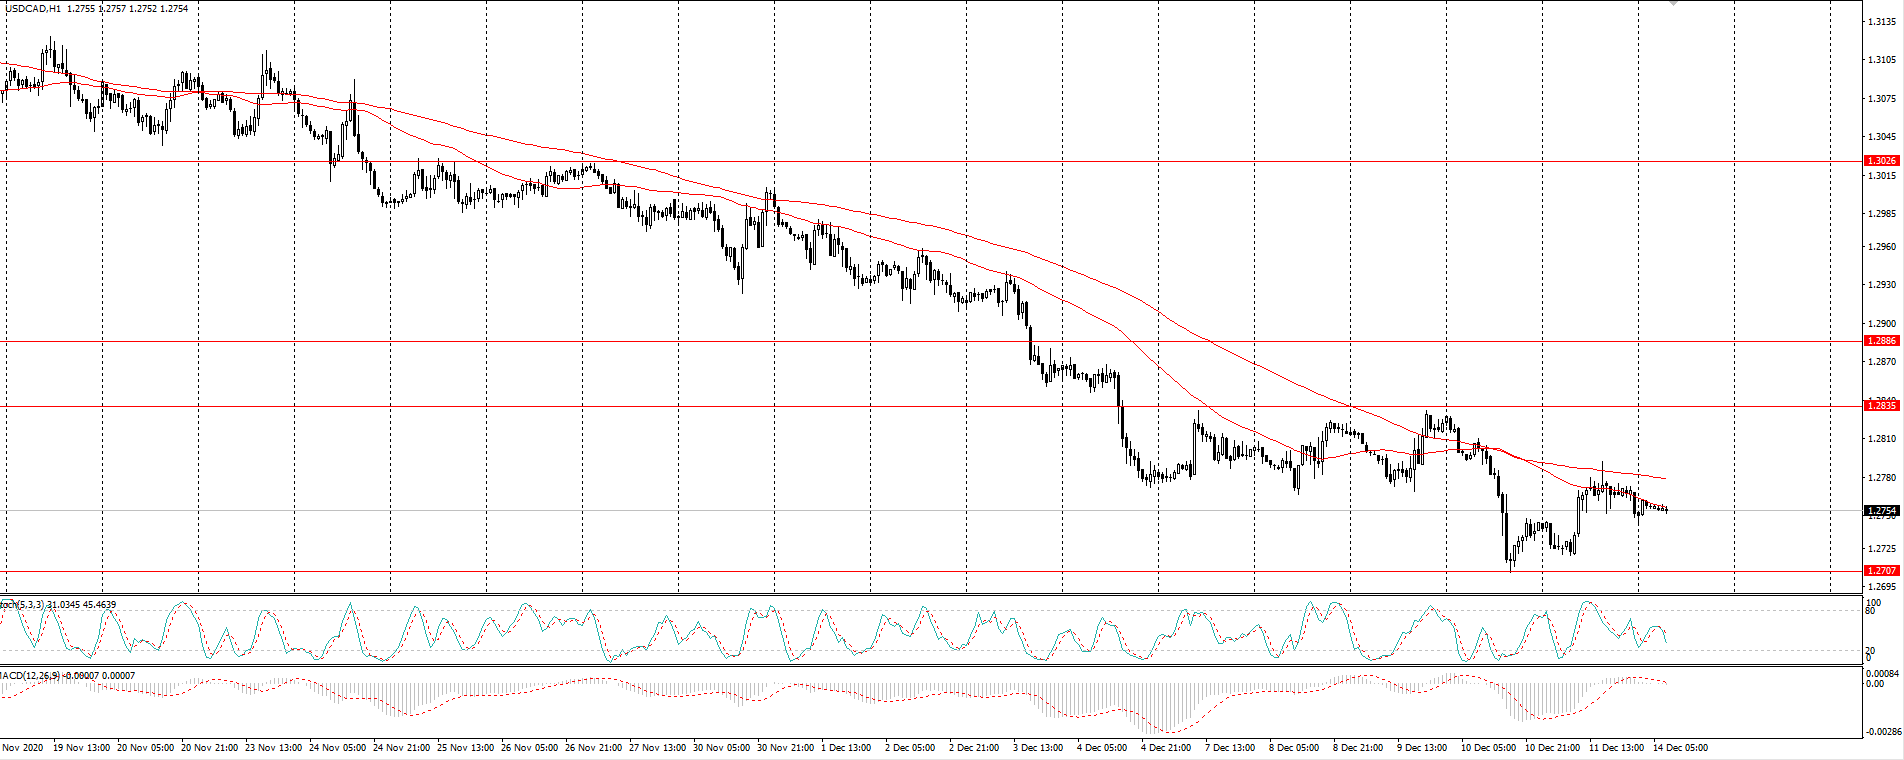
The USD/CAD currency pair
Technical indicators of the currency pair:
Prev Open: 1.2739
Prev Close: 1.2770
% chg. over the last day: +0.24%
Oil continues to support the quotes of the Canadian dollar. It seems that this commodity currency is not going to retreat, as “black gold” has fixed above the opening level of last week. Brent quotes have reached February values this year. In this context, buying remains dangerous and any northern pullback could be an opportunity for short positions.
Trading recommendations
Support levels: 1.2707, 1.2528
Resistance levels: 1.2835, 1.2886, 1.3026
Consider trading in a sideways range between 1.2780 and 1.2707. On Friday and today, the pair failed to fix above the SMA 50 and SMA 100 in the Asian session, which indicates a continuation of the bearish trend. Stochastic is behaving very calmly, hinting at trading in a very narrow range. The MACD is in the positive zone. The signals are multidirectional. It’s most likely that there will be the sideways range.
Alternative scenario: if the price manages to return above 1.2780, the southern trend will be broken in the short term and a buy signal will appear towards the level of 1.2886.