EUR/USD
Current level – 1.2033
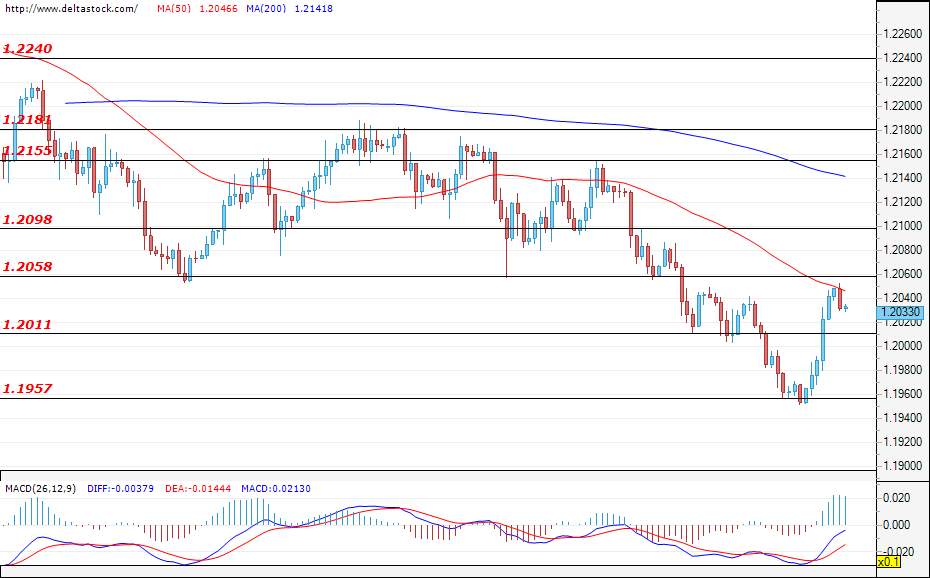
After the EUR/USD recovered some of its losses from the previous week,, the currency pair is hovering over the support zone at 1.2011 during the early hours of today’s trading. A test of the resistance zone at 1.2058 is likely, but only a breach of the next target at 1.2098 could strengthen the positive expectations for the future path of the EUR/USD. If the bears successfully violate the aforementioned zone at 1.2011, the pair will most probably head for another test of the important support at 1.1957. This week, the news traders will be keeping their eye on the most is the data for the U.S. unemployment claims (Thursday; 13:30 GMT), and the U.S. CPI data (Wednesday; 13:30 GMT).
| Resistance | Support | ||
| intraday | intraweek | intraday | intraweek |
| 1.2058 | 1.2155 | 1.2011 | 1.1880 |
| 1.2100 | 1.2181 | 1.1950 | 1.1700 |
USD/JPY
Current level – 105.48
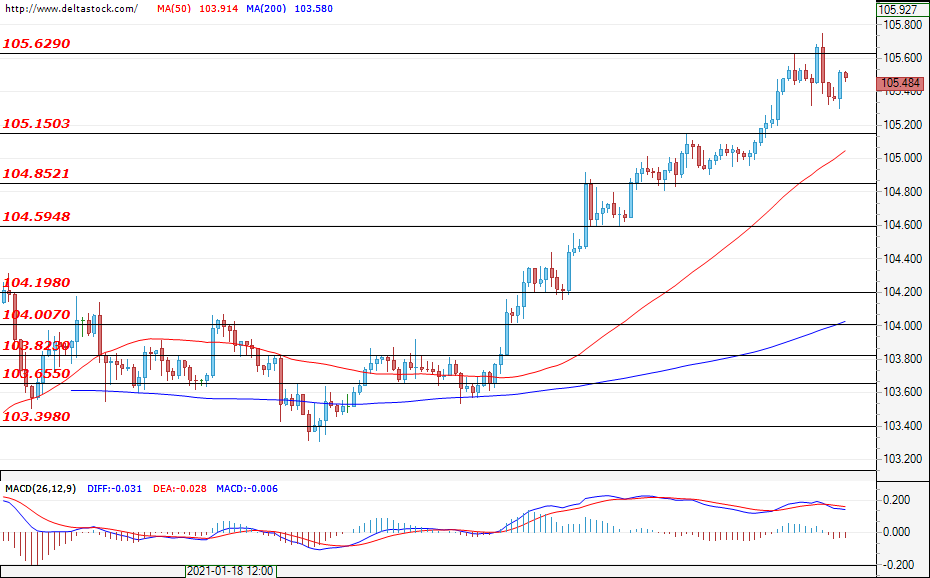
The currency pair failed to stay above the resistance zone at 105.63 and is currently consolidating below the mentioned level. Only a successful breach could lead to a continuation of the rally.. If the bears re-enter the market and gain enough momentum to breach the first support zone at 105.15, the most probable scenario would be a move towards 104.86.
| Resistance | Support | ||
| intraday | intraweek | intraday | intraweek |
| 105.62 | 106.70 | 105.15 | 104.19 |
| 106.10 | 107.40 | 104.80 | 104.00 |
GBP/USD
Current level – 1.3722
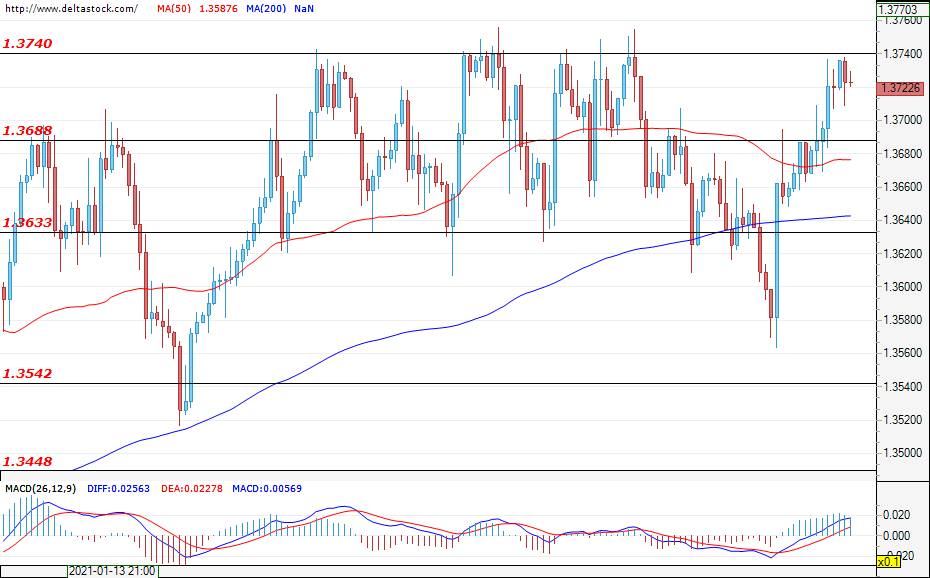
The breach of the resistance level at 1.3688 reinforced the positive sentiment and the GBP/USD gained some ground and tested the upper border of the range between 1.3633 and 1.3740. If the bullish pressure continues, another test of the resistance at 1.3740 can be expected and a successful breach would easily lead to а rally for the Cable, targeting the levels of around 1.3850.The first hurdle for the bears can be found at 1.3688, with the next support being the key zone at 1.3633. Volatility could rise when the data for the UK GDPand manufacturing production (Friday; 07:00 GMT) is announced.
| Resistance | Support | ||
| intraday | intraweek | intraday | intraweek |
| 1.3740 | 1.3850 | 1.3688 | 1.3542 |
| 1.3850 | 1.3870 | 1.3633 | 1.3448 |