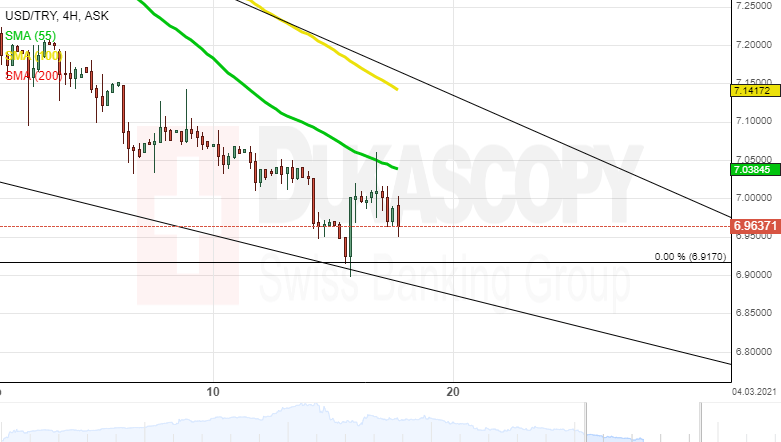
Since the middle of November, the USD/TRY currency pair has been trading downwards within a falling wedge pattern.
From a theoretical point of view, it is likely that the exchange rate could breach the predetermined pattern north within the following trading sessions. Note that the rate could face the resistance area formed by Fibos 38.20%, 50.00% and 61.80% in the 7.5494/7.9401 range.
Meanwhile, note that the currency pair is pressured by the 55-, 100–” and 200-period moving averages in the 7.0443/7.2820 area. Thus, some downside potential could continue to prevail in the market.