On Monday, March 15th, EUR/USD is looking rather confusing: it seems like there are no compelling reasons for the USD to get stronger but the Euro remains under pressure. The pair is mostly trading at 1.1931.
The fact that the $1.9 trillion stimulus package to help the American economy was completely approved made investors quite happy – no one expected the plan to fail but the final approval was still extremely positive. The money flow intended to support businesses and the social sphere will boost the country’s economic recovery and in the long-term, it’s very good for the “greenback”.
At the same time, social restrictions that remain in effect in European countries put pressure on the European currency. It’s not quite clear yet when such countries as Germany and France will cancel their lockdowns.
This week, there will be few statistical reports from Europe, so financial markets will have to rest upon the good stimulus-relating news from the USA.
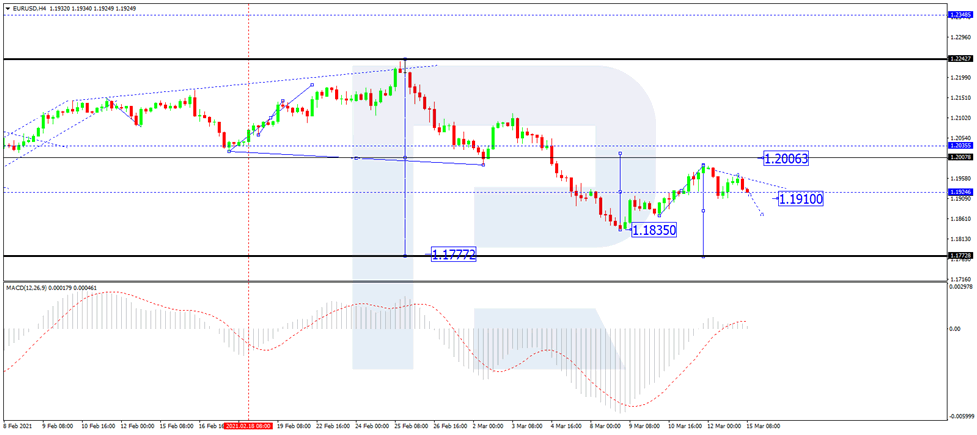
In the H4 chart, after reaching the downside target at 1.1835, EUR/USD is forming another rising wave with the target at 1.2020; it has already completed the correctional structure towards 1.1930 and may later continue growing to reach the above-mentioned target. However, if the price continues falling to break 1.1900 and forms a downside continuation pattern, the pair may form one more descending structure towards 1.1777 and then resume trading upwards to reach 1.2000. From the technical point of view, this scenario is confirmed by MACD Oscillator: its signal line has broken 0 to the upside, thus implying a further ascending movement on the price chart. The asset may start another decline on the price chart only if the signal line steadily breaks 0 to the downside.
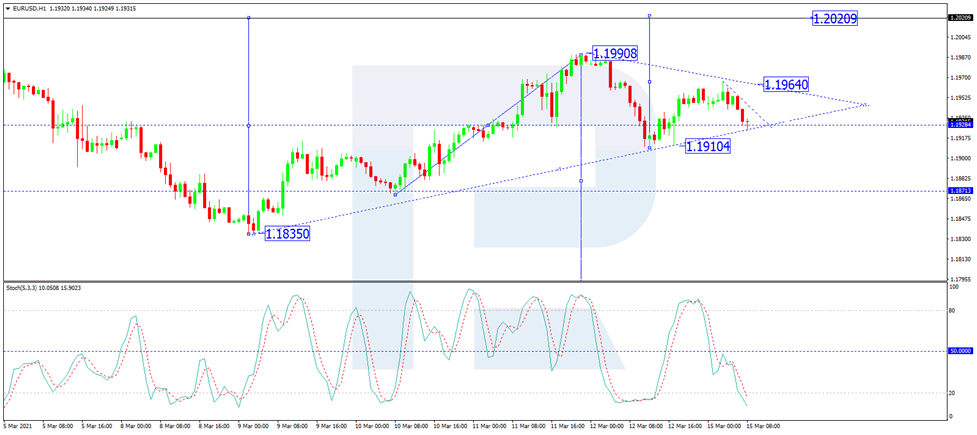
 As we can see in the H1 chart, after completing the correction at 1.1910 along with the ascending impulse to reach 1.1964, EUR/USD has finished another correction towards 1.1930. the key scenario implies a new rising wave towards 1.1960, a breakout of which may result in a further uptrend with the target at 1.2020. From the technical point of view, this scenario is confirmed by the Stochastic Oscillator: its signal line is moving below 20, thus implying that the market is trading within the “oversold area” and may start a new structure to the upside on the price chart. The indicator line is expected to grow and break 50, thus confirming a boost in the uptrend on the price chart.