
A note on lower timeframe confirming price action…
Waiting for lower timeframe confirmation is our main tool to confirm strength within higher timeframe zones, and has really been the key to our trading success. It takes a little time to understand the subtle nuances, however, as each trade is never the same, but once you master the rhythm so to speak, you will be saved from countless unnecessary losing trades. The following is a list of what we look for:
- A break/retest of supply or demand dependent on which way you’re trading.
- A trendline break/retest.
- Buying/selling tails … essentially we look for a cluster of very obvious spikes off of lower timeframe support and resistance levels within the higher timeframe zone.
- Candlestick patterns. We tend to only stick with pin bars and engulfing bars as these have proven to be the most effective.
We typically search for lower-timeframe confirmation between the M15 and H1 timeframes, since most of our higher-timeframe areas begin with the H4. Stops are usually placed 1-3 pips beyond confirming structures.
EUR/USD
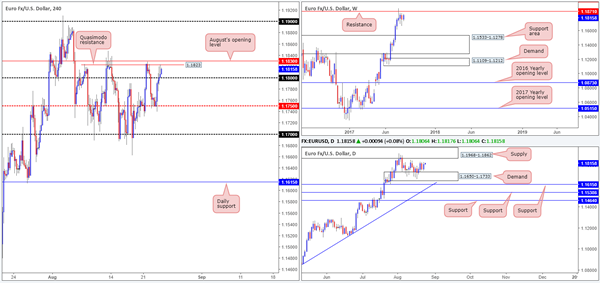
EUR buyers managed to find their feet early on in the day on Wednesday, bolstered by the H4 mid-level support at 1.1750. As a result of this, H4 price broke and eventually closed above the 1.18 handle. As you can see though, the unit failed to generate much follow through after this, due to a nearby Quasimodo resistance level at 1.1823 (shadowed closely by August’s opening level at 1.1830). However, considering that the USDX shows room for the H4 candles to push down as far as the trendline support extended from the low 11853, we may see the two noted H4 resistances give way sometime today.
The story over on the weekly chart shows that the buyers and sellers remain battling for position below a major resistance at 1.1871. A similar picture can be seen on the US dollar index (USDX), only inverse from a weekly support drawn in at 11854. Looking down to the daily timeframe, price is currently seen sandwiched between a supply zone coming in at 1.1968-1.1862 and a demand base lodged at 1.1650-1.1733.
Suggestions: A decisive close above 1.1830 on the H4 chart likely clears the footpath north up to the 1.19 band. While this may be true on the H4 timeframe, the bigger picture shows we have both the underside of the current daily supply at 1.1862 and the weekly resistance at 1.1871 to contend with before 1.19 can be achieved. This, for us, makes buying beyond 1.1830 just too much of a risk.
Data points to consider: US Jackson Hole symposium (all day), Unemployment claims at 1.30pm GMT+1.
Levels to watch/live orders:
- Buys: Flat (stop loss: N/A).
- Sells: Flat (stop loss: N/A).
GBP/USD
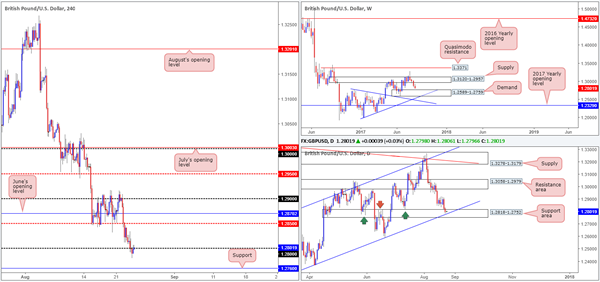
GBP/USD staged a modest selloff on Wednesday, forcing the H4 candles beyond the 1.28 handle. While there will be traders looking to sell this recent break, it might be worth noting what price actually broke into! Over on the daily timeframe, price entered into the walls of a support area drawn from 1.2818-1.2752, which intersects beautifully with a channel support line etched from the low 1.2365. Also notable is the nearby weekly demand seen at 1.2589-1.2759!
Suggestions: In view of the unit’s close proximity to the weekly demand, as well as price currently interacting with a daily support area, we’re reluctant to take on any medium/long-term shorts at this time. Ultimately, what we’re looking for is a decisive H4 close back above the 1.28 neighborhood. This, alongside a retest and a reasonably sized H4 bullish candle (preferably printed in the shape of a full, or near-full-bodied candle) would, in our opinion, be enough to validate a long trade. The first area of concern would be the H4 mid-level resistance at 1.2850, followed closely by June’s opening level at 1.2870.
Data points to consider: UK (second estimate) growth figures q/q at 9.30am. US Jackson Hole symposium (all day), Unemployment claims at 1.30pm GMT+1.
Levels to watch/live orders:
- Buys: Watch for H4 price to close above 1.28 and then look to trade any retest seen thereafter ([waiting for a reasonably sized H4 bullish candle to form following the retest is advised] stop loss: ideally beyond the candle’s tail).
- Sells: Flat (stop loss: N/A).
AUD/USD:
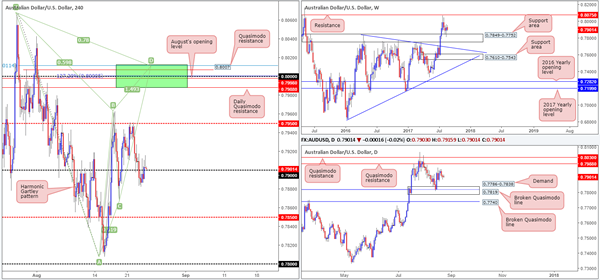
In recent trading, we saw the H4 candles inch back above the 0.79 handle after clocking a low of 0.7887. Should this number hold as support, the 0.7950 line is likely going to be the next target. Beyond this number, however, we have our eye on the 0.80 line. As highlighted in previous reports, apart from 0.80 being a watched round number, there are several nearby structures that deserve mention:
The daily Quasimodo resistance level at 0.7988.
A H4 Quasimodo resistance level at 0.8007.
A H4 127.2% Fib ext. point at 0.80 taken from the low 0.7807.
August’s opening level at 0.7998.
A H4 Harmonic Gartley reversal point at the 78.6% Fib resistance line drawn from 0.8011.
Suggestions: While the above structures on the H4 timeframe (green sell zone) boast attractive confluence, one must take into account that a fakeout may be seen up to the daily Quasimodo resistance level at 0.8030 sited just above the green zone. Traditionally, when trading Gartley patterns, the stop-loss order should go beyond the X point (0.8065). If you were to follow this, a fakeout up to the daily Quasimodo resistance is not a concern. It is more for the aggressive traders who will likely look to position stops just beyond the green zone. Should you be one of those traders, you may want to consider waiting for the H4 candles to prove seller intent (in the form of either a full, or near-full-bodied candle), before pressing the sell button. This will help avoid a fakeout should it occur.
At current price, nevertheless, we see little opportunity to trade. A long from 0.79 is, of course, an option, but given the recent H4 bearish selling wick printed just above this level, we’re reluctant to pull the trigger. Unless 0.80 comes into view today, we will likely remain on the sidelines.
Data points to consider: US Jackson Hole symposium (all day), Unemployment claims at 1.30pm GMT+1.
Levels to watch/live orders:
- Buys: Flat (stop loss: N/A).
- Sells: 0.8011/0.7988 (stop loss: either wait for a H4 bearish candle to form in the shape of a full, or near-full-bodied candle, and place stops above the candle’s wick. Another option is to enter at 0.80 and place stops above the H4 Harmonic X point at 0.8067).


