
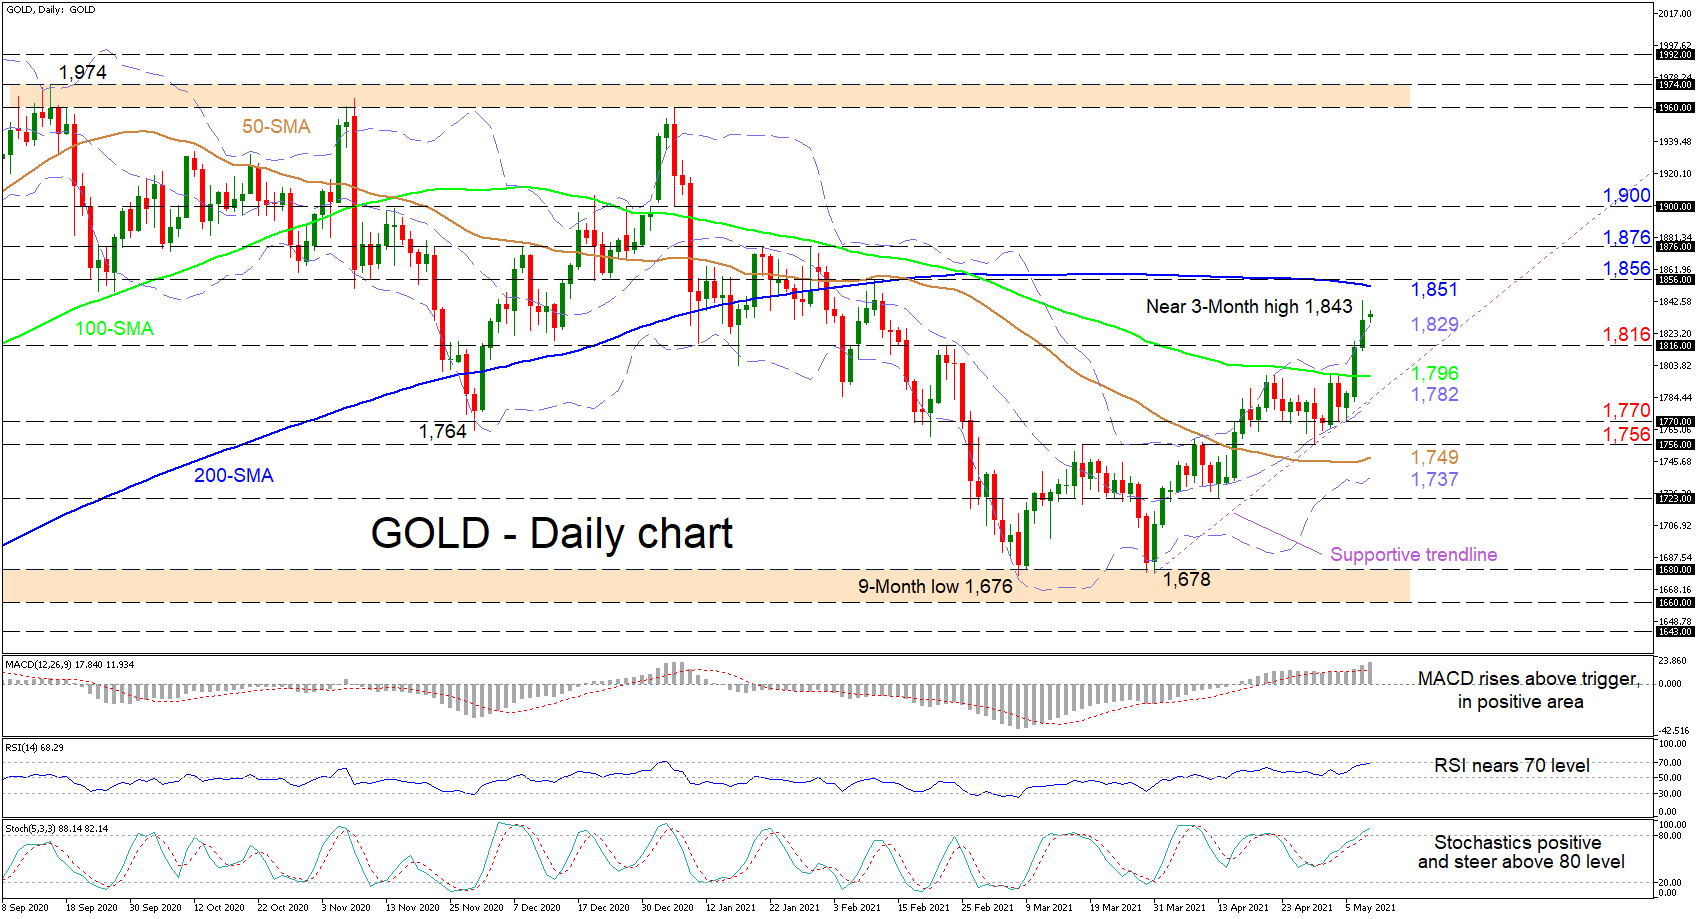
Gold is echoing its bullish intentions again after recently finding a toehold around the 1,756 level followed by extra traction off the mid-Bollinger band around 1,770. The flattening out of the 100-day simple moving average (SMA) and the slight upturn of the 50-day SMA are together suggesting downward sentiment is losing strength.
The short-term oscillators are indicating that positive momentum is gathering pace, endorsing price’s newfound upward drive. The MACD is strengthening above its red trigger line in the positive region, while the RSI is navigating towards the 70 level. The positively charged stochastic oscillator is piloting higher into overbought territory, promoting an improving price picture.
If the commodity remains fastened to the upper Bollinger band, the upwards trajectory may encounter preliminary resistance from the nearby 200-day SMA at 1,851 and the high overhead at 1,856. Successfully overstepping these key barriers may extend the commodity’s green glow, propelling the price towards the firm boundary identified at 1,876. Conquering this durable obstacle too could then inspire buyers to recapture the 1,900 hurdle.
If sellers resurface, direct support could occur at the upper Bollinger band around 1,829 before they tackle the February 23 inside swing high at 1,816. Should this level fail to keep selling pressures at bay, the price may confront the 100-day SMA and supportive trend line in the vicinity of 1,796. Penetrating this diagonal support pulled from the 1,678 trough, the commodity may then meet the mid-Bollinger band around 1,782 before sinking towards the lows at 1,770 and 1,756 respectively.
Summarizing, gold is sustaining a neutral-to-bullish tone in the short-term timeframe. A break above the 1,856 barrier could cement extra gains, while a shift below 1,756 could strengthen negative tendencies.


