EUR/USD
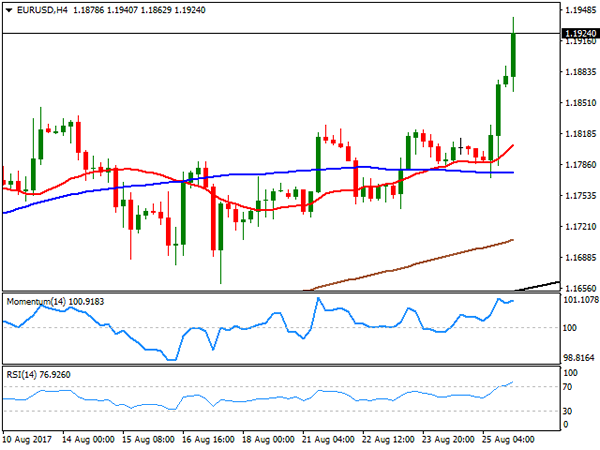
At the end of a dull trading week, the EUR/USD pair settle at 1.1924, its highest since January 2015, following speeches from Fed´s Yellen and ECB’s Draghi, within the Jackson Hole annual Symposium. The American dollar sold off after US Federal Reserve Head focused her speech in defending the post-crisis financial regulation, confronting Trump’s view on the matter, whilst the EUR rallied further when Draghi favored free trade, indicating that multilateral cooperation is crucial in responding to concerns about fairness, and that a turn towards protectionism would pose a serious risk for continued productivity growth and potential growth in the global economy. None of them talked monetary policy, yet the rally came anyway, as Yellen was anticipated to define next steps towards normalization, while Draghi started his speech saying that the global recovery is firming up.
The greenback fell across the board, and the negative momentum may extend early into the weekly opening, gapping lower particularly against safe-havens, given that over the weekend, North Korea fired multiple short-range projectiles into sea, usually a risk aversion trigger. The week with start with a holiday in the UK, which may result in limited volumes during European trading hours, exacerbating market’s movements.
Having traded as high as 1.1940, the pair broke higher after a consolidative phase, indicating that a continued advance is now likely, supported by technical readings, as in the daily chart, the pair finally detached from a horizontal 20 DMA, whilst technical indicators accelerated north above their mid-lines, maintaining a strong upward momentum heading into the weekly opening. Shorter term, and according to the 4 hours chart, the pair is also biased north, with technical indicators heading higher within overbought territory and the price well above its moving averages. A break above the mentioned high could see the pair extending its gains up to 1.2030 short term, with steady gains beyond this last favoring a continued advance towards the 1.2300 region, during the upcoming days, a major long term resistance.
Support levels: 1.1910 1.1860 1.1820
Resistance levels: 1.1940 1.1985 1.2030
USD/JPY
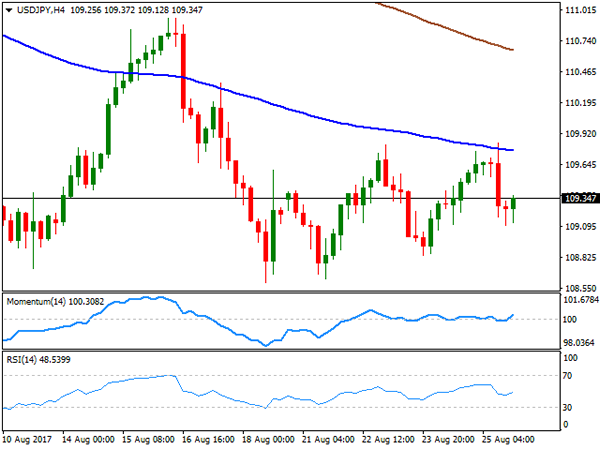
The USD/JPY pair ended the week unchanged at 109.34, a sign of receding JPY demand, despite persistent dollar’s weakness, this last fueled on Friday by poor US data and Yellen’s speech later on the day. Political uncertainty in the US has also been in the spotlight this past week, resulting in US-Treasury yields ending the week at their lowest in 2-month, with the 10-year note benchmark settling at 2.17% and the 30-year note interest at 2.75%. News over the weekend that North Korea has continued performing military test, this time firing short-range projectiles, may result in the Japanese currency appreciating at the beginning of the week. Over the weekend, BOJ’s Kuroda said that the latest pace of growth in Japan is probably unsustainable, indicating also that they plan to maintain the accommodative monetary policy “for some time.” The USD/JPY pair trades in a well-defined range near its August low of 108.59, and the daily chart shows that the price is well below its 100 and 200 DMAs, both gaining downward strength far above the current level, whilst technical indicators remain within negative territory, lacking directional strength, presenting a neutral-to-bearish stance. The 4 hours chart shows that the price retreated from a bearish 100 SMA on Friday, now acting as dynamic resistance around 109.75, while technical indicators aim modestly higher within neutral territory, not enough to confirm an upward extension ahead.
Support levels: 109.00 108.60 108.15
Resistance levels: 109.75 110.10 110.45
GBP/USD
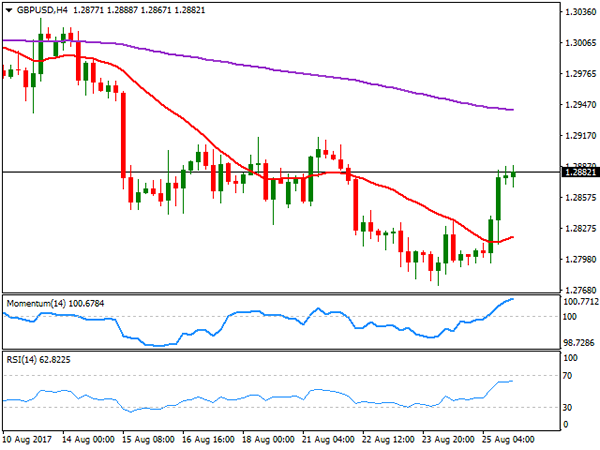
The British Pound closed the week with a strong note against the greenback at 1.2882, getting a boost early US session by soft US Durable Goods Orders data released early Friday, further fueled by Yellen’s comments at Jackson Hole, seen as dollar-negative as she avoided discussing monetary policy, while challenged Trump and his economic chief Gary Cohn, who are planning to take down the Dodd Frank regulations put in place after the latest US financial crisis. Cohn sounds loud as the one to replace Yellen when her term ends this year. The strong Friday’s advance in the GBP/USD pair was just enough to revert early weekly losses, with the pair ending it pretty much flat, as investors are cautious ahead of the next round of Brexit negotiations starting this week. The UK prepared some papers to clarify his stance over different matters, which were saw as an encouraging sign by markets, but on Friday, UK’s foreign minister Boris Johnson said that Britain will pay “not a penny more, not a penny less” than what the government thinks its legal obligations are to the EU, denting demand for Pound. Technically, the latest advance seems just corrective, as in the daily chart, the pair remains well below a strongly bearish 20 DMA, whilst technical indicators have recovered within bearish territory, with limited upward potential at the time being. Additionally, the pair stalled below the 1.2920/30 region, where selling interest has contained advances for over a week. In the 4 hours chart, the pair settled above a modestly bullish 20 SMA, while technical indicators entered bullish territory, but lost upward strength as the price was unable to surpass the mentioned critical resistance.
Support levels: 1.2850 1.2810 1.2770
Resistance levels: 1.2930 1.2965 1.3000
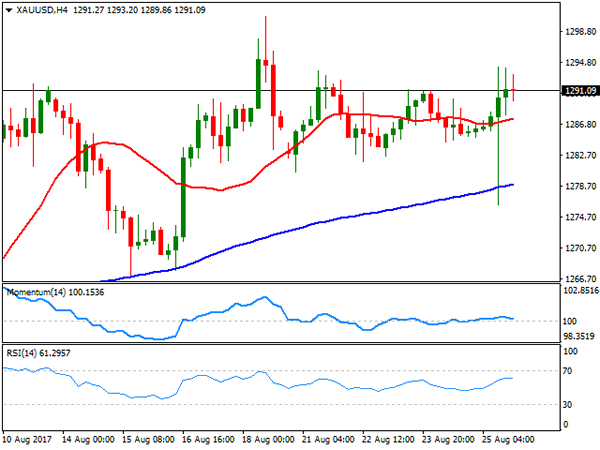
GOLD
Gold prices saw some wild price action ahead of Yellen’s speech last Friday, falling down to $1,276.32 a troy ounce ahead of the event, as investors were waiting for a more hawkish stance from the US Federal Reserve’s head, changing course afterwards to end the week marginally higher at $,1291.09 a troy ounce. Nevertheless, the commodity was unable to regain the 1,300.00 critical threshold, as despite seen as dovish, Yellen didn’t provide hints on upcoming monetary policy. From a technical point of view, the daily chart shows that the bright metal met buying interest around its 20 DMA that maintains its bullish slope far above the 100 and 200 DMAs. In the same chart, the Momentum indicator heads lower within positive territory, while the RSI hovers around 60, with no certain directional strength, all of which indicates that the risk is towards the upside, but further gains would need additional technical confirmations. In the 4 hours chart, the technical picture is neutral-to-bullish, as the price settled above all of its moving averages, but with the 20 SMA horizontal amid the lack of directional strength seen over this past week, while technical indicators head nowhere, the Momentum around its 100 level and the RSI around 61.
Support levels: 1,288.10 1,280.55 1,273.95
Resistance levels: 1,294.25 1,300.90 1,309.25
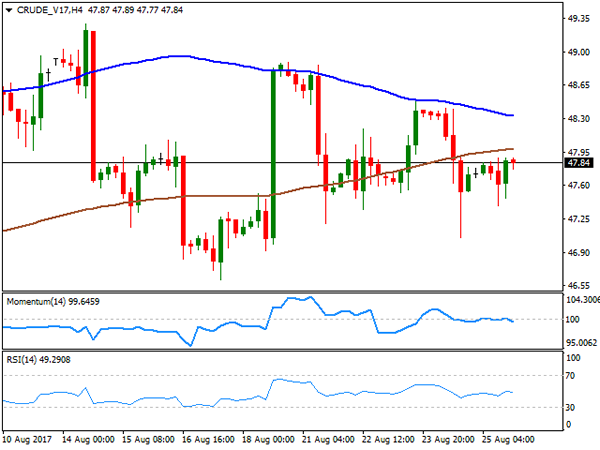
WTI CRUDE OIL
West Texas Intermediate crude oil futures closed modestly higher on Friday at $47.84 a barrel, down, however, for a fourth consecutive week. Friday’s advance came as a consequence of broad dollar’s weakness and a decline in the US rig count, as according to Baker Hughes, the number of rigs drilling for oil fell by 4 to 759. Also affecting oil prices is the hurricane Harvey hitting the Gulf Coast, which is home to nearly half of U.S. refining capacity. Speculative interest anticipates declining demand for crude at refineries for the upcoming days, which may end up sending prices lower. The commodity held within its early weekly range, still at risk of easing according to technical readings in the daily chart, as indicators remain within bearish territory, with the Momentum presenting a bearish slope but the RSI consolidating around 48. In the same chart, the 100 DMA has acted as dynamic support, attracting buying interest and currently at 47.30, a few cents above the weekly low of 47.05. In the 4 hours chart, the price settled below its moving averages, whilst technical indicators turned marginally lower within neutral territory, not enough to confirm a bearish extension, but leaning the scale towards the downside anyway.
Support levels: 47.05 46.60 46.00
Resistance levels: 47.90 48.50 49.10
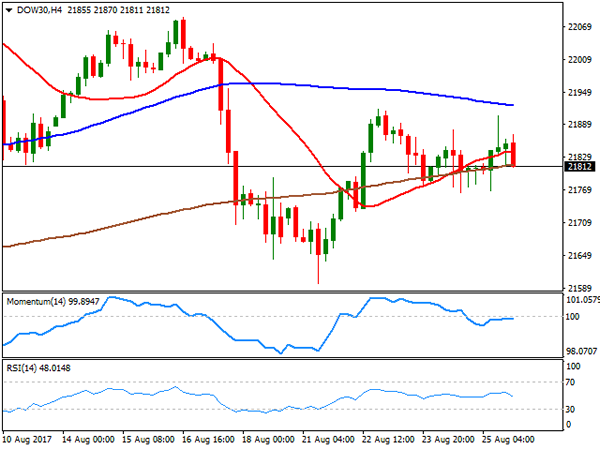
DJIA
US indexes closed mixed on Friday, with the DJIA up for the day 30 points, to end at 21,813.67, also up for the week. The S&P added 4 points and closed at 2,443.05, but the Nasdaq Composite shed 0.09%, ending the week at 6,265.64. Investors will focus on the long-promised US tax reform this week, as Trump’s chief economic advisor, Gary Cohn, said that the US president will begin calling for it next Wednesday in Missouri. If the tax reform ends at good port, stocks will likely rally to fresh record highs. Most Dow members closed up on Friday, with Home Depot leading gainers with a 0.94% gain, followed by Walt Disney that added 0.88%. Boeing was the worst performer, down 1.19%, with Goldman Sachs ending also in the red, down 0.23%. In the meantime, the upward potential remains limited for the index as the intraday advance was again contained by selling interest around a marginally bearish 20 DMA, whilst in the daily chart, technical indicators consolidate below their mid-lines. Shorter term, and according to the 4 hours chart, the index presents a neutral-to-bearish stance, with the benchmark stuck around its 200 SMA but below the 20 and 100 SMAs, and with technical indicators also holding right below their mid-lines, but with limited directional strength.
Support levels: 21,764 21,725 21,672
Resistance levels: 21,836 21,862 21,900
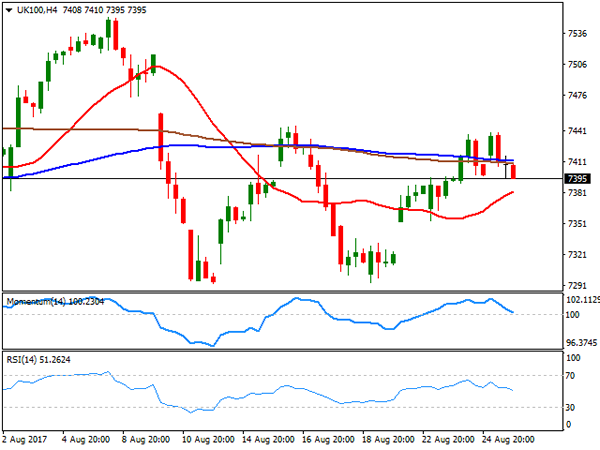
FTSE100
The FTSE 100 ended 5 points lower at 7,401.46 on Friday, weighed by a resurgent Pound following Yellen’s speech right ahead of the close. Equities traded choppily in Europe ahead of the key speeches from Fed and ECB’s heads, with most members closing down in London, albeit a sharp recovery in Provident Financial, offset most of the losses. The company added 22.46%, its third consecutive large advance after plummeting over 66% on Tuesday, after announcing changes in the management of its consumer credit division. Materials CRH led decliners, down 2.61%, followed by Paddy Power Betfair that lost 2.02%. Technically, the daily chart shows that the index was unable to settle above its 20 and 100 SMAs, both converging horizontally within a tight range, while the RSI indicator consolidates within neutral territory, but the Momentum heads south below its mid-line, all of which favors a leg lower for this upcoming sessions. In the 4 hours chart, the index is above a bullish 20 SMA, while technical indicators have turned south, now pressuring their mid-lines, also favoring a downward extension to be confirmed on a bearish acceleration through 7,380, the immediate support.
Support levels: 7,380 7,353 7,309
Resistance levels: 7,412 7,444 7,482
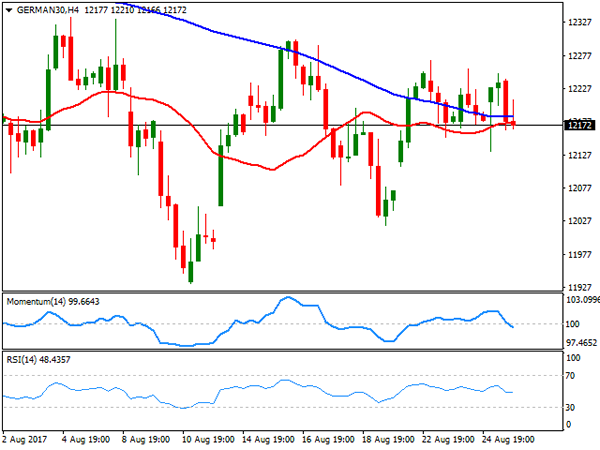
DAX
European indexes swung between small gains and losses Friday, as investors geared up for Draghi and Yellen’s speeches, ending up mostly with marginal losses. The German DAX closed at 12,167.90, down 12 points on the day, and barely up for the week. Financial-related equities were among the best performers through the region, with Deutsche Boerse leading gaining in Germany, up 1.16%, followed by Merck which added 1.10%. Deutsche Post, on the other hand, led decliners with a 1.21% loss, followed by Deutsche Telekom that shed 0.75%. The index may come under pressure early Europe, given EUR’s appreciation late Friday, amid market’s conviction that the ECB is getting ready to announce tapering. From a technical point of view, the daily chart shows that the index continues trading around a flat 20 DMA, but between the 100 and 200 DMAs, whilst technical indicators lack directional strength, holding right below their mid-lines, poising a limited downward risk. In the 4 hours chart, the index settled a few points below its 20 and 100 SMAs, while technical indicators barely entered negative territory with firm downward slopes, also favoring a downward extension for this Monday, particularly on a break below 12,132, Friday’s low and the immediate support.
Support levels: 12,132 12,099 12,065
Resistance levels: 12,222 12,263 12,301