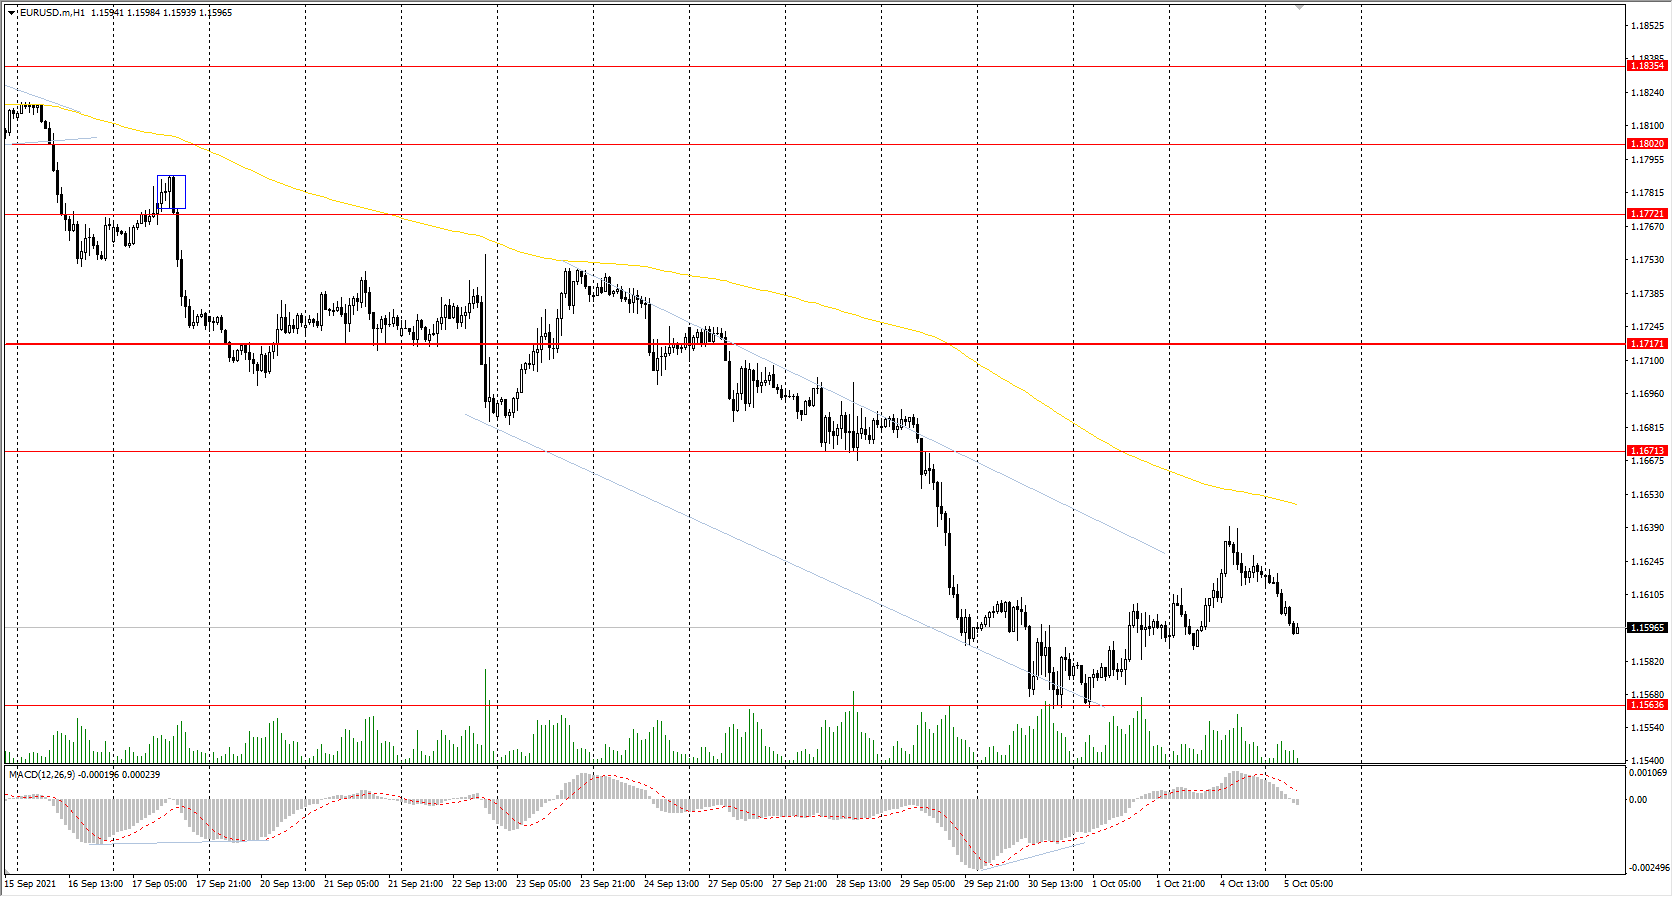
The EUR/USD currency pair
Technical indicators of the currency pair:
Prev Open: 1.1593
Prev Close: 1.1619
% chg. over the last day: +0.22%
ECB spokesman Paolo Gentiloni says that high inflation in EU countries is temporary, as supply chain problems and rising energy prices are pushing prices up. But the ECB expects EU countries to show a positive economic trend in the third quarter.
Trading recommendations
Support levels: 1.1564, 1.1453
Resistance levels: 1.1671, 1.1717, 1.1772, 1.1802, 1.1835
From the technical point of view, the EUR/USD trend is bearish. But the MACD indicator has become inactive. It indicates that the sellers have stopped putting pressure. Under such market conditions, traders should consider sell deals from the resistance levels near the moving average, as the price has deviated from the middle line. Buy trades should be considered only from the support levels with additional confirmation in the form of a buyers’ initiative.
Alternative scenario: if the price breaks out through the 1.1717 resistance level and fixes above, the mid-term uptrend will likely resume.
News feed for 2021.10.05:
- Eurozone Services PMI (m/m) at 11:00 (GMT+3);
- US ISM Services PMI (m/m) at 17:00 (GMT+3);
- Eurozone ECB President Lagarde’s Speech at 18:00 (GMT+3).
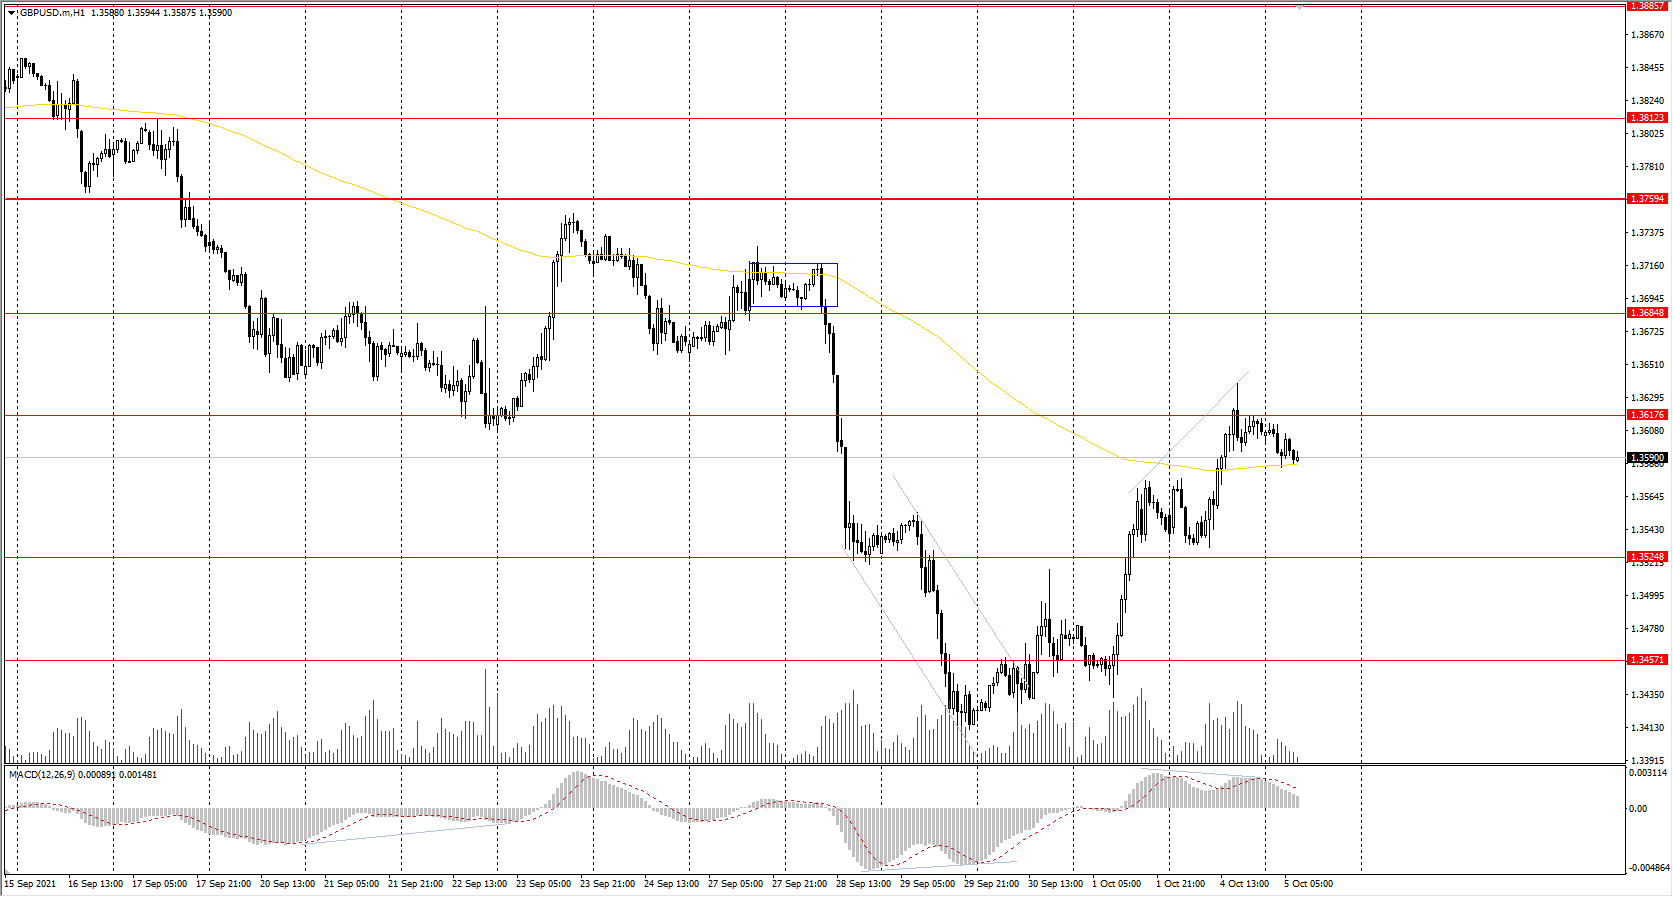
The GBP/USD currency pair
Technical indicators of the currency pair:
Prev Open: 1.3552
Prev Close: 1.3605
% chg. over the last day: +0.39%
The situation with the delivery of fuel to gas stations is improving, but the UK is still experiencing a serious shortage of truck drivers. New car registrations in the UK fell by 35% year-over-year last month. The automotive industry continues to suffer from a global shortage of semiconductors. But the British currency is strengthening due to rising oil prices, as the GBP directly correlates with BRENT oil prices.
Trading recommendations
Support levels: 1.3525, 1.3457, 1.3360, 1.3282
Resistance levels: 1.3617, 1.3685, 1.3759, 1.3812, 1.3886
On the hourly time frame, the GBP/USD trend is bearish. But the British currency keeps getting stronger due to oil prices growth. The MACD indicator has become positive, but there are already signs of divergence. Buy trades should be considered only throughout the day and only with short targets from the support levels after the buyer’s initiative. Sell trades can be found at the resistance levels near the moving average line.
Alternative scenario: if the price breaks out through the 1.3759 resistance level and consolidates above, the bullish scenario will likely resume.
News feed for 2021.10.05:
- UK Services PMI (m/m) at 11:30 (GMT+3).
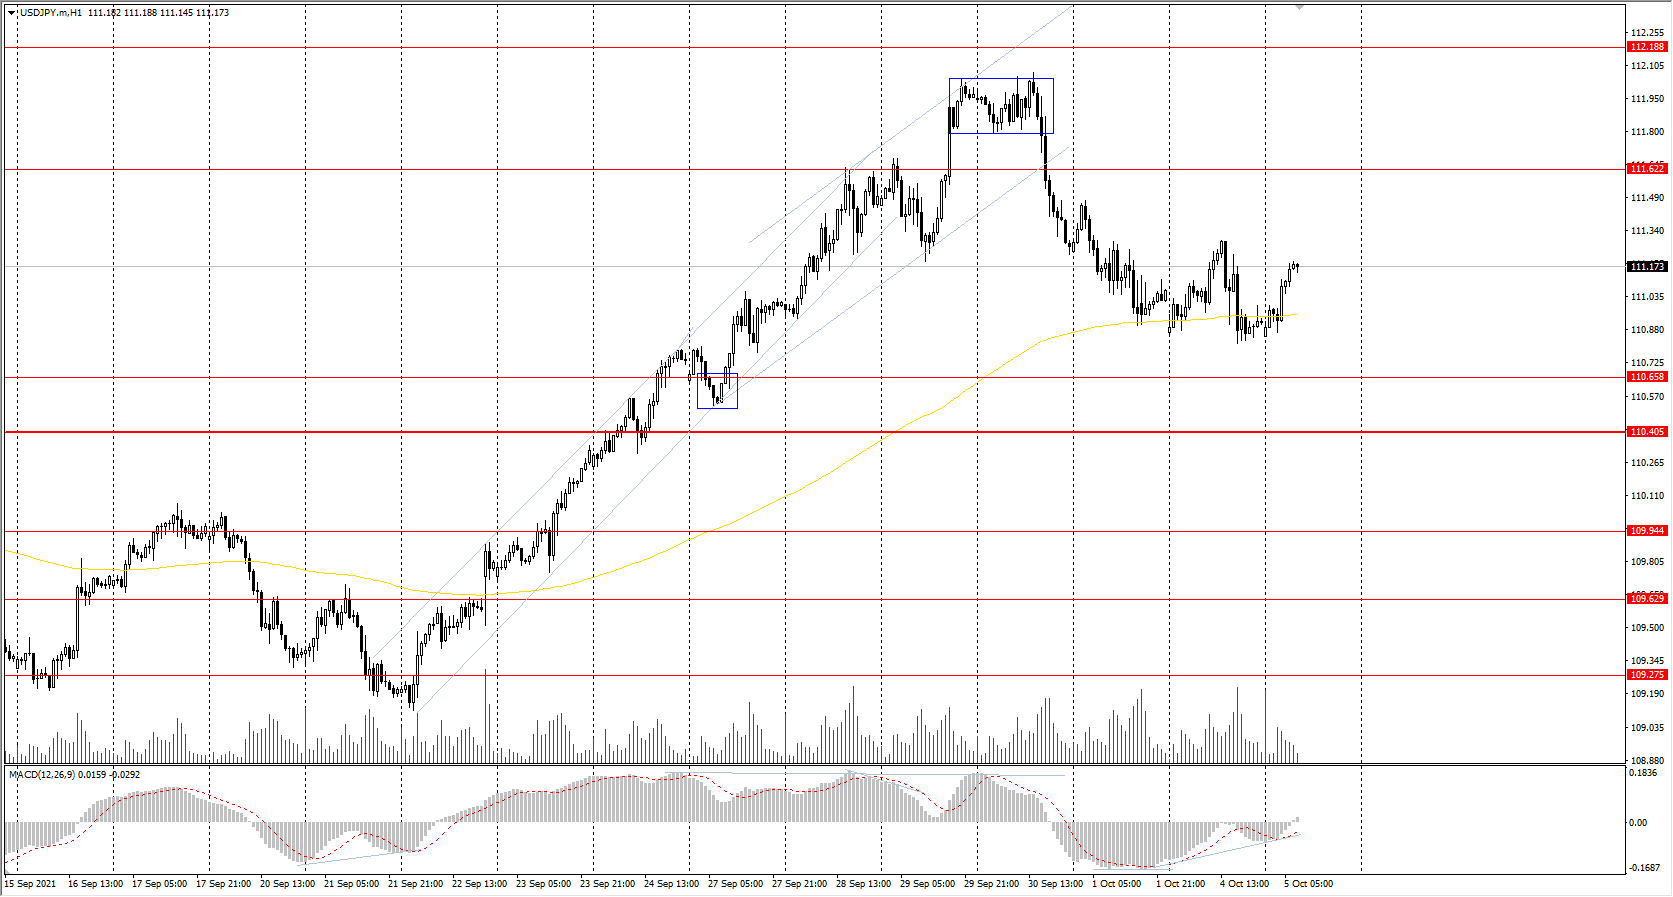
The USD/JPY currency pair
Technical indicators of the currency pair:
Prev Open: 110.86
Prev Close: 111.91
% chg. over the last day: +0.04%
Tokyo’s consumer price index is declining. It’s a sign of slowing inflation in Japan’s capital. The newly elected prime minister Fumio Kishida says he will dissolve the lower house of parliament next week in preparation for the October 31 elections as he seeks a new mandate to deal with the coronavirus pandemic, a decline in economics, and security threats from China and North Korea.
Trading recommendations
Support levels: 110.65, 110.40, 109.95, 109.63, 109.27
Resistance levels: 111.62, 112.19
The main trend of the USD/JPY currency pair is bullish. The MACD indicator became positive, and there are signs of buyer’s initiative. Under such market conditions, it’s better to look for buy positions from the support levels near the moving average. Sell positions should be considered only throughout the day from the resistance levels, given there is sellers’ initiative.
Alternative scenario: if the price falls below 110.45, the uptrend is likely to be broken.
News feed for 2021.10.05:
- Japan Tokyo Core Consumer Price Index at 02:30 (GMT+3).
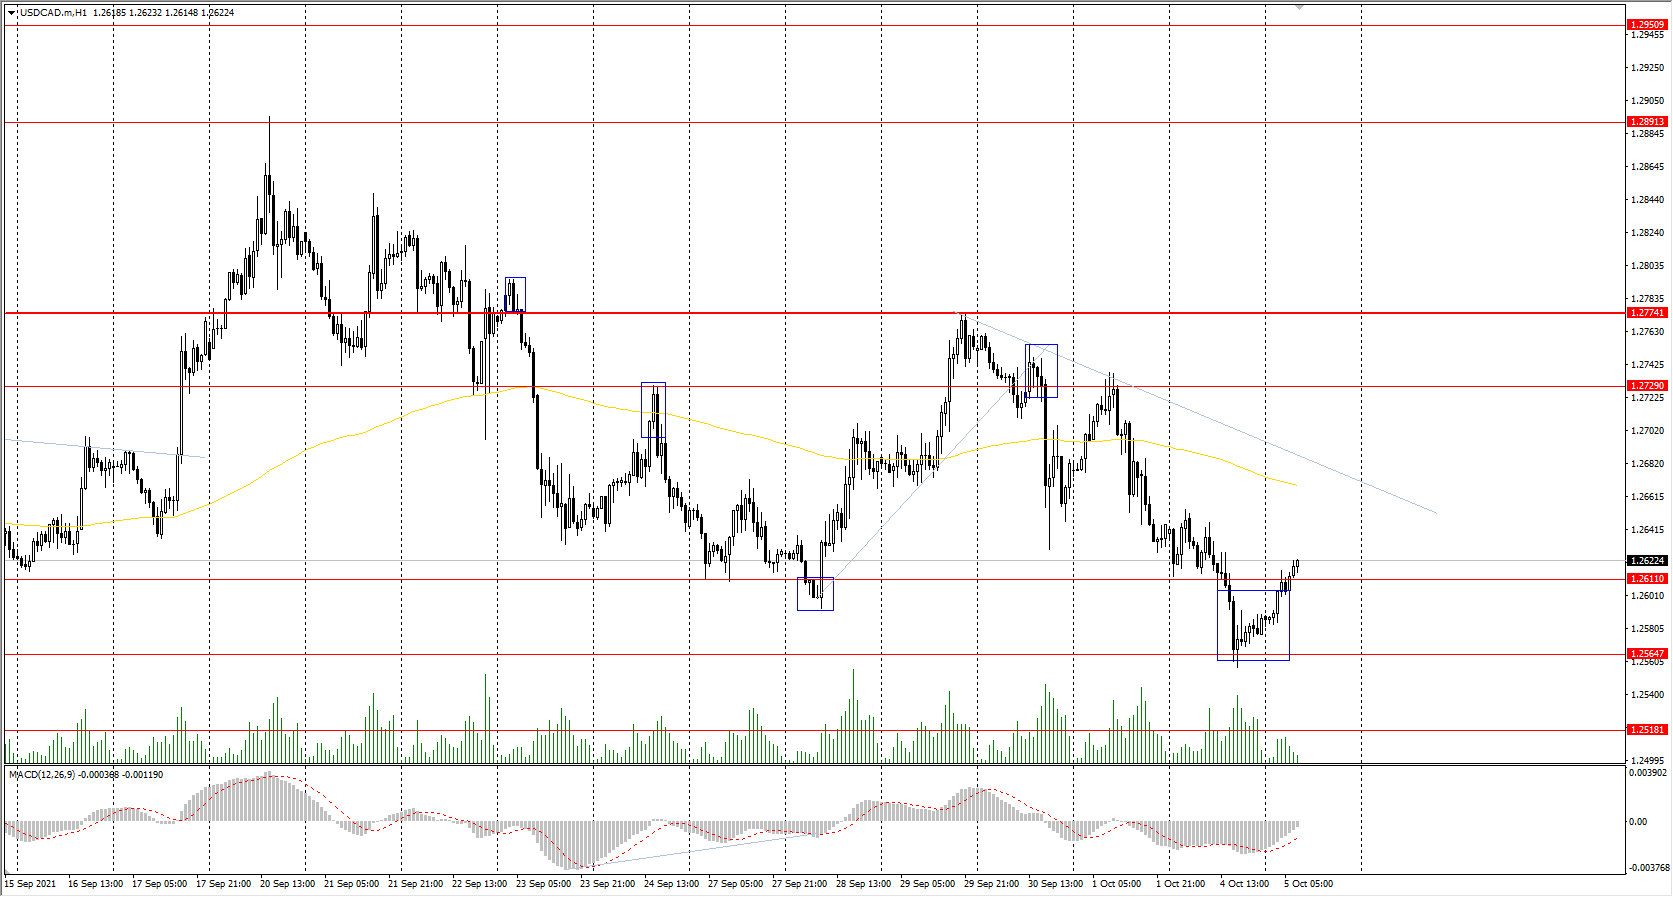
The USD/CAD currency pair
Technical indicators of the currency pair:
Prev Open: 1.2639
Prev Close: 1.2587
% chg. over the last day: -0.41%
The Canadian dollar is a commodity currency, so USD/CAD is highly dependent on the dynamics of the dollar index and oil prices. The dollar index slightly decreased yesterday while the oil prices jumped. As a result, the USD/CAD quotes sharply decreased due to the strengthening of the Canadian currency.
Trading recommendations
Support levels: 1.2611, 1.2565, 1.2518, 1.2425
Resistance levels: 1.2729, 1.2774, 1.2891
From the technical point of view, the trend of the USD/CAD currency pair is bearish. The MACD indicator has become inactive. Yesterday, the price broke down through the support level but came back above the level at the Asian session, forming a false breakdown zone below. Under such market conditions, it is better to look for sell deals from the resistance levels near the moving average. Buy deals should be considered from the false breakdown zone but with short targets.
Alternative scenario: if the price breaks out through the 1.2774 resistance level and fixes above, the uptrend will likely resume.