
A note on lower timeframe confirming price action…
Waiting for lower timeframe confirmation is our main tool to confirm strength within higher timeframe zones, and has really been the key to our trading success. It takes a little time to understand the subtle nuances, however, as each trade is never the same, but once you master the rhythm so to speak, you will be saved from countless unnecessary losing trades. The following is a list of what we look for:
- A break/retest of supply or demand dependent on which way you’re trading.
- A trendline break/retest.
- Buying/selling tails … essentially we look for a cluster of very obvious spikes off of lower timeframe support and resistance levels within the higher timeframe zone.
- Candlestick patterns. We tend to only stick with pin bars and engulfing bars as these have proven to be the most effective.
We typically search for lower-timeframe confirmation between the M15 and H1 timeframes, since most of our higher-timeframe areas begin with the H4. Stops are usually placed 1-3 pips beyond confirming structures.
EUR/USD
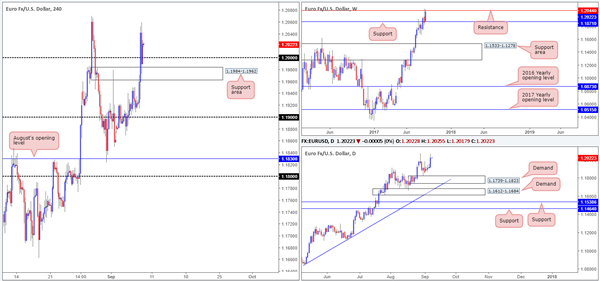
The shared currency aggressively advanced as Draghi took to the stage on Thursday. The move saw H4 price run through offers at 1.20 and shake hands with weekly resistance marked at 1.2044, mildly paring gains going into the close. As you can see, however, Thursday’s segment concluded trade above 1.20, giving the bulls a slight edge this morning.
Looking over to the USDX, a major weekly support at 11854 was breached on Thursday, potentially clearing the path south for weekly candles to connect with support at 11687. Despite this, we could see dollar recovery a tad before this level as there’s a daily channel support etched from the low 12351 that converges closely with H4 support at 11787.
Suggestions: Our immediate thinking here was to attempt to buy from 1.20, but with weekly resistance at 1.2044 looming over this level like a threatening rain cloud, we’re slightly hesitant. By the same token, a short sub 1.20 is just as challenging given the nearby H4 support area pegged at 1.1984-1.1962.
Therefore, considering the above, we’ll remain on the sidelines for now and await further developments.
Data points to consider: FOMC Harker speaks at 1.45pm GMT+1.
Levels to watch/live orders:
- Buys: Flat (stop loss: N/A).
- Sells: Flat (stop loss: N/A).
GBP/USD
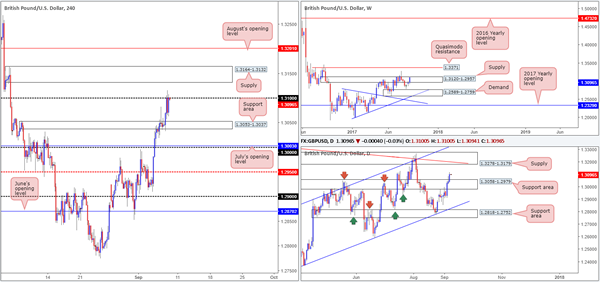
Trade update: stopped out at 1.3086 for a loss.
Despite solid gains recorded on the EUR and a considerable decline in the US dollar on Thursday, the British pound failed to sustain gains beyond the 1.31 handle. Continued rejection from 1.31 may see the H4 candles revisit the 1.3053-1.3037 area (a recently broken supply turned support area), whereas a move above 1.31 will almost immediately bring price into the arms of a supply area marked at 1.3164-1.3132.
The story over on the bigger picture shows daily action has recently engulfed the resistance area at 1.3058-1.2979 and now appears poised to challenge supply coming in at 1.3278-1.3179 (fuses with a trendline resistance taken from the high 1.3480). Be that as it may, let’s not forget that we still have weekly price trading within supply at 1.3120-1.2957 (albeit around the upper edge of this area).
Suggestions: Along similar lines to the EUR, we do not see any immediate trading opportunity at the moment. A buy above 1.31 would, as we highlighted above, place you in direct fire with H4 supply at 1.3164-1.3132 as well as weekly supply at 1.3120-1.2957. A sell from 1.31, although H4 structure shows a little more wiggle room down to the support area at 1.3053-1.3037, the trade would have you selling into potential daily (breakout) buyers.
Data points to consider: UK manufacturing production m/m at 9.30am. FOMC Harker speaks at 1.45pm GMT+1.
Levels to watch/live orders:
- Buys: Flat (stop loss: N/A).
- Sells: Flat (stop loss: N/A).
AUD/USD
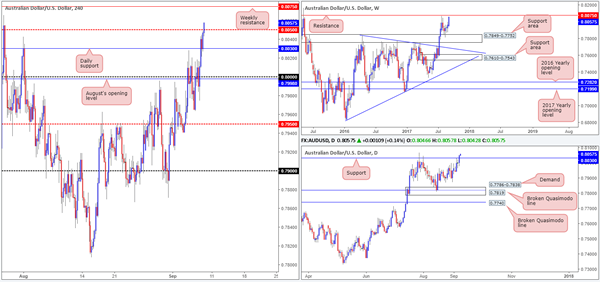
Kicking this morning’s analysis off with a look at the weekly timeframe, we can see that the pair’s recent advance has placed the unit within touching distance of resistance pegged at 0.8075. In conjunction with weekly flow, the daily candlesticks also recently crossed above a resistance level positioned at 0.8030, consequently opening up the path north to the noted weekly resistance barrier. Bouncing over to the H4 timeframe, price is, as we write, tackling the mid-level resistance at 0.8050. A decisive push above this number would, technically speaking, open the doors for the unit to greet the aforesaid weekly resistance level.
Suggestions: Put simply, the only place of interest, for us, is still the current weekly resistance level, which happens to stretch as far back as 1997! Whether or not this will turn to be a valid sell zone will depend entirely on how H4 price action responds. Preferably, we’d want a strong bearish candle form from here in the shape of a full, or near-full-bodied formation.
Data points to consider: RBA Assist Gov. Debelle speaks at 4am; RBA Gov. Lowe also takes the spotlight a few hours later at 9.30am. FOMC Harker speaks at 1.45pm GMT+1.
Levels to watch/live orders:
- Buys: Flat (stop loss: N/A).
- Sells: 0.8075 region ([waiting for a reasonably sized H4 bearish candle to form – preferably a full, or near-full-bodied candle – is advised] stop loss: ideally beyond the candle’s wick).
USD/JPY
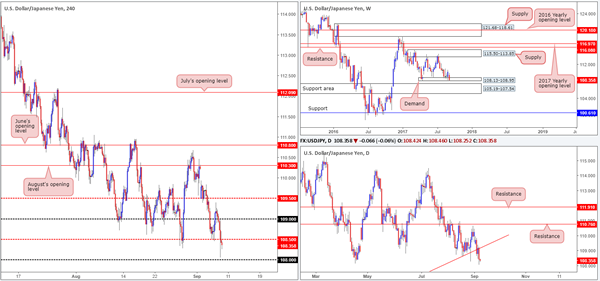
In recent trading, the USD/JPY failed to hold the 109 psychological support and ended the day sub 108.50. Providing that the bears defend 108.50, the next level of support can be seen at 1.08.
The recent move lower has also brought weekly price into the lower edge of demand at 108.13-108.95. With the weekly support seen on the USDX at 11854 recently engulfed, we may see this demand eventually taken out, which would lead to price almost immediately enter into the jaws of a large support area at 105.19-107.54. Looking down to the daily timeframe, a recent bounce off the underside of a broken trendline drawn from the low 100.83, has opened up the possibility of a move down to support at 106.81 (similar to the USDX daily timeframe – only the next downside target is a channel support etched from the low 12351).
Suggestions: With weekly price still trading within demand, entering short at 108.50 in an attempt to grab some of the potential downside advertised on the daily timeframe would be risky, in our opinion.
What about waiting for H4 price to close below 108 and look to trade any retest seen thereafter? This could be an option, but then you would have to contend with the top edge of the aforementioned weekly support area at 107.54!
No matter which way you look at shorts in this market, it has rather restricted structure. Therefore, our team’s position will remain flat going into today’s sessions.
Data points to consider: FOMC Harker speaks at 1.45pm. Japanese Final GDP q/q at 12.50am GMT+1.
Levels to watch/live orders:
- Buys: Flat (stop loss: N/A).
- Sells: Flat (stop loss: N/A).
USD/CAD
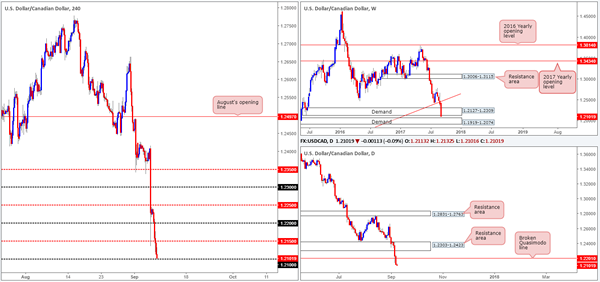
A heavily offered dollar saw the USD/CAD resume downside on Thursday, breaking the 1.22 handle and also the H4 mid-level support at 1.2150. With the 1.21 line next on tap, is there a chance that we’ll see the bulls make an appearance? Highly unlikely! We say this largely because weekly action recently crossed below demand at 1.2127-1.2309 and daily price also took out a Quasimodo support level at 1.2201.
The next downside target on the higher timeframes can be seen at a weekly demand area drawn from 1.1919-1.2074 (partner demand seen on the daily timeframe at 1.1919-1.2006). With that in mind, a short below 1.21, in our opinion, would be a challenge since price could essentially bounce from 1.2074 and rally higher.
Suggestions: With shorts not really a viable option at this time, and longs particularly dangerous from 1.21, we do not see any immediate opportunity to trade this pair. As such, remaining flat until more conducive price action presents itself is the route we have chosen to take.
Data points to consider: FOMC Harker speaks at 1.45pm. Canadian employment figures at 1.30pm GMT+1.
Levels to watch/live orders:
- Buys: Flat (stop loss: N/A).
- Sells: Flat (stop loss: N/A).
USD/CHF
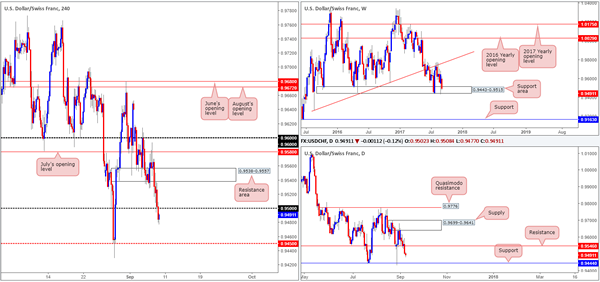
During the course of yesterday’s sessions, the piece retested the underside of a resistance area coming in at 0.9538-0.9557, following the ECB meeting (seen clearer on the M30 timeframe). The initial move from this zone saw the candles challenge the 0.95 base line, but failed to hold as support and therefore ended the day sub 0.95.
The break below 0.95 has likely attracted seller interest, as there’s very little structure seen to the left of price until the H4 mid-level support at 0.9450, followed closely by daily support at 0.9444. Despite this, up on the weekly chart, price is still lingering within a support area marked at 0.9443-0.9515.
Suggestions: With weekly support over on the USDX at 11854 recently taken out, the current weekly support area here may have trouble holding firm. That being the case, a retest of 0.95 that holds ground and is bolstered by a lower-timeframe confirming sell structure (see the top of this report) may be worth shorting if risk/reward is acceptable.
Data points to consider: FOMC Harker speaks at 1.45pm GMT+1.
Levels to watch/live orders:
- Buys: Flat (stop loss: N/A).
- Sells: 0.95 region (waiting for a lower-timeframe sell signal to form is advised] stop loss: dependent on where one confirms this level).
DOW 30:
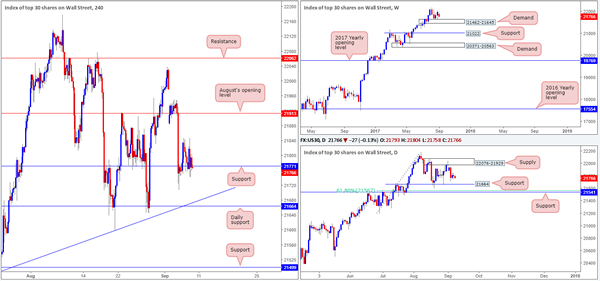
It was a relatively quiet day in the US equity market on Thursday as H4 price teased support at 21771. In view of the somewhat lackluster performance yesterday, much of the following report will echo a similar bias reported in our previous analysis…
With weekly buyers seen holding above demand at 21462-21645, the H4 support could maintain a presence in this market and eventually drag the index up to August’s opening level at 21913. This is, of course, if daily sellers don’t flood the market to connect with the daily support positioned a little lower on the curve at 21664.
Our suggestions: Given that the index is still entrenched within an incredibly strong uptrend, we would only consider a long position if price crosses swords with the daily support mentioned above at 21664. Not only because of it converging with a H4 trendline support taken from the low 21484, but also because this will bring daily bulls into the picture as well as (nearby) weekly and H4 bulls.
Data points to consider: FOMC Harker speaks at 1.45pm GMT+1.
Levels to watch/live orders:
- Buys: 21664 region ([waiting for a reasonably sized H4 bullish candle to form – preferably a full, or near-full-bodied candle – is advised] stop loss: ideally beyond the candle’s tail).
- Sells: Flat (stop loss: N/A).
GOLD
Trade update: small loss taken at 1341.2.
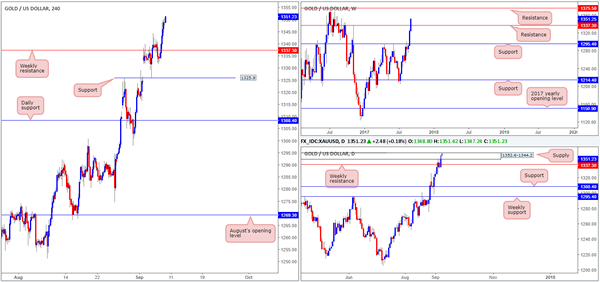
Across the board, the US dollar collapsed against the majority of its trading peers, consequently forcing the yellow metal into positive territory. This has, as you can see, firmly pushed price beyond the weekly resistance level at 1337.3, but at the same time, also into the jaws of a daily supply zone pegged at 1352.6-1344.2.
According to weekly structure, the next upside target can be seen around the 1375.5ish range (another resistance), so there’s a chance that daily price may engulf the current supply it is trapped within right now. Therefore, selling is not really something we’d label high probability at the moment – even more so considering that the USDX weekly support also gave way recently at 11854. Buying on the other hand, would be something of interest ABOVE the current daily supply zone, but this is not something we’d personally show interest in UNTIL we see a daily close print beyond the area.
Our suggestions: On account of the noted structure, our team does not see much to hang their hat on at the moment. Therefore, remaining on the sidelines is the path we’ve chosen to take.
Levels to watch/live orders:
- Buys: Flat (stop loss: N/A).
- Sells: Flat (stop loss: N/A).


