
Short Term Elliott Wave view on FTSE suggests the rally from September 20, 2021 low is unfolding as a 5 waves impulse. Up from September 20 low, wave 1 ended at 7159.61 and dips in wave 2 ended at 6945.50. The Index then rallies higher in wave 3 towards 7281.176, and pullback in wave 4 ended at 7192.05. Internal subdivision of wave 4 unfolded as a zigzag structure as 30 minutes chart below shows. Down from wave 3, wave ((a)) ended at 7219.71 and wave ((b)) ended at 7251.55. Wave ((c)) of 4 lower ended at 7192.05.
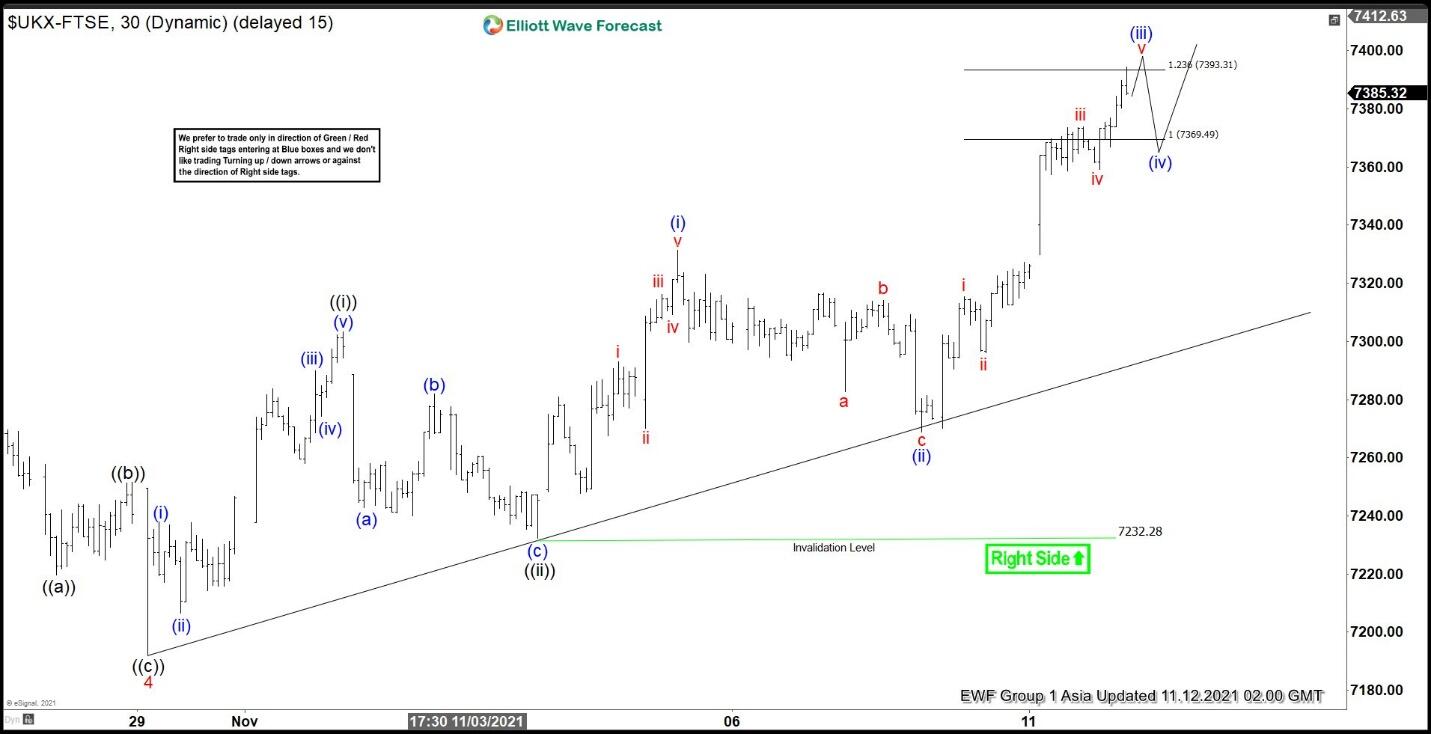
Wave 5 higher is currently in progress with internal subdivision as another impulse in lesser degree. Up from wave 4, wave ((i)) ended at 7303.39 and pullback in wave ((ii)) ended at 7232.28. Wave ((iii)) rally is in progress as another impulse in lesser degree. Up from wave ((ii)), wave (i) ended at 7331.25 and dips in wave (ii) ended at 7268.79. Near term, expect wave (iii) to end soon, then it should pullback in wave (iv) before the next leg higher in wave (v) of ((iii)). Near term, as far as pivot at 7232.28 low stays intact, expect dips to find support in 3, 7, or 11 swing for more upside.
FTSE 30 Minutes Elliott Wave ChartShort Term Elliott Wave view on FTSE suggests the rally from September 20, 2021 low is unfolding as a 5 waves impulse. Up from September 20 low, wave 1 ended at 7159.61 and dips in wave 2 ended at 6945.50. The Index then rallies higher in wave 3 towards 7281.176, and pullback in wave 4 ended at 7192.05. Internal subdivision of wave 4 unfolded as a zigzag structure as 30 minutes chart below shows. Down from wave 3, wave ((a)) ended at 7219.71 and wave ((b)) ended at 7251.55. Wave ((c)) of 4 lower ended at 7192.05.
Wave 5 higher is currently in progress with internal subdivision as another impulse in lesser degree. Up from wave 4, wave ((i)) ended at 7303.39 and pullback in wave ((ii)) ended at 7232.28. Wave ((iii)) rally is in progress as another impulse in lesser degree. Up from wave ((ii)), wave (i) ended at 7331.25 and dips in wave (ii) ended at 7268.79. Near term, expect wave (iii) to end soon, then it should pullback in wave (iv) before the next leg higher in wave (v) of ((iii)). Near term, as far as pivot at 7232.28 low stays intact, expect dips to find support in 3, 7, or 11 swing for more upside.
FTSE 30 Minutes Elliott Wave Chart


