
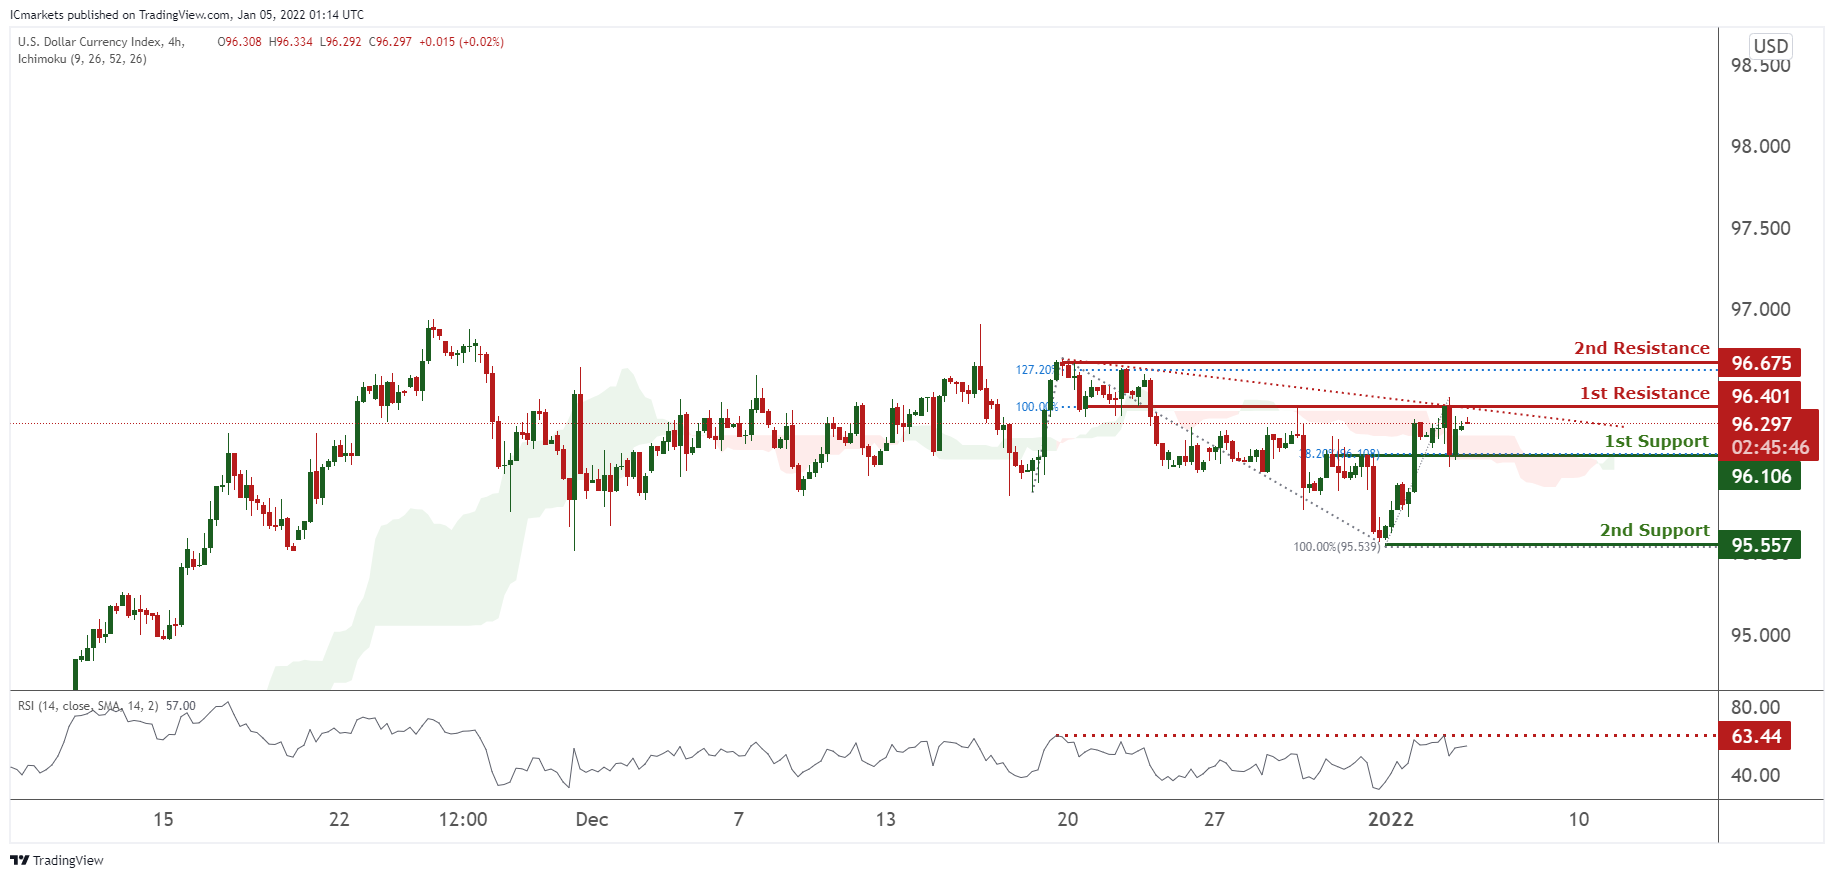
DXY:
On the H4, prices are on bearish momentum and abiding to our bearish trendline. We see the potential for a dip from our 1st resistance at 96.401 in line with 100% Fibonacci extension towards our 1st support in line 96.106 with 38.2% Fibonacci retracement. RSI are at levels where dips previously occurred,and prices are trying to pass through our ichimoku clouds, further supporting our bearish bias.
Areas of consideration:
- H4 time frame, 1st resistance at 96.401
- H4 time frame, 1st support at 96.106
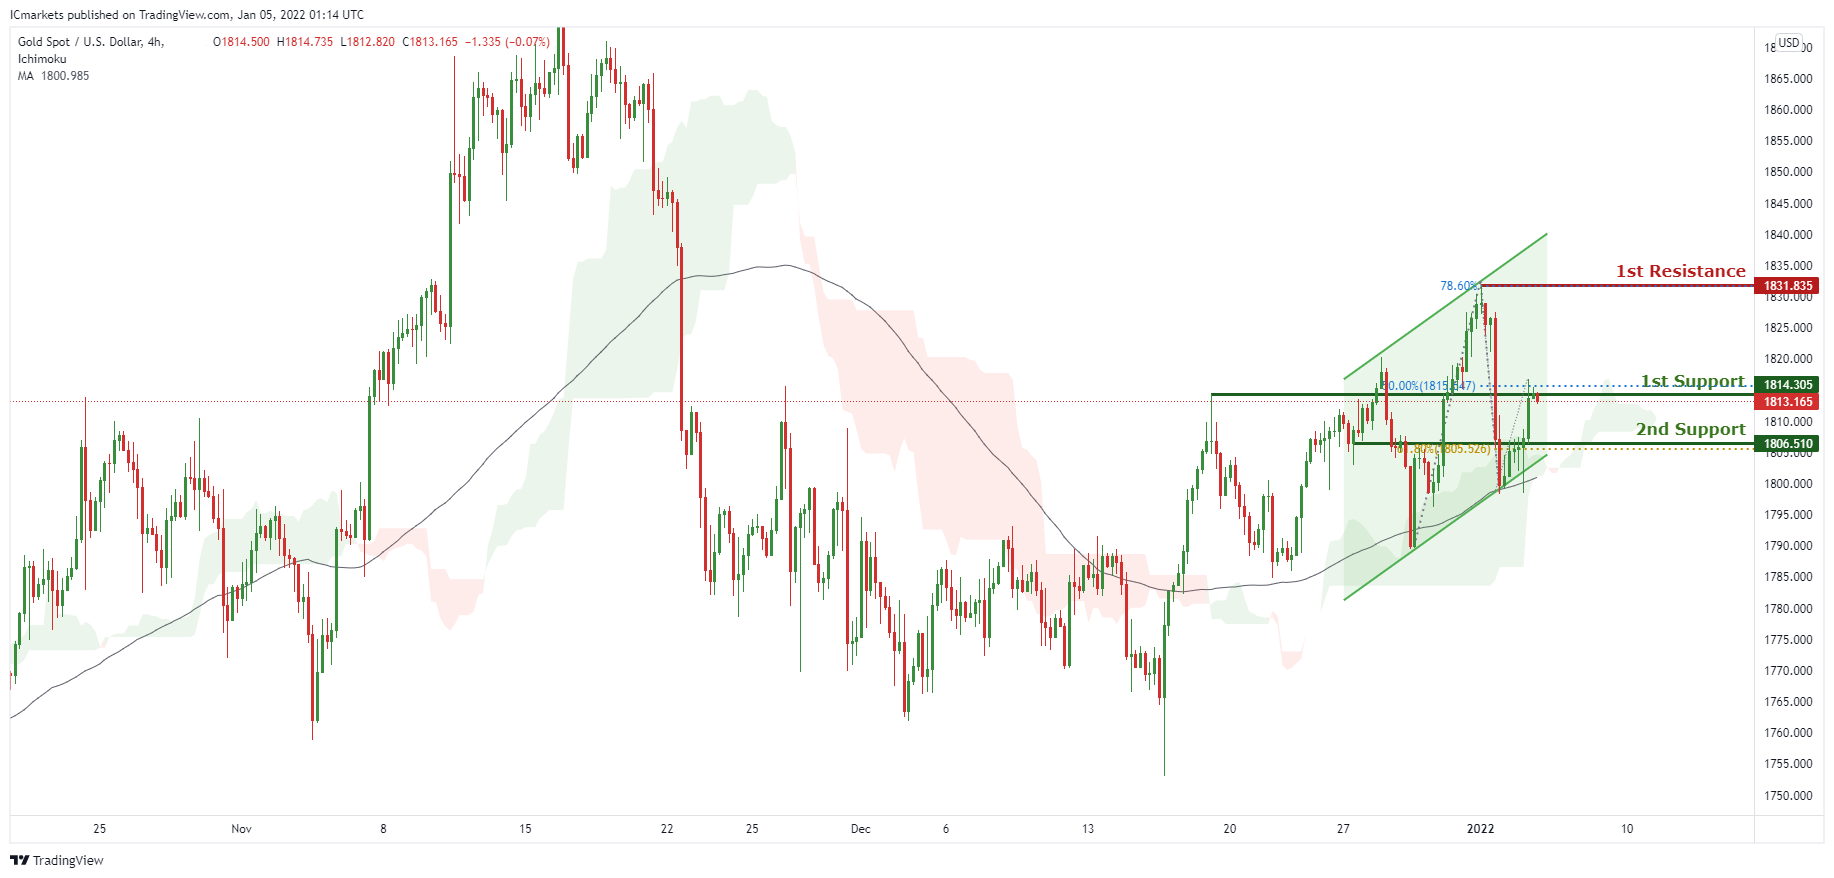
XAU/USD (GOLD):
On the H4, prices are consolidating in a parallel channel and on bullish momentum. We see the potential for further upside from our 1st support at 1814.305 in line with 50% Fibonacci retracement towards our 1st resistance at 1831.835 in line with 78.6% Fibonacci extension. Prices are trading our MA and also ichimoku clouds, further supporting our bullish bias. Alternatively, our stop loss will be placed at 2nd support at 1906.510 in line with 61.8% Fibonacci retracement.
Areas of consideration:
- H4 1st support at 1814.305
- H4 1st resistance at 1831.845
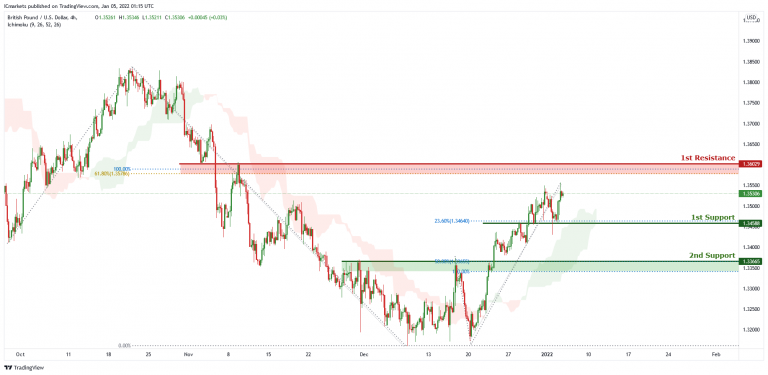
GBP/USD
On the H4 chart, price is currently heading towards the key resistance level of 1.36029 which is also 100% Fibonacci projection and 61.8% Fibonacci retracement. Alternatively price can dip to the 1st support level of 1.34588 which is also 23.6% Fibonacci retracement. Our bullish bias is supported by the ichimoku cloud indicator as price is trading above it.
Areas of consideration:
- H4 1st support at 1.34588
- H4 1st resistance at 1.36029
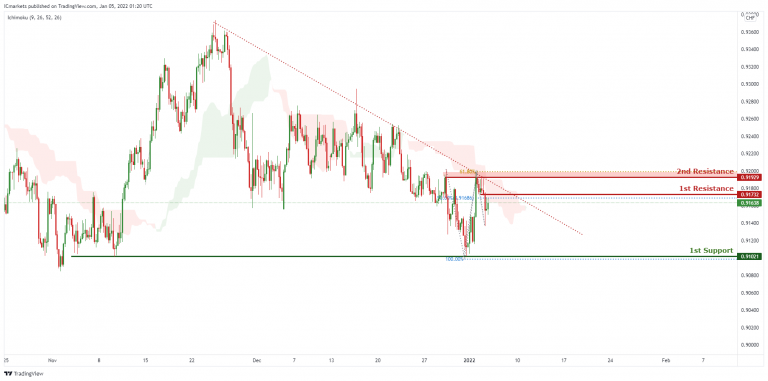
USD/CHF
In reference to yesterday’s analysis, price is moving nicely towards 1st Support.. On the H4 timeframe, price is abiding to the descending trendline resistance, signifying an overall bearish momentum. We can expect price to drop from the 1st Resistance level in line with 50% Fibonacci retracement towards 1st Support in line with 100% Fibonacci projection. Our bearish bias is further supported by the price holding below the Ichimoku Cloud.
Areas of consideration:
- Watch 1st Support at 0.91021
- Watch 1st Resistance at 0.91732
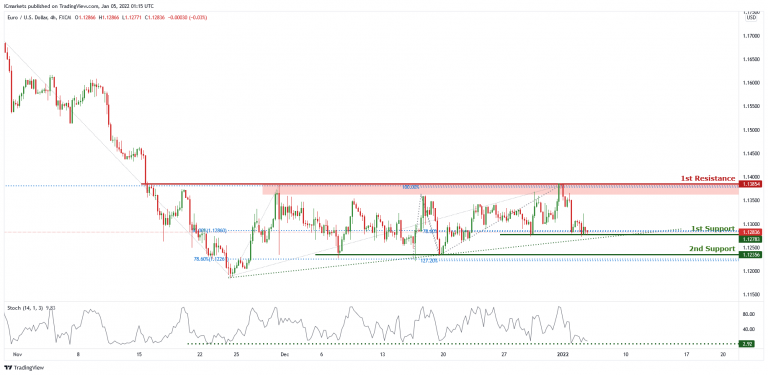
EUR/USD :
On the H4 chart, price is abiding by an ascending trendline and is near 1st support level of 1.12783 which is also 50% Fibonacci retracement and 78.6% Fibonacci projection. Price can potentially go to the 1st resistance of 1.13854 which is also 100% Fibonacci projection and 38.2% Fibonacci retracement. Our bullish bias is supported by the stochastic indicator as it is near support level.
Areas of consideration :
- H4 1st support at 1.12783
- H4 1st resistance at 1.13854
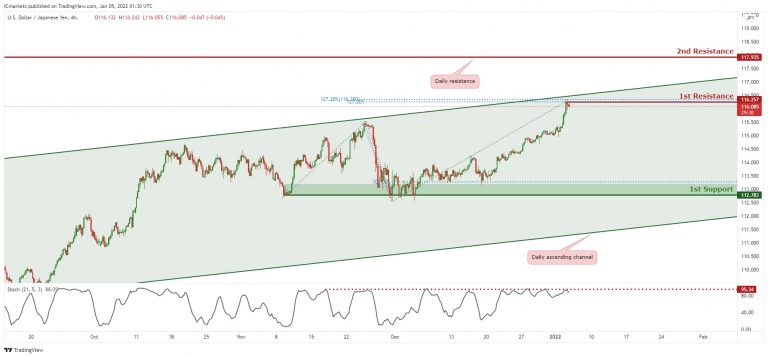
USD/JPY
On the H4 timeframe, price is abiding to the ascending channel, showing an overall bullish momentum. However, we can expect a short term bearish momentum and drop from 1st resistance in line with horizontal swing high, 127.2% Fibonacci projection and 127.2% Fibonacci retracement towards 1st Support in line with graphical overlap support and 100% Fibonacci projection. Our bearish bias is further supported by stochastic where the %K line dropped from the resistance.
Areas of consideration:
- H4 1st resistance level 116.257
- H4 1st support level 112.783
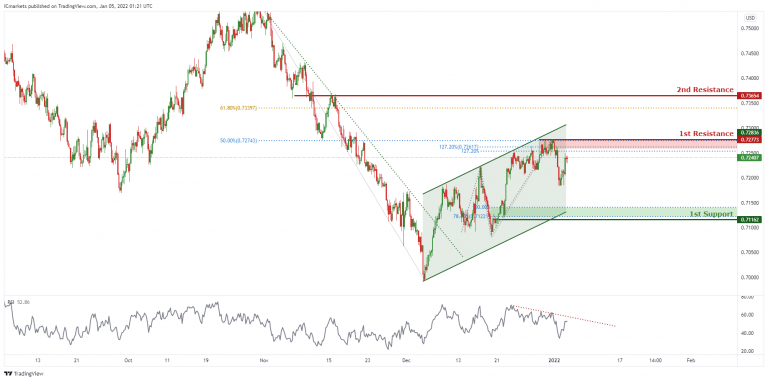
AUD/USD:
In reference to yesterday’s analysis, price is falling nicely towards 1st Support. On the H4, price is reacting in an ascending channel, signifying bullish momentum. However, price is currently at a resistance, we can expect price to drop from 1st Resistance in line with 127.2% Fibonacci projection ,127.2% Fibonacci Extension and 50% Fibonacci retracement towards 1st Support in line with 100% Fibonacci projection and 78.6% Fibonacci retracement. Our short-term bearish bias is further supported by the RSI indicator where it is abiding to the descending trendline resistance. Traders should wait for prices to swing higher or lower before entering.
Areas of consideration:
- H4 1st Support level 0.71203
- H4 1st resistance level 0.72773
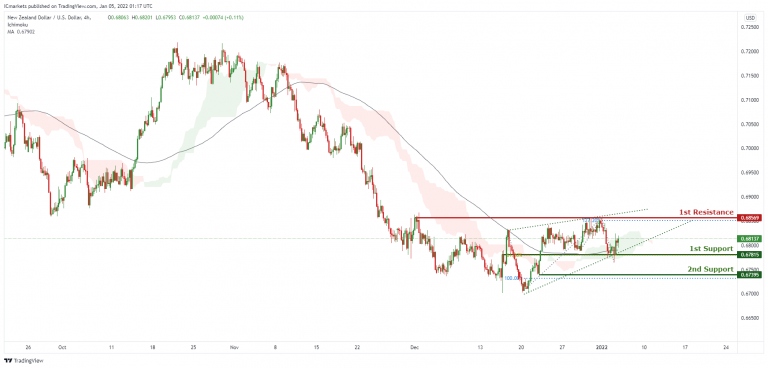
NZD/USD:
On the H4, prices are on bullish momentum and consolidating in a wedge pattern. We see the potential for further bullish movement from our 1st support at 0.67815 in line with 61.8% Fibonacci extension towards our 1st resistance at 0.68569 in line with 127.2% Fibonacci extension. Prices are trading above our MA and also ichimoku clouds further supporting our bullish bias. Alternatively, our stop loss will be placed at 2nd support at 0.67395 in line with 100% Fibonacci extension.
Areas of consideration:
- H4 time frame, 1st resistance at 0.68569
- H4 time frame, 1st support at 0.67815
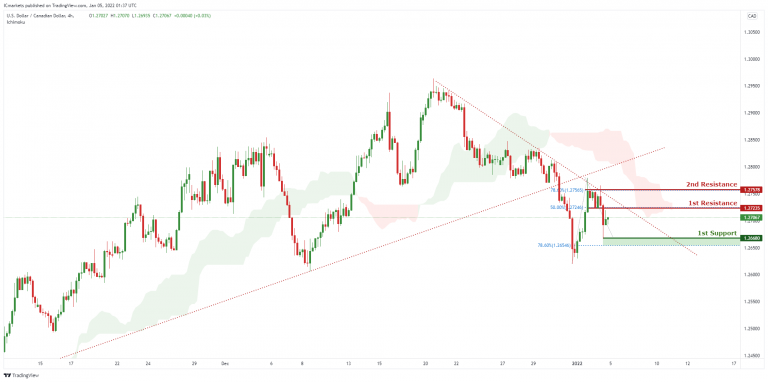
USD/CAD:
On the H4, with price moving below the ichimoku indicator and in view of the recent triangle breakout pullback, we have a bearish bias that price will drop from our 1st resistance at 1.27235 which is in line with horizontal overlap resistance and 50% Fibonacci retracement level to 1st support at 1.26680, which is in line with horizontal swing low support and 78.6% Fibonacci retracement. Alternatively, price may rise up to our 2nd resistance at 1.27578, which coincides with horizontal swing high resistance and 78.6% Fibonacci retracement level .
Areas of consideration:
- H4 time frame, 1st support at 26680
- H4 time frame, 1st resistance at 27235
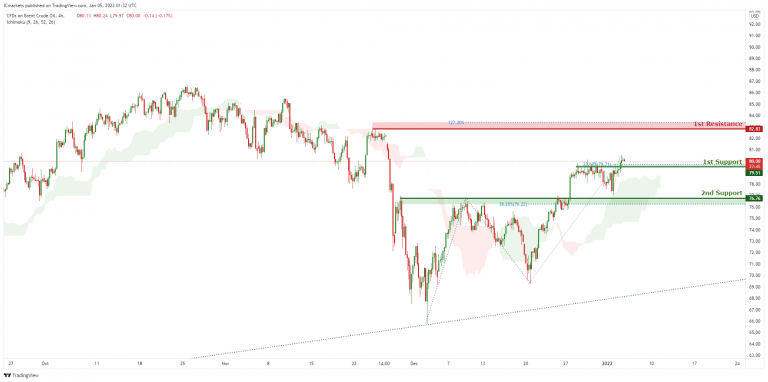
OIL:
On the H4, with price moving above the ichimoku cloud, we have a bullish bias that price will rise to our 1st resistance at 82.83 which is in line with horizontal swing high resistance and 127.2% Fibonacci extension from 1st support at 79.51, which is in line with horizontal overlap support and 23.6% Fibonacci retracement level. Alternatively, price may break 1st support structure and head for 2nd support at 76.76, which coincides with horizontal overlap support and 38.2% Fibonacci retracement level .
Areas of consideration:
- H4 time frame, 1st resistance of 83
- H4 time frame, 1st support of 51
Dow Jones Industrial Average:
On the H4, with price moving above the ichimoku cloud, we have a bullish bias that price will rise to our 1st resistance at 37124 which is in line with horizontal swing high resistance and 161.8% Fibonacci extension from 1st support at 36555, which is in line with horizontal overlap support and 23.6% Fibonacci retracement level. Alternatively, price may break 1st support structure and head for 2nd support at 36258, which coincides with horizontal overlap support and 38.2% Fibonacci retracement level .
Area of consideration:
- 4H resistance at 37124
- 4H support at 36555


