
Gold closed the previous week in positive territory, yet did not manage to break outside the sideways motion it has been trading in, for most of the past month. In the current week, Gold is marginally lower yet traders seem to remain excited as a sentiment for stabilization at higher grounds may be in the market’s focus. This report will present an overview of the key matters currently driving the Gold market, from our perspective. Our aim is to provide a brief but analytical presentation to traders, enabling them to trade the gold market successfully. Our closure will consist of Gold’s technical analysis, indicating important levels and possible trending scenarios.
At the moment the market’s concern turns the gloomy outlook for the first quarter of the current year. Some of the largest economies of the world like the US and China are still dealing with the spread of the omicron variant that is a great threat to consumer spending and business growth or investment. Yesterday, economic data from China indicated the Mainland’s yearly GDP rates for Q4 fell from previous 4.9% to 4.0%. Even though the figure remains comfortably high, the slowdown is significant and could be preparing the ground for what can follow in the first part of 2022. However, the most important development in China came unexpectedly on Monday when China’s central bank cut the borrowing costs of its medium-term loans by 10 basis points to 2.85% from 2.95% for the first time since April 2020. China’s unexpected rate cut tends to signal some uncertainty for its future growth. This can also be a confirmation that circumstances in the Chinese economy may have worsened recently leaving the central bank with no other option. Gold’s price received some support during the Asian session on Monday, possibly as a result of this development.
In the US, Inflationary pressures are still very strong and investors are possibly making adjustments to their strategy to cover for possible losses. In the previous week the US weekly CPI rate was just at 0.5%, while the yearly headline and Core rates ticked higher and reached 7.0% and 5.5% accordingly. Higher inflation tends to add demand for Gold as the metal can be used as a source for hedging risks arising from higher prices. Upon release of the news Gold gained but in a rather controlled manner. At the same time, in the US, market participants are expecting the Federal Reserve to enact interest rate hikes in the near future. Rate hikes are a broad expectation of the market due to the fact that this tool can help counter the inflation pressures that are worrying at the moment. Yet if the market receives further information and was to price in a rate hike by the Fed anytime soon, then we expect Gold traders to take substantial action placing orders. Yet we expect Gold’s unpredictable nature to be more prone to developments on the pandemic at this stage.
As our final part of the fundamental analysis we note the upcoming US financial releases that can possibly move Gold’s price in the following days. On the 19th of January we get the US Housing Starts Number for December, while on the 20th we get the US Philly Fed Business Index for January, the weekly initial Jobless claims figure and the Existing Home Sales figure for December. In the next week on Monday the 24th we get the very important Flash Markit Manufacturing and Services figures for January. Finally, on the 25th we get the US Consumer Confidence figure for January.
Technical Analysis
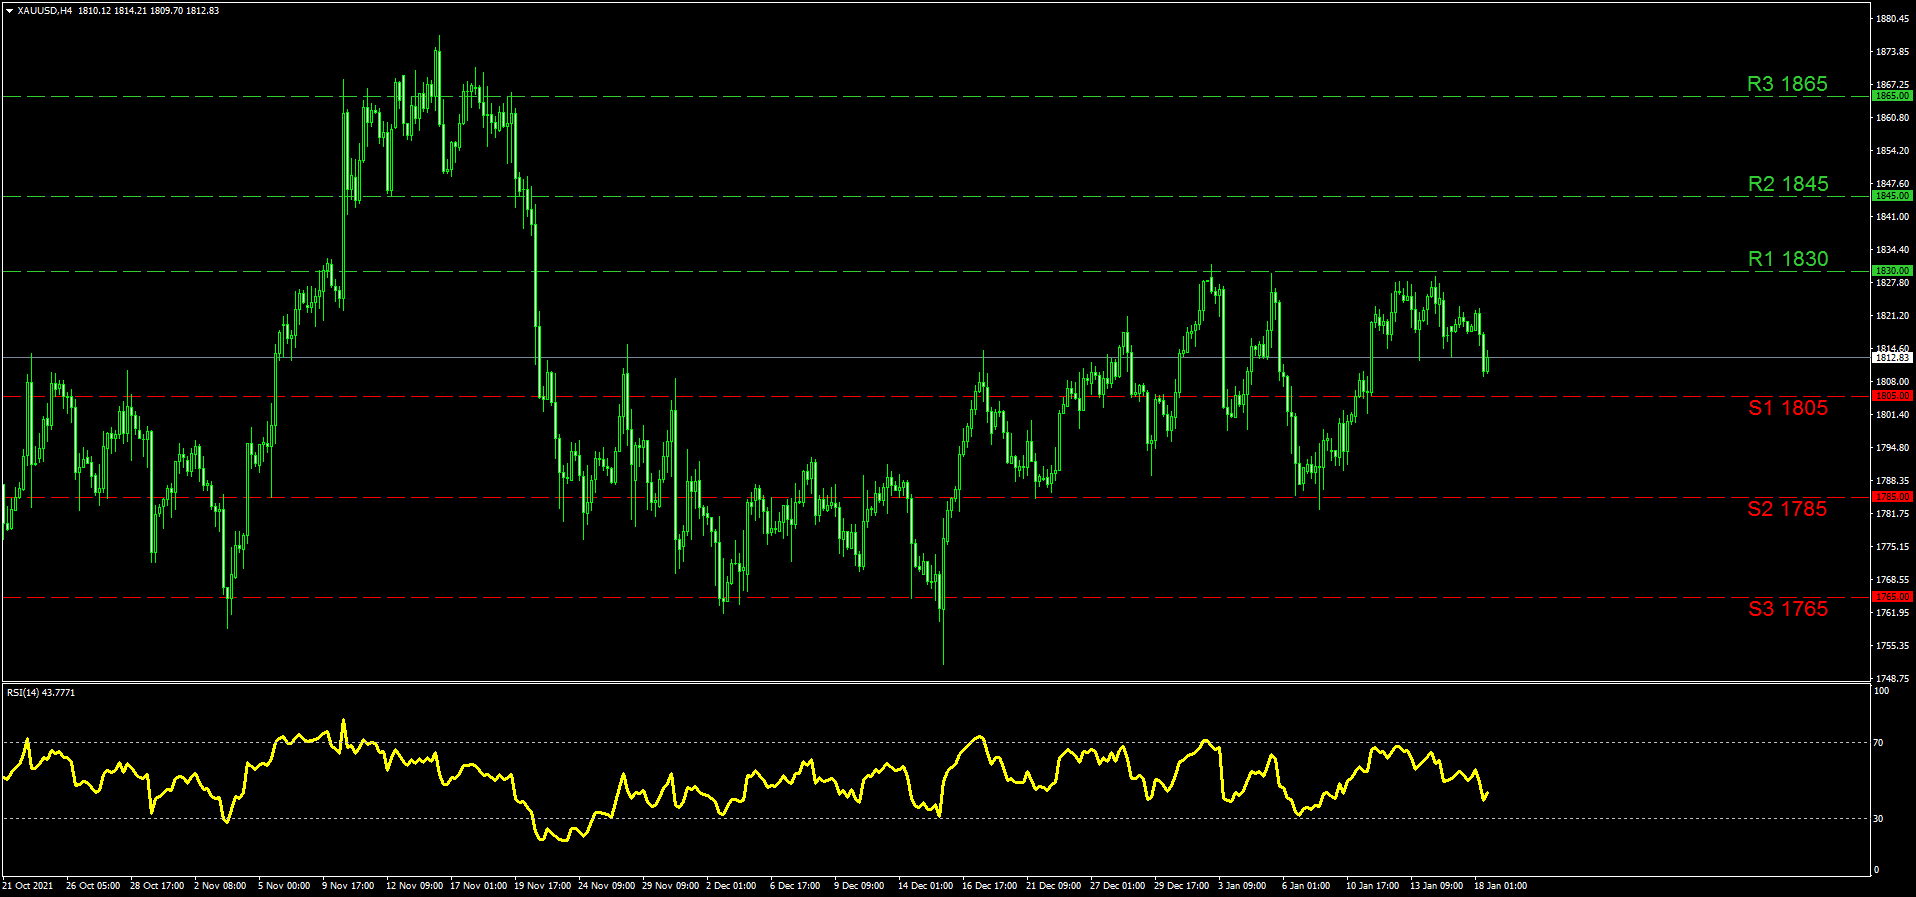
Gold continues to move in a wide sideways motion between the (R1) 1830 resistance and the (S2) 1785 support level. These levels have both been tested but not breached in January making them important for traders to keep in mind. The top, the (R1) has been tested clearly two times in January and was closely approached a third time on the 14th, making it a crucial barometer for Gold’s price further appreciation. If the price action does break above the (R1) then the (R2) 1845 level can be tested first. Our highest resistance line is noted at the (R3) 1865 level that was used as a high back in November. In the opposite direction, if a selling interest arises we could see Gold moving closer to the (S1) 1805 support level that was used previously as a resistance. The price action, has risen above and submerged below the (S1) various time since December thus traders may have to use it with alertness due to the fact that it may be ignored occasionally. Lower, as we noted stands the very distinguished (S2) 1785 level which has not been breached to the downside for more than a month. At the end we keep the (S3) 1765 line as our lowest support and can be used as a pending order or a target in an extensive selling strategy. The RSI indicator remains above 30 for the time being confirming the bearish tendencies in the short-term. Overall we tend to maintain a sideways bias yet a break above the (R1) could signal bullish tendencies for Gold while a move below the (S1) could invite bearish ones.


