
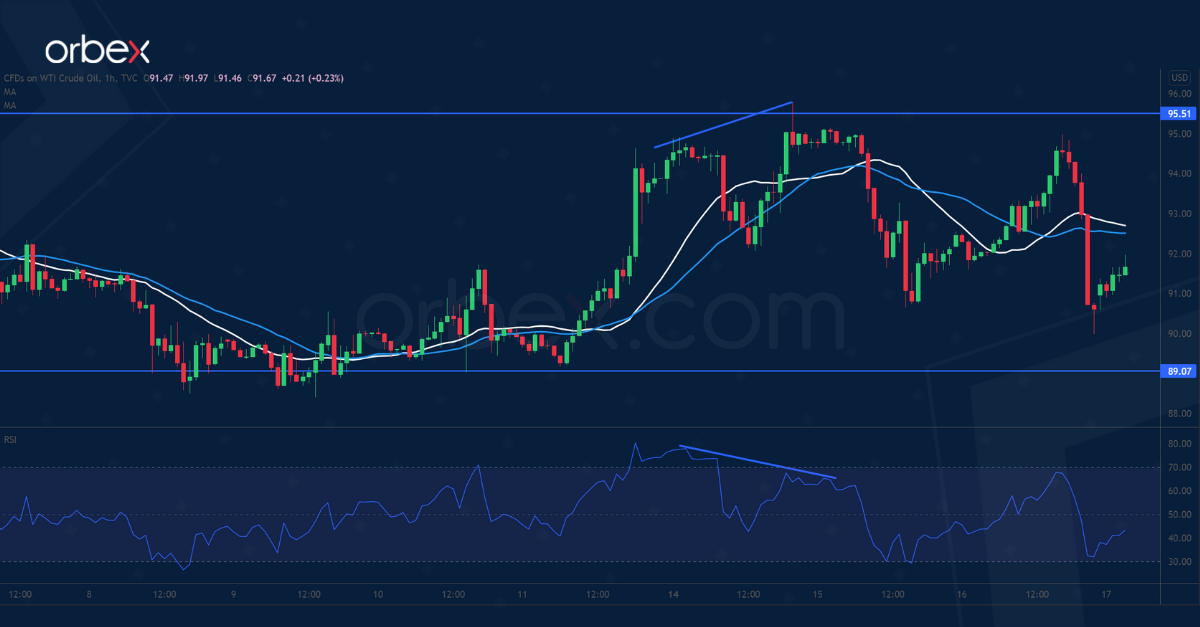
Oil prices faltered after a surprise rise in US inventories. WTI hits resistance at September 2014’s high (95.50).
The RSI’s repeated overbought situation on the daily chart may restrain the bullish fever. A bearish RSI divergence on the hourly time frame indicates a loss of momentum in the short term. 89.10 is the closest support that sits along the 20-day moving average.
Buyers could be waiting to enter at pullbacks. A deeper retreat could trigger a sell-off towards 84.00, which is a demand zone from January’s breakout.


