
Hello fellow traders. Another instrument that has given us trading setup lately is BTCUSD. In this technical blog we’re going to take a quick look at the Elliott Wave charts of Bitcoin. As our members know the Cryptocurrency shows lower low sequences in the cycle from the all-time high ( 10 November 2021). That makes BTCUSD bearish against the 52094.62 pivot. We recommended members to avoid buying BTCUSD at this stage and keep selling rallies in 3,7,11 swings. Recently Bitcoin has given us 3 waves bounce against the 52094.62 high that has given us good trading opportunity. In the further text we are going to explain the Elliott Wave Forecast and the trading strategy.
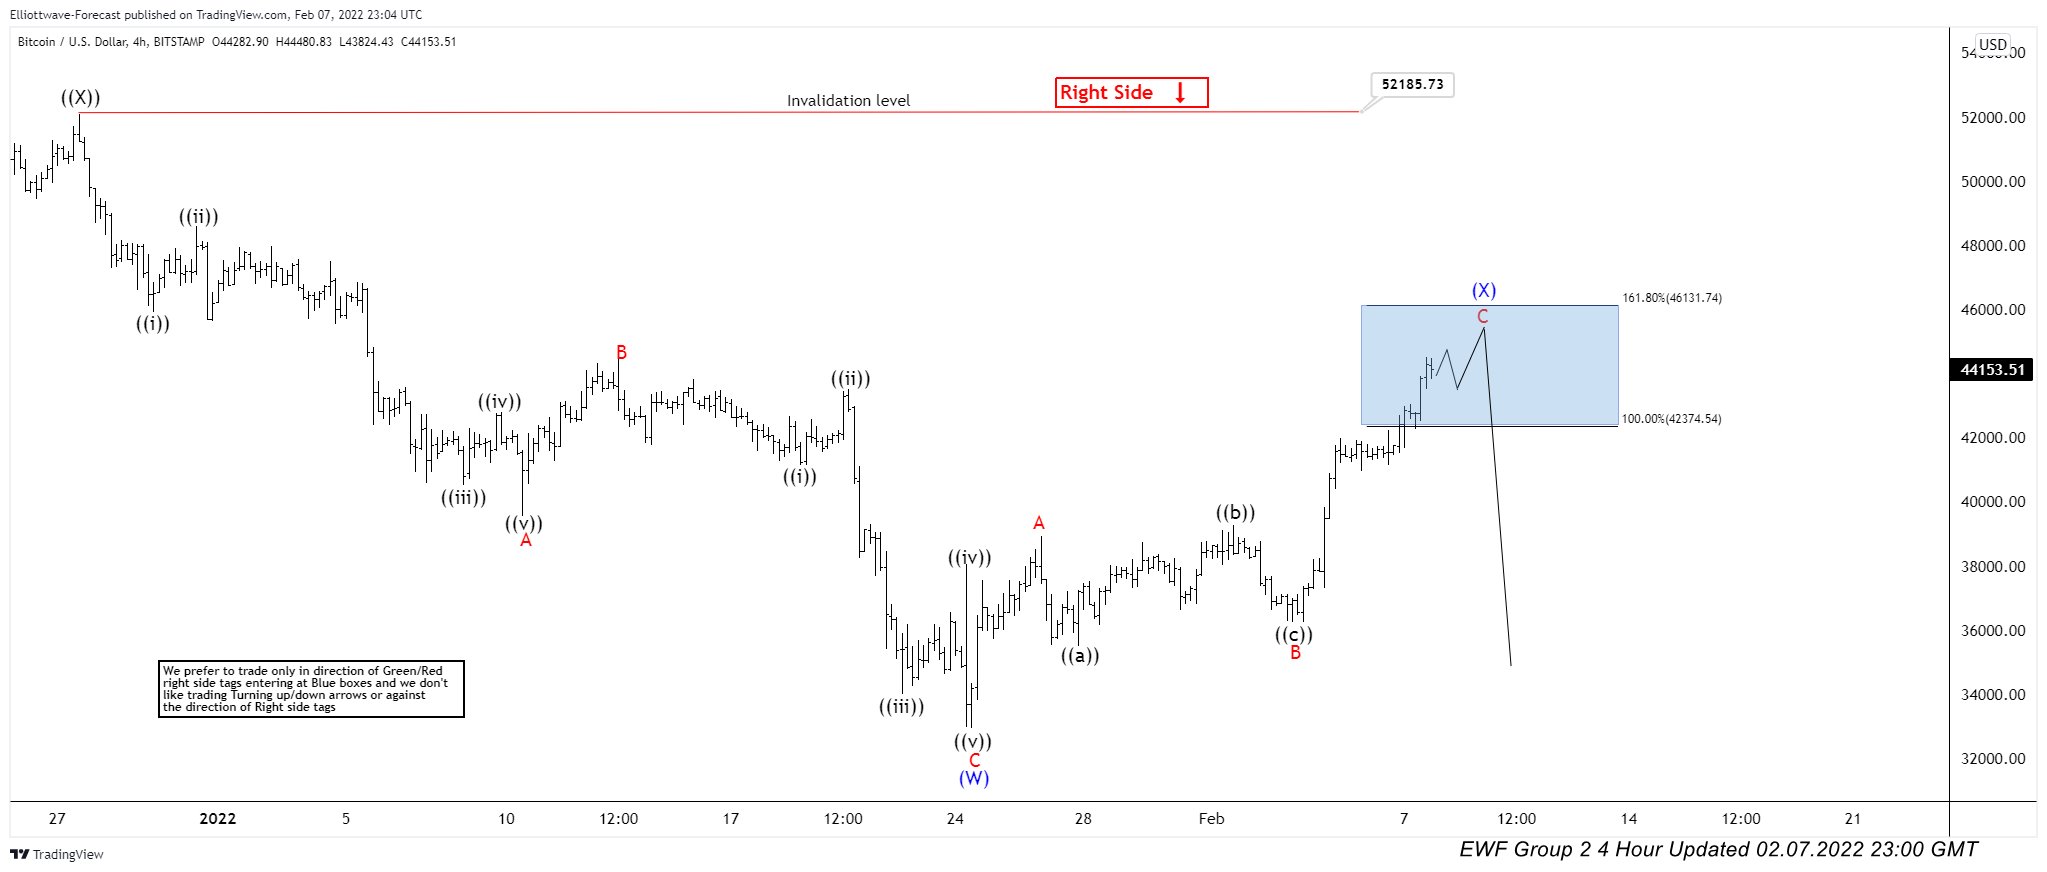
BTCUSD H4 Elliott Wave Analysis 02.07.2022
BTCUSD is correcting the cycle from the 52185.7 peak. Correction looks to be unfolding as Elliott Wave Zig Zag pattern, with ABC red labeling. Recovery (X) blue already shows 3 waves up and price is at the extremes (blue box zone) . We recommended members to avoid buying the Cryptocurrency at this stage while favoring the short side. We expect sellers to appear at the blue box : 42374.5-46131.7 area. As the cycle from the November 2021 looks incomplete, we believe Bitcoin should see further decline from the marked zone or 3 waves pull back alternatively. Once pull back reaches 50 Fibs against the B red low, we will make short position risk free ( put SL at BE). Invalidation for the trade would be break above 1.618 fibs extension: 46131.7
As our members know Blue Boxes are no enemy areas , giving us 85% chance to get a pull back.
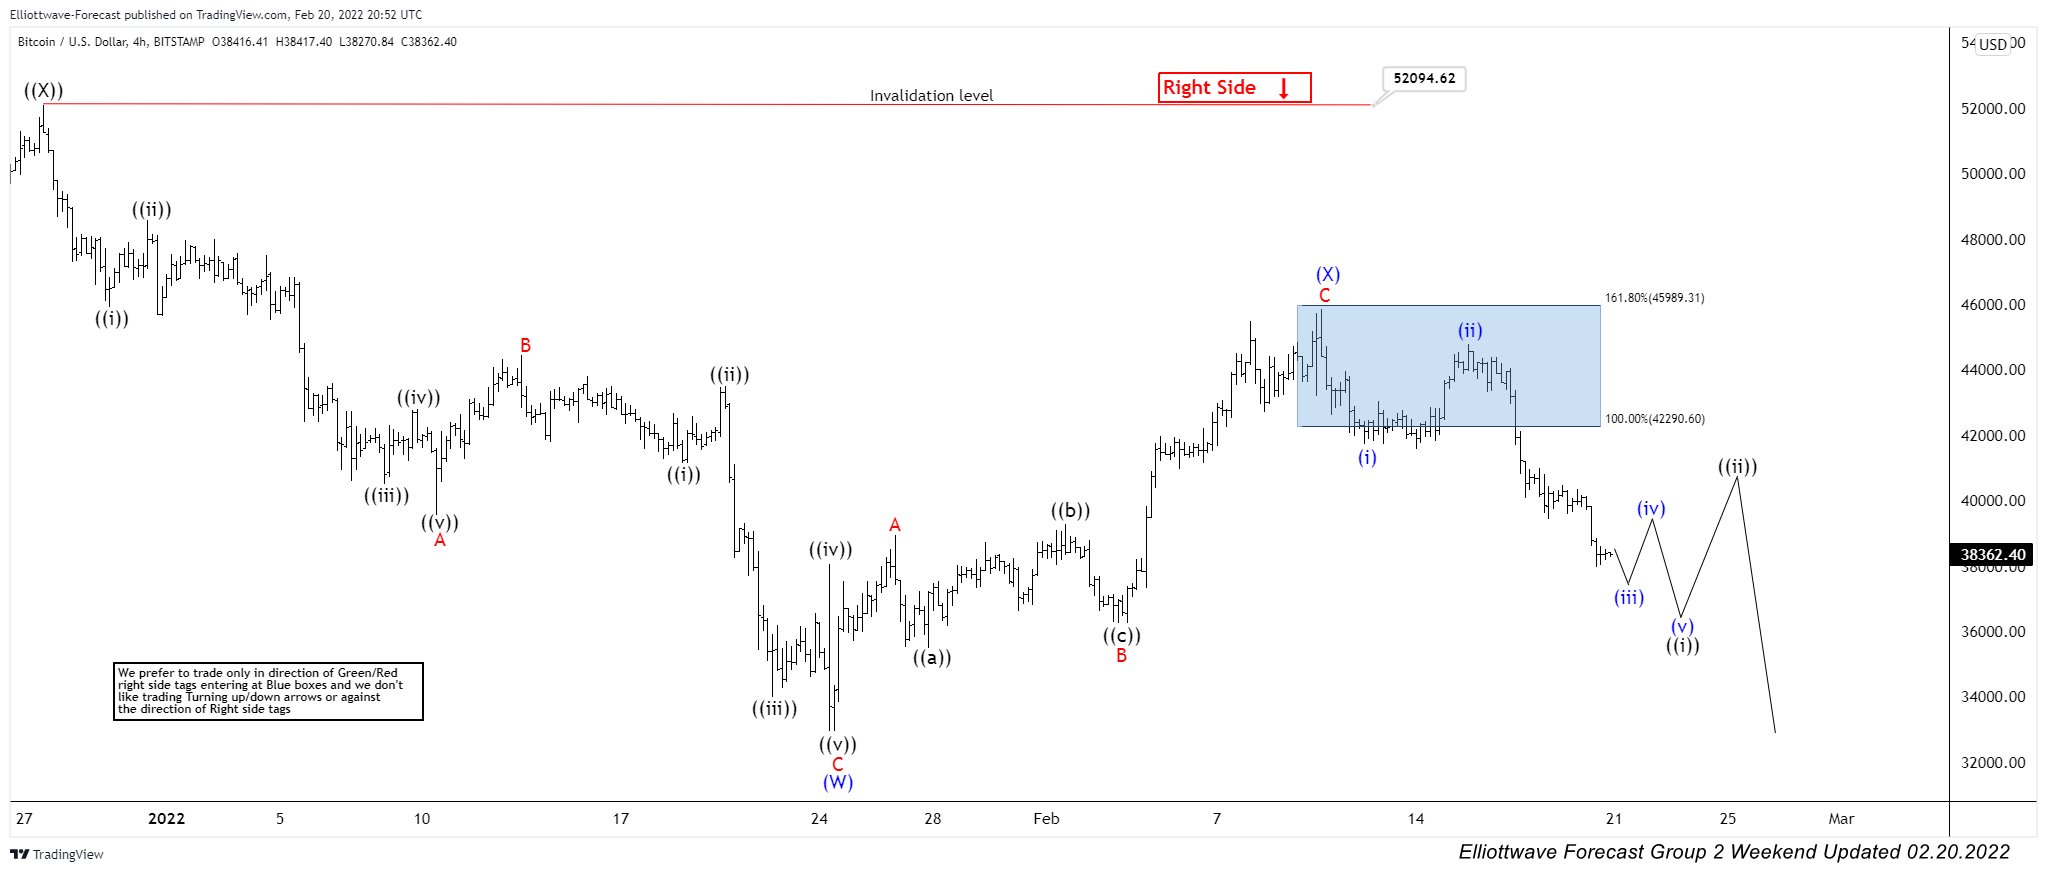
BTCUSD H4 Elliott Wave Analysis 02.07.2022
The price held below upper level of the blue box : 45989.3 . Sellers were strong enough to pull the price lower. We are calling (X) recovery completed at 45875.8 high. However, break of January 24th low is needed for a confirmation. The decline from the selling zone ( blue box) has already reached and exceeded 50 fibs against the ((b)) black connector. As a result members who took short trades are enjoying profits in risk free positions now. All positions from the blue box are risk free. (SL is put at BE) + partial profit is taken.
We know it’s not popular to call decline in $BTCUSD, but that is what sequences suggest. As our members know we have had a lot of buying setups in BTCUSD during the past 2 years. But at this moment Crypto still shows incomplete sequences so bulls should be careful. 52094.6high is the key pivot to hold for the bearish view.
Keep in mind market is dynamic and presented view could have changed in the mean time. You can check most recent charts in the membership area of the site. Best instruments to trade are those having incomplete bullish or bearish swings sequences.We put them in Sequence Report and best among them are shown in the Live Trading Room.


