
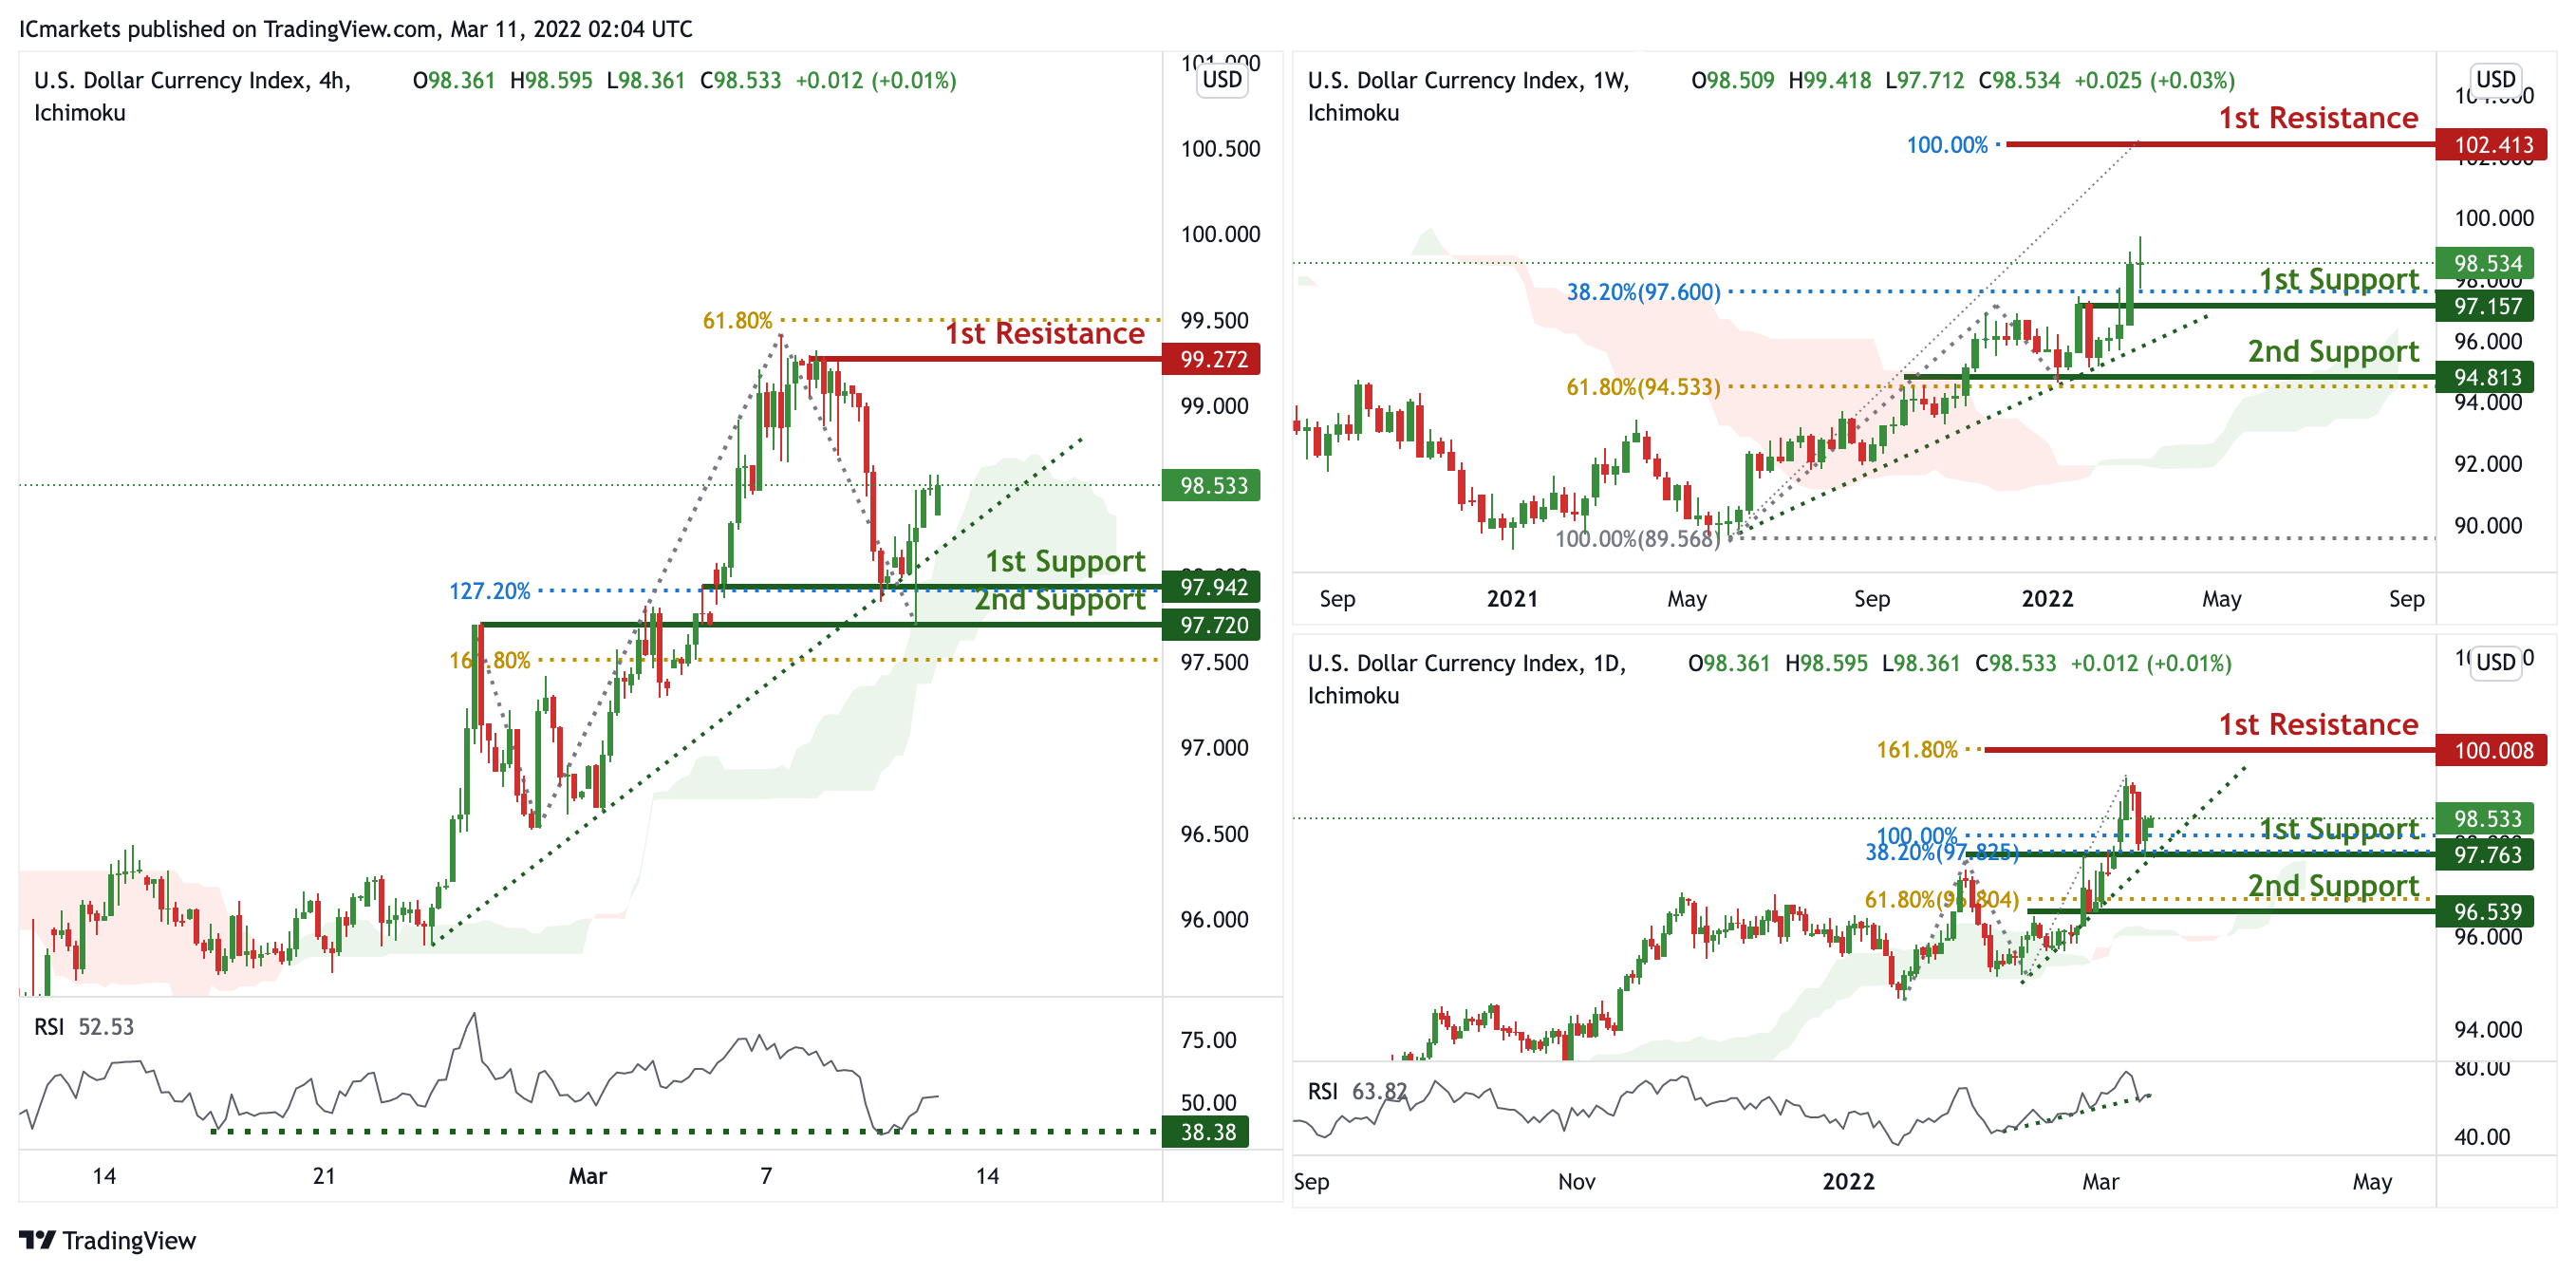
DXY:
On the weekly, prices are on bullish momentum and abiding to our ascending trendline support. We see the potential for further bullish continuation from our 1st support at 97.157 in line with 38.2% Fibonacci retracement towards our 1st resistance at 102.413 in line with 100% Fibonacci projection. Prices are trading above our ichimoku clouds, further supporting our bullish bias.
On the daily, prices are on bullish momentum and abiding to our ascending trendline support. We see the potential for further bullish continuation from our 1st support at 97.763 in line with 100% Fibonacci projection and 38.2% Fibonacci retracement towards our 1st resistance at 100.008 in line with 161.8% Fibonacci projection. Prices are trading above our ichimoku clouds and RSI is on bullish momentum, further supporting our bullish bias.
On the H4 timeframe, prices are on bullish momentum and abiding to our ascending trendline support. We see the potential for further bullish continuation from our 1st support at 97.942 in line with 127.2% Fibonacci projection towards our 1st resistance at 99.272 in line with 61.8% Fibonacci retracement. Prices are trading above our ichimoku clouds and RSI is at levels where bounces previously occurred.
Areas of consideration:
- H4 time frame, 1st resistance at 99.272
- H4 time frame, 1st support at 97.942
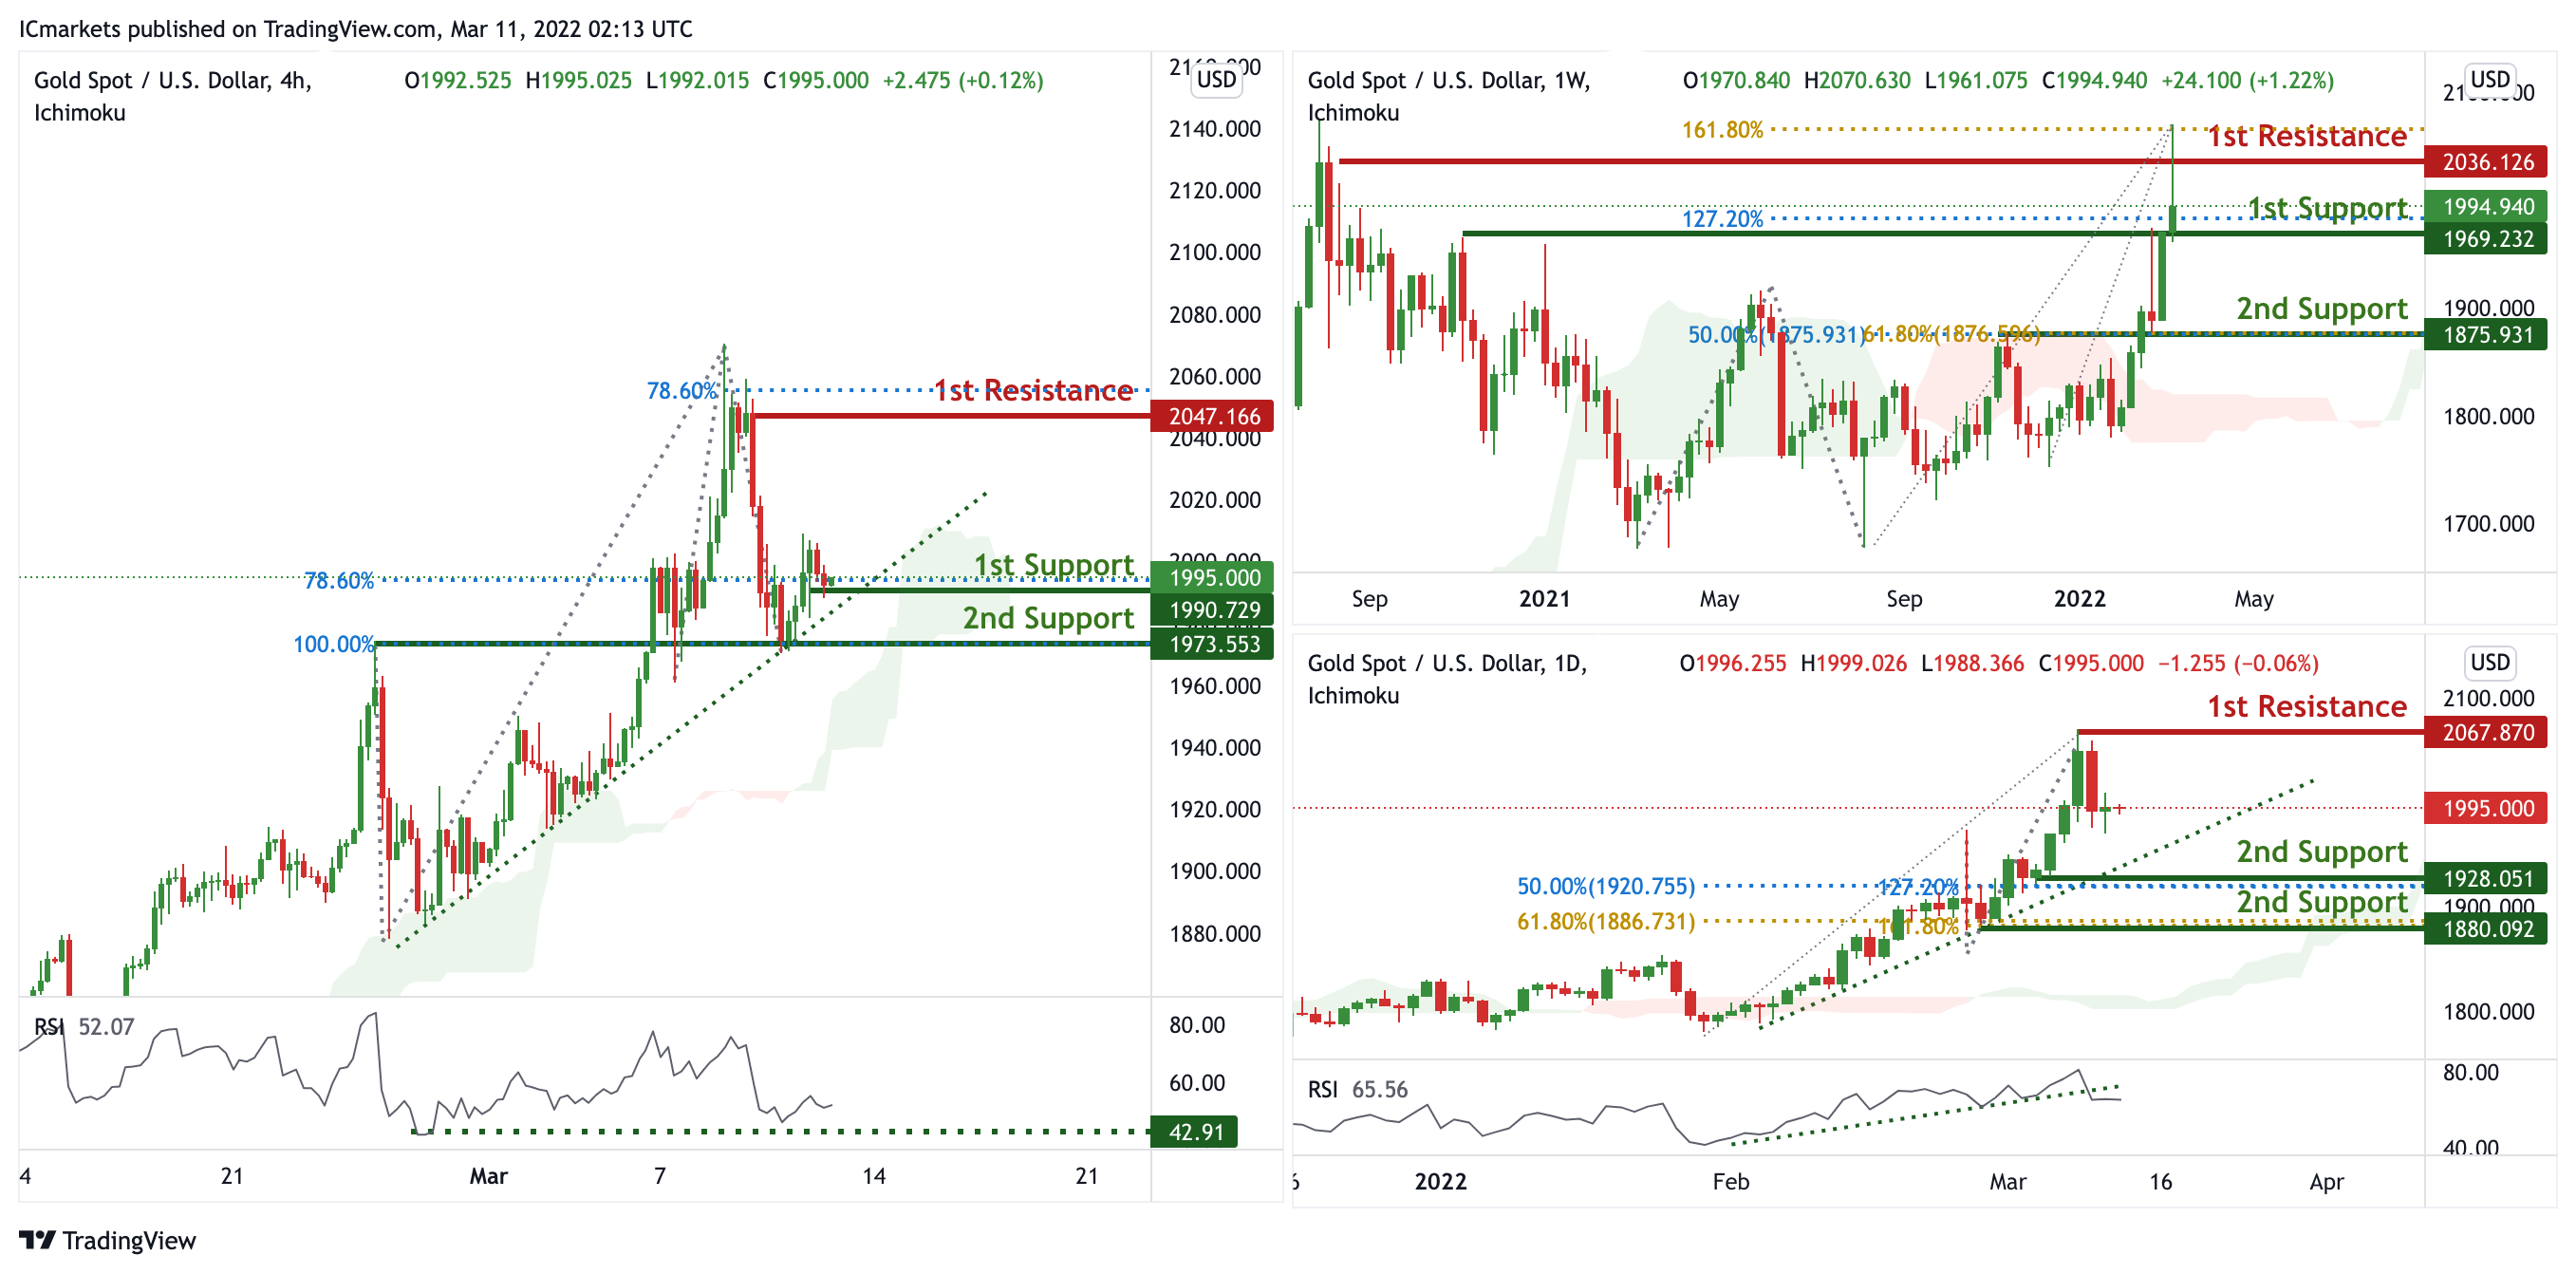
XAU/USD (GOLD):
On the weekly, prices are on bullish momentum and abiding to our ascending trendline support. We see the potential for further bullish continuation from our 1st support at 1969.232 in line with 127.2% Fibonacci projection towards our 1st resistance at 2036.126 in line with 161.8% % Fibonacci projection. Prices are trading above our ichimoku clouds and RSI is on bullish momentum, further supporting our bullish bias.
On the daily, prices are on bullish momentum and abiding to our ascending trendline support. We see the potential for further bullish continuation from our 1st support at 1928.051 in line with 127.2% Fibonacci projection and 50% Fibonacci retracement towards our 1st resistance at 2067.870 which is a graphical swing high. Prices are trading above our ichimoku clouds and RSI is on bullish momentum, further supporting our bullish bias.
On the H4, prices are on bullish momentum and abiding to our ascending trendline support. We see the potential for further bullish continuation from our 1st support at 1990.729 in line with 78.6% Fibonacci projection towards our 1st resistance at 2047.166 in line with 78.6% Fibonacci projection. Prices are trading above our ichimoku clouds and RSI is on bullish momentum, further supporting our bullish bias.
Areas of consideration:
- 4h 1st support at 1990.729
- 4h 1st resistance at 2047.166
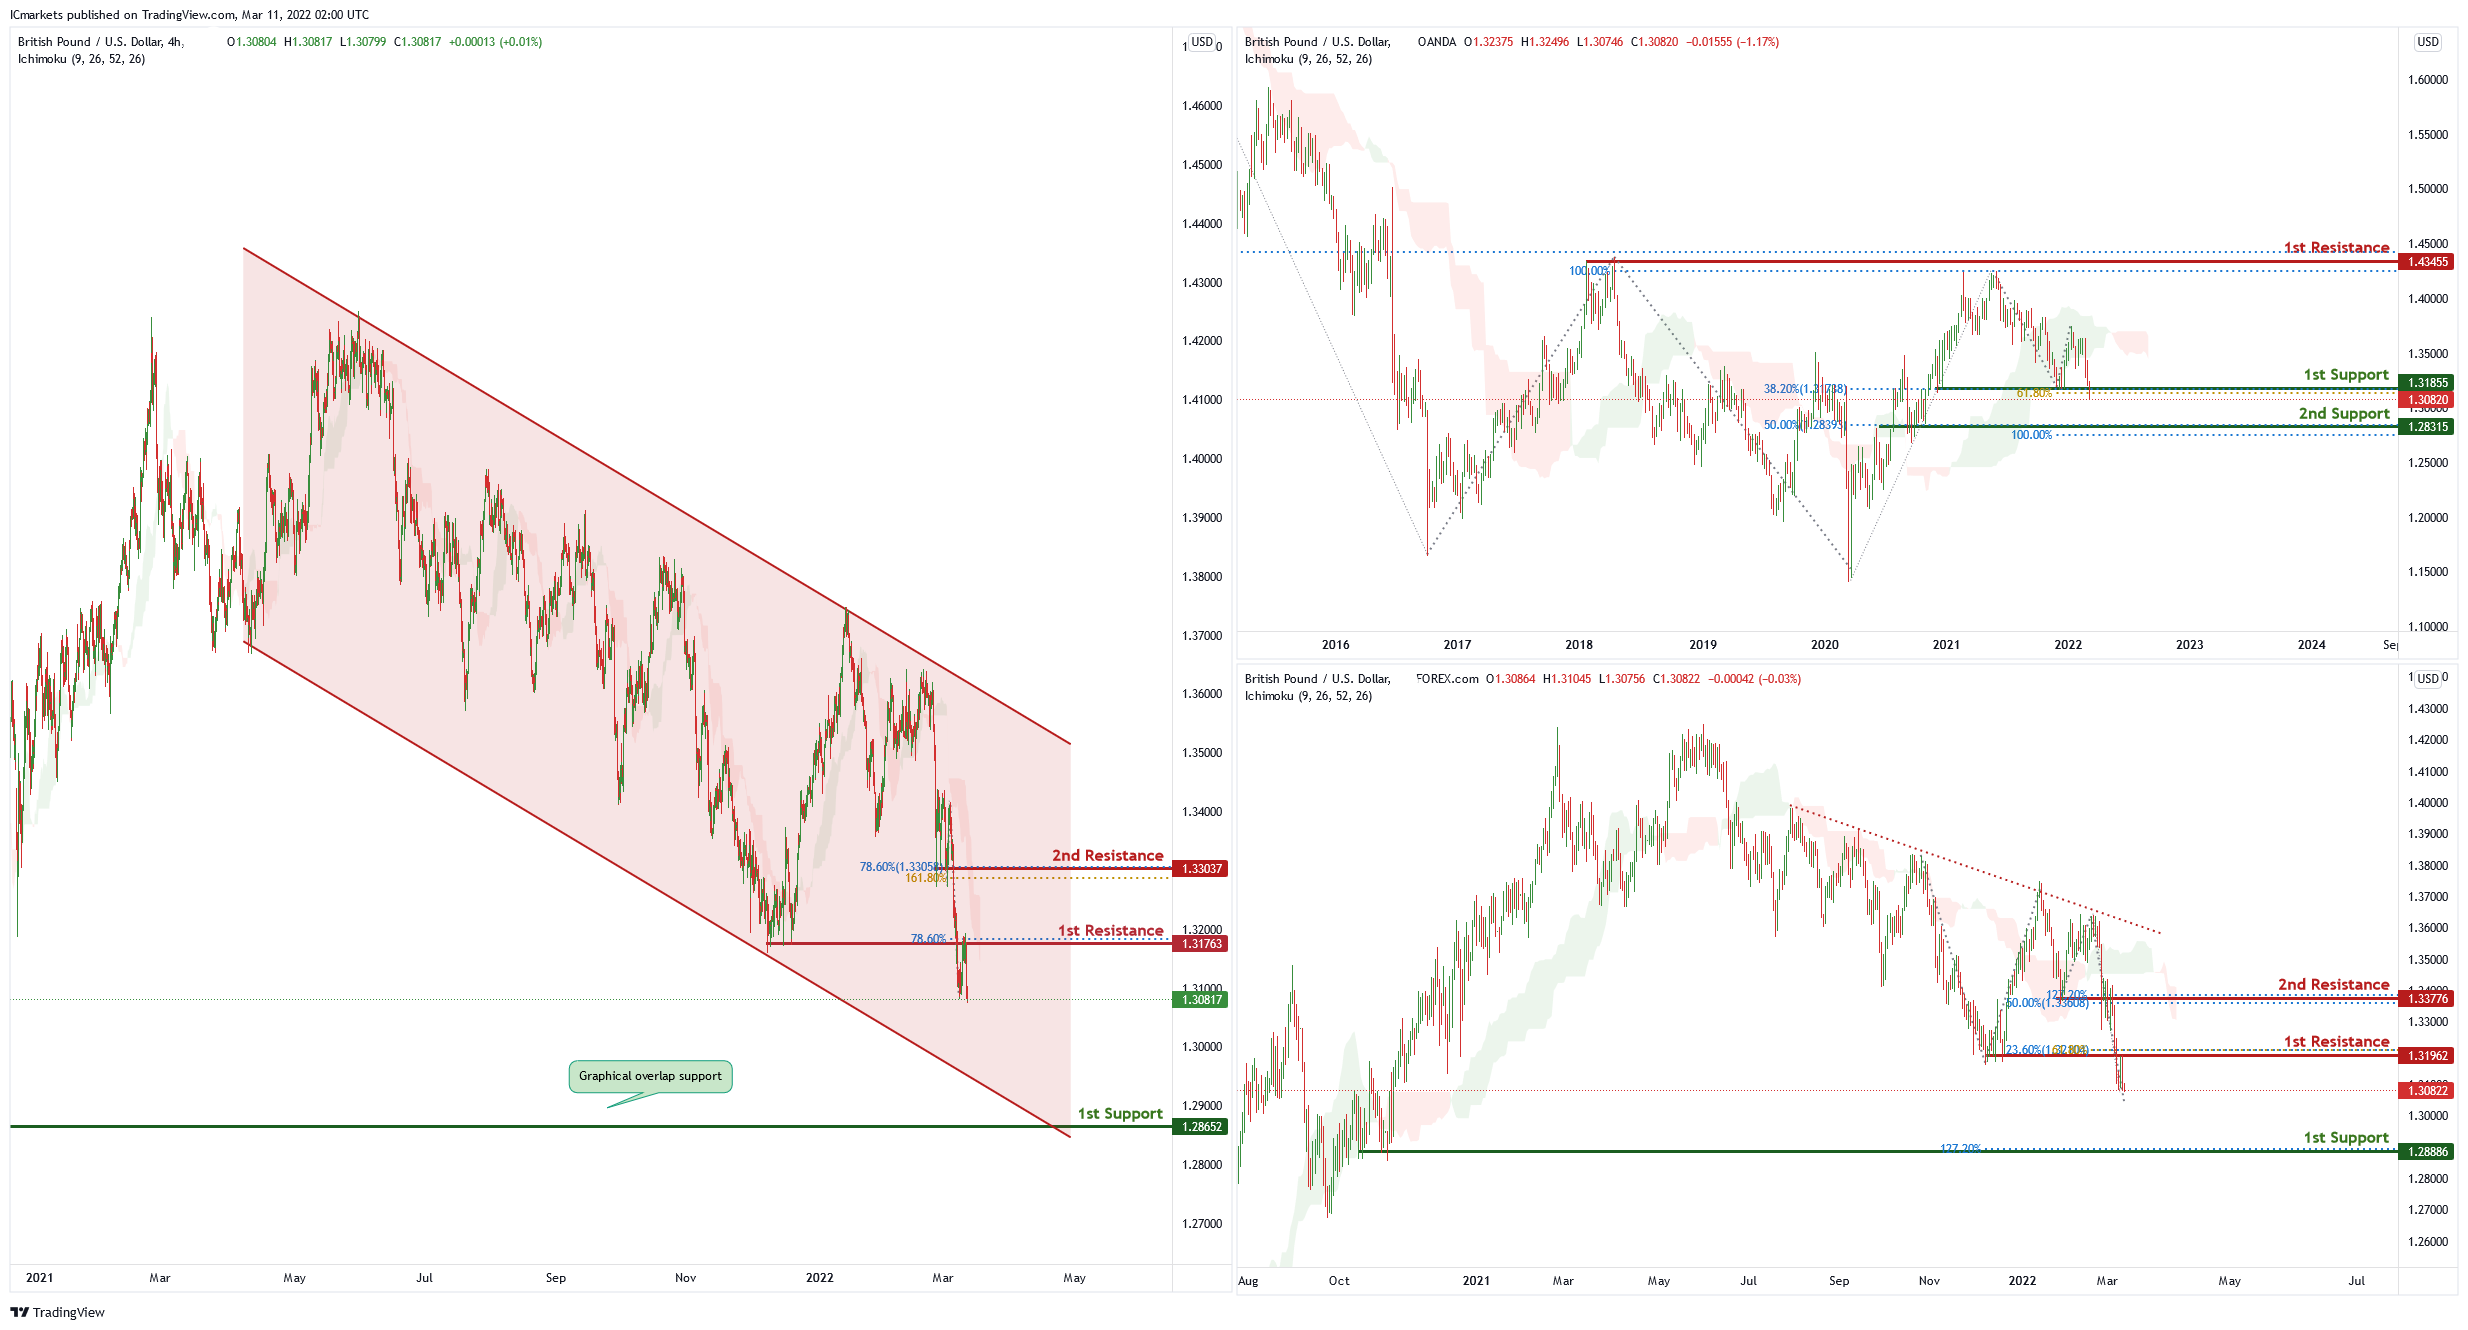
GBP/USD:
On the weekly chart , price has recently bounced off the 1st support level of 1.31885 which is also 38.2% Fibonacci retracement and 61.8% Fibonacci projection. Price can potentially go to the 1st resistance level of 1.42498 which is also 100% Fibonacci projection and 50% Fibonacci retracement. Our bullish bias is supported by the ichimoku cloud indicator.
On the daily chart , price is abiding by a descending trendline . Price is near the 1st resistance level of 1.31962 in line with 23.6% Fibonacci retracement and 61.8% Fibonacci projection. Price can potentially dip to the 1st support level of 1.28886 in line with 127.2% Fibonacci projection.Our bearish bias is supported by the ichimoku cloud indicator.
On the H4 chart price is trading in a descending channel and has recently broken the 1st resistance level of 1.31763 in line with 78.6% Fibonacci retracement. Price can potentially dip to the 1st support level of 1.28652 in line which is also the graphical overlap support. Our bearish bias is supported by the ichimoku cloud indicator as price is trading under it.
Areas of consideration
- H4 1st resistance at 1.31763
- H4 1st support at 1.28652
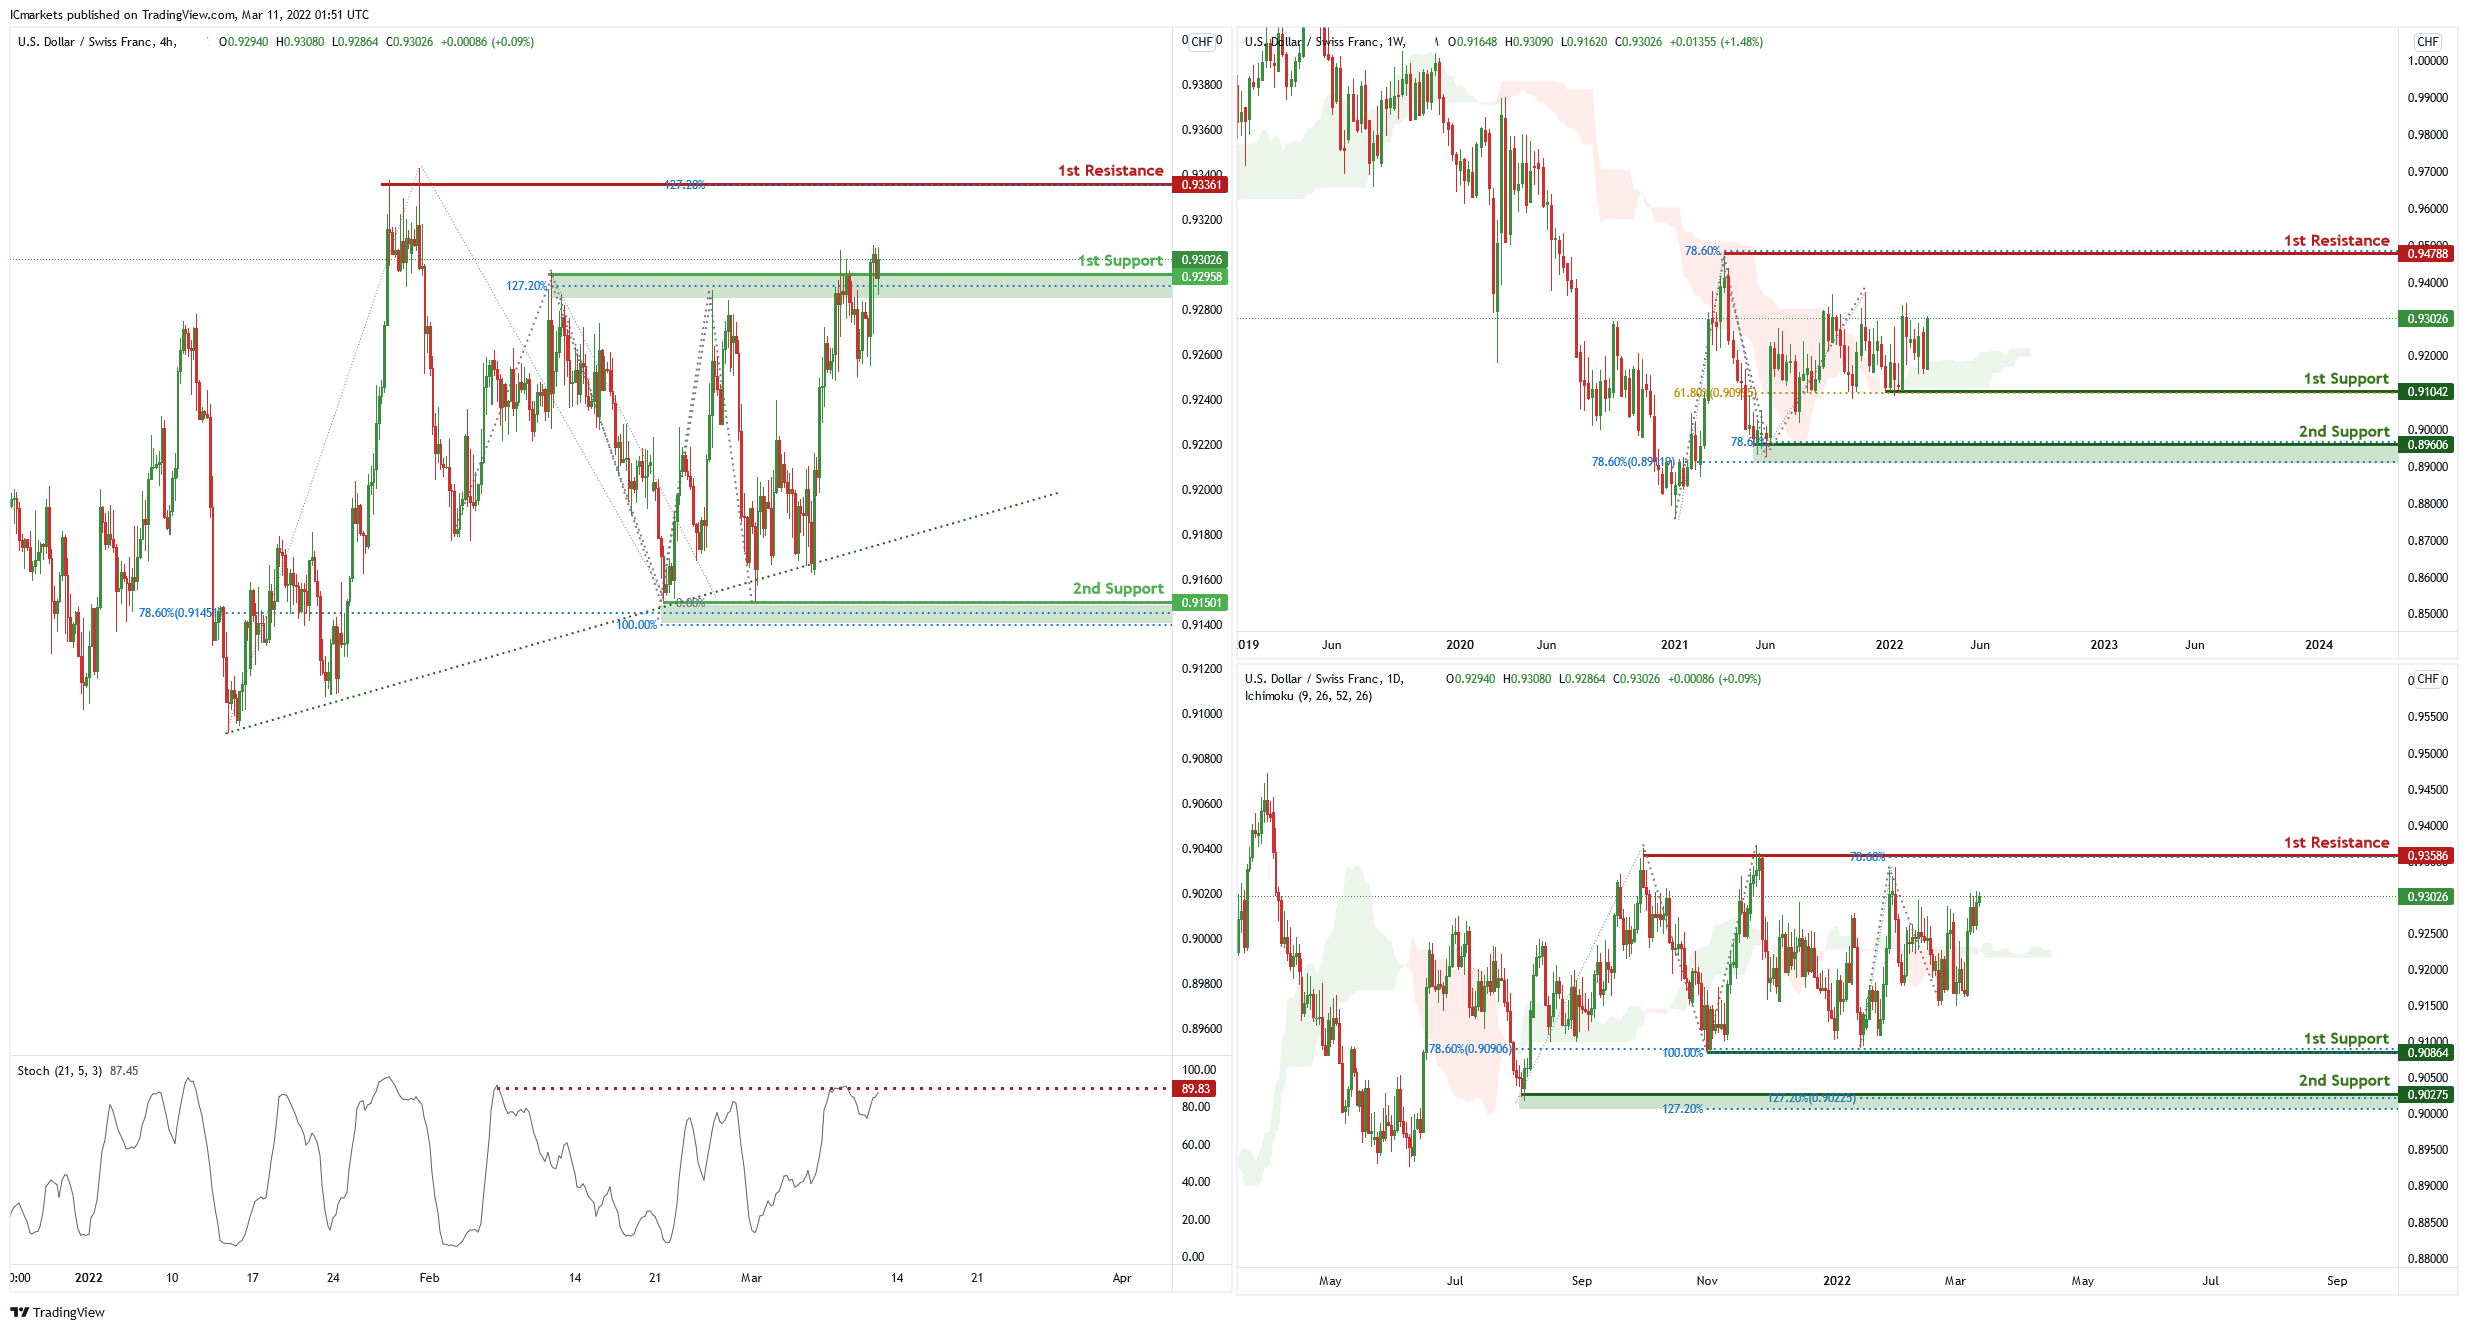
USD/CHF:
On the weekly chart, price is between 1st support level of 0.91042 in line with 61.8% Fibonacci retracement and 1st resistance level of 0.94788 in line with 78.6% Fibonacci projection. Price can potentially go to the 1st resistance level. Our bullish bias is supported by the ichimoku cloud indicator.
On the daily chart price is between 1st support of 0.90864 in line with 100% Fibonacci projection, 78.6% Fibonacci retracement and 1st resistance level of 0.93586 in line with 78.6% Fibonacci projection. Price can potentially go to the 1st resistance level which is also the graphical swing high level. Our bullish bias is supported by the ichimoku cloud indicator.
On the H4, price is abiding by an ascending trendline and near 1st support level of 0.92958 in line with 127.2% Fibonacci projection. Price can potentially dip to the 2nd support level of 0.91501 in line with 100% Fibonacci projection and 78.6% Fibonacci retracement. Our bearish bias is supported by the stochastic indicator as it is near resistance level
Areas of consideration
- 1st support level 0.92956
- 2nd support 0.91501
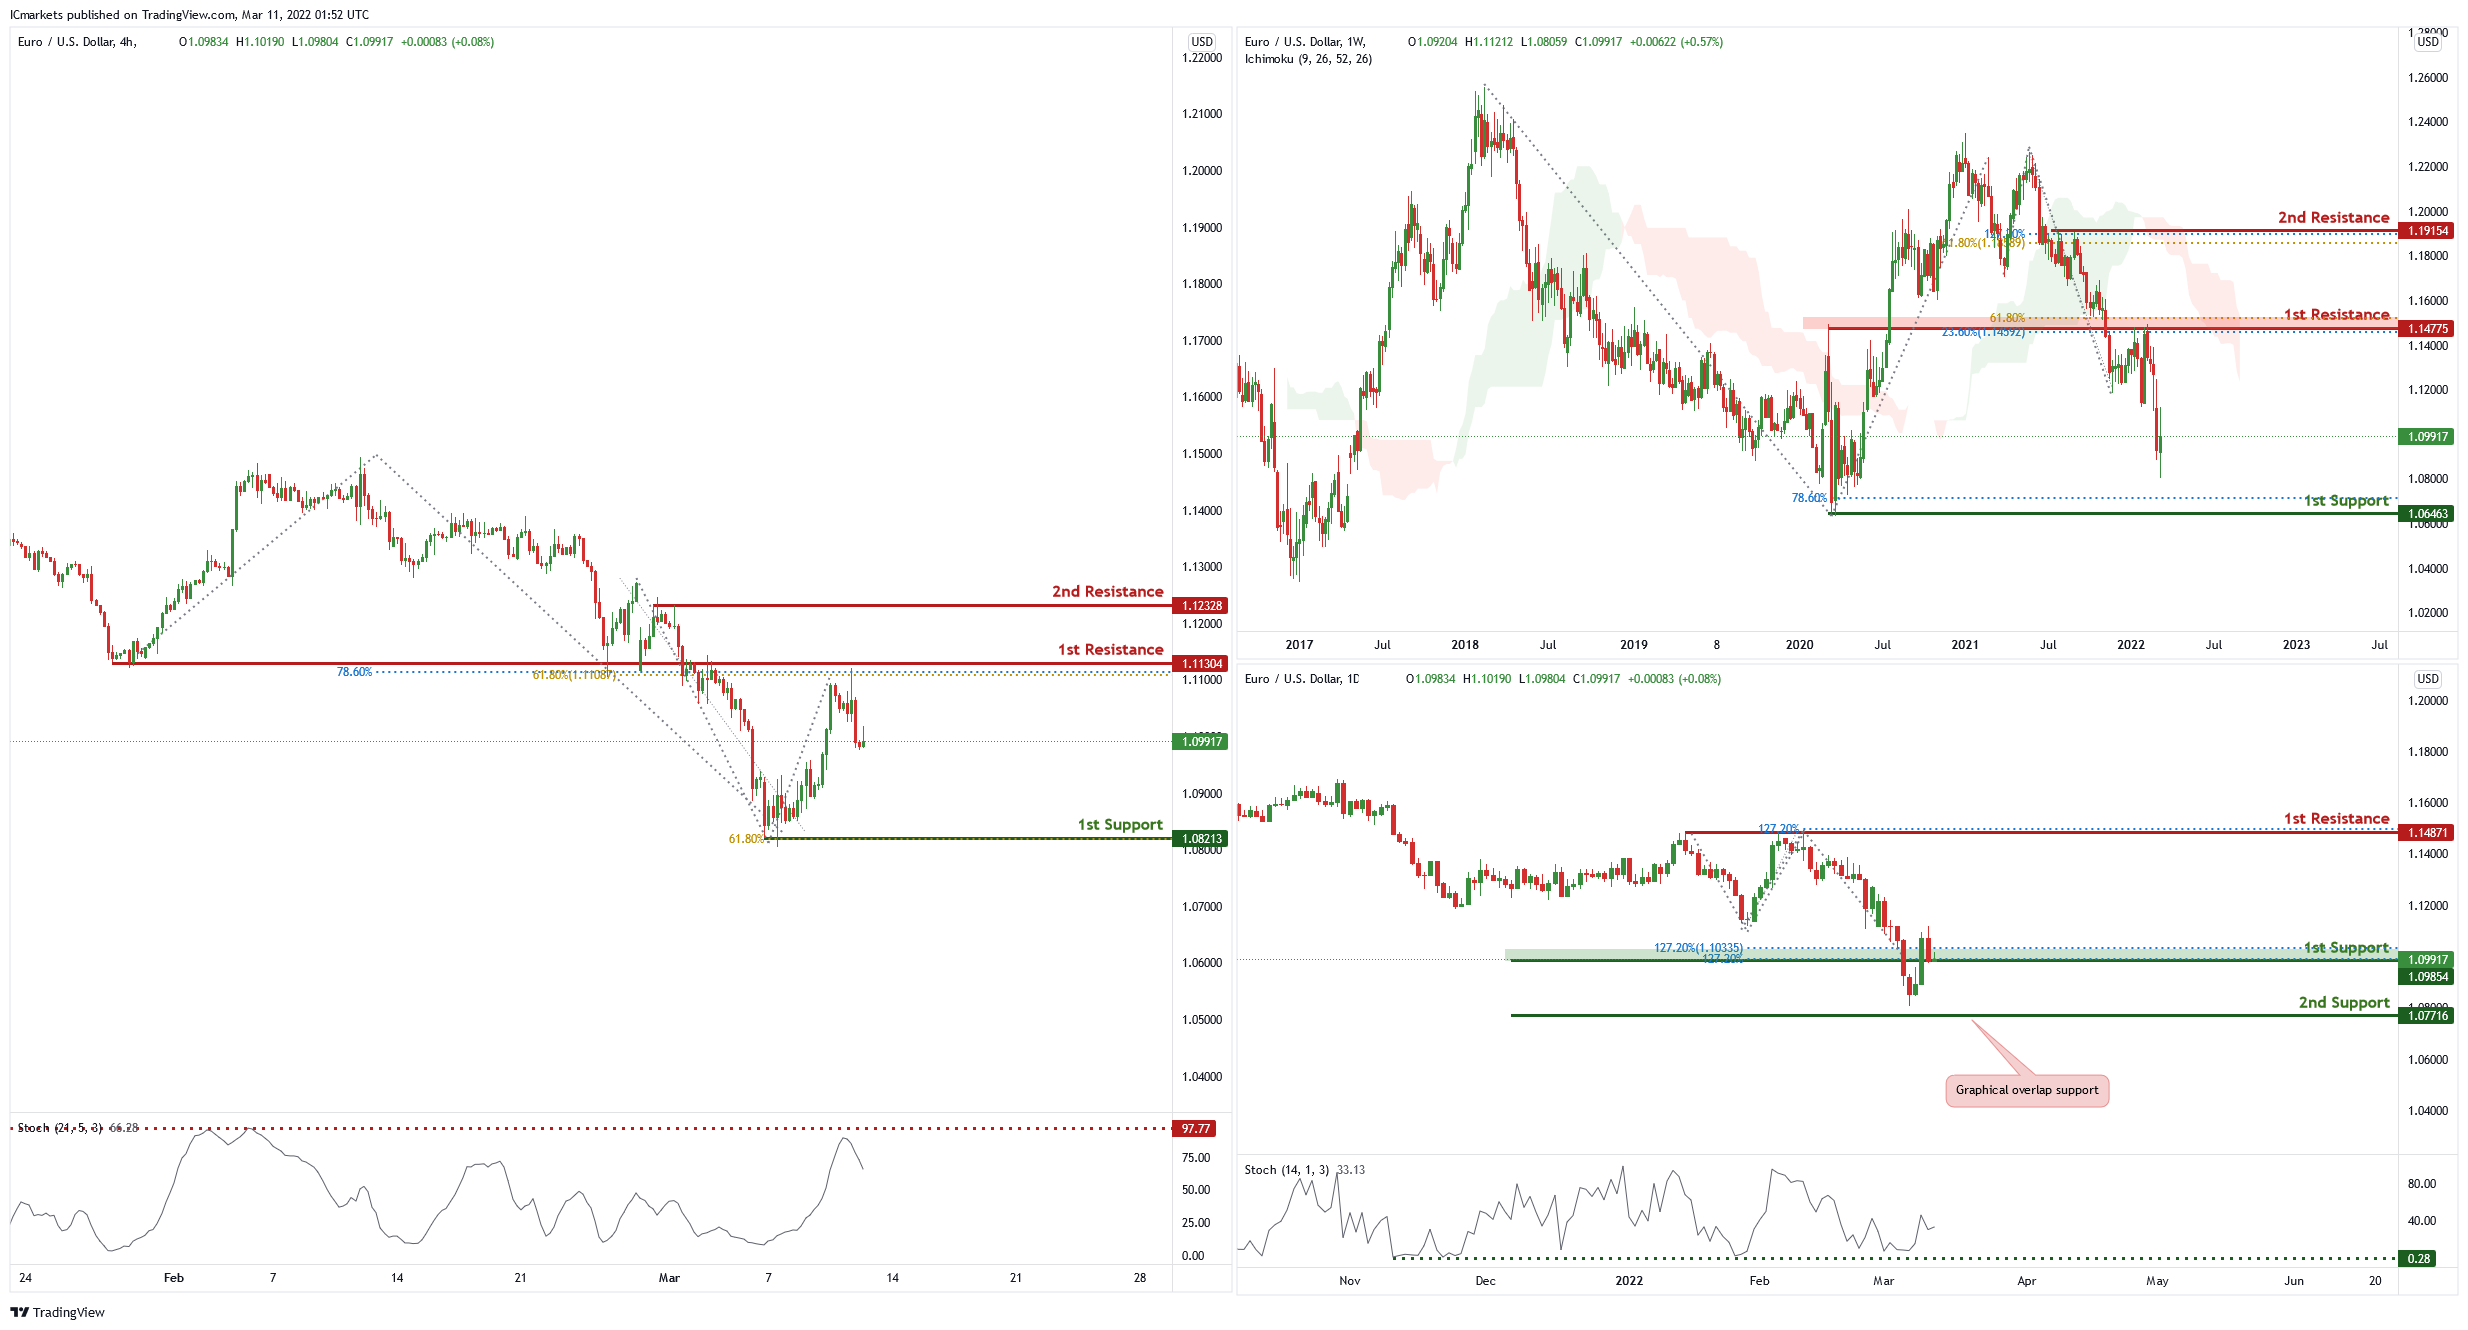
EUR/USD :
On the weekly chart , price is near 1st resistance level of 1.14775 in line with 23.6% Fibonacci retracement and 61.8% Fibonacci projection. Price can potentially dip to the 1st support level of 1.06463 in line with 78.6% Fibonacci projection. Our bearish bias is supported by the ichimoku cloud indicator as price is trading below it.
On the daily chart, price is at 1st support level of 1.09854 in line with 127.2% Fibonacci projection and 127.2% Fibonacci retracement. Price can bounce to the 1st resistance level of 1.14871 in line with 127.2% Fibonacci projection and graphical swing high . Our bullish bias is supported by the stochastic indicator as it is at support level.
On the H4 price is near 1st resistance level of 1.11304 in line with 78.6% Fibonacci projection and 61.8% Fibonacci retracement. Price can potentially dip to the 1st support level which is the graphical swing low and 61.8% Fibonacci projection. Our bearish bias is supported by the stochastic indicator as it is the graphical swing low and 61.8% Fibonacci projection
Areas of consideration :
- H4 1st resistance at 1.11304
- H4 1st support at 1.08213
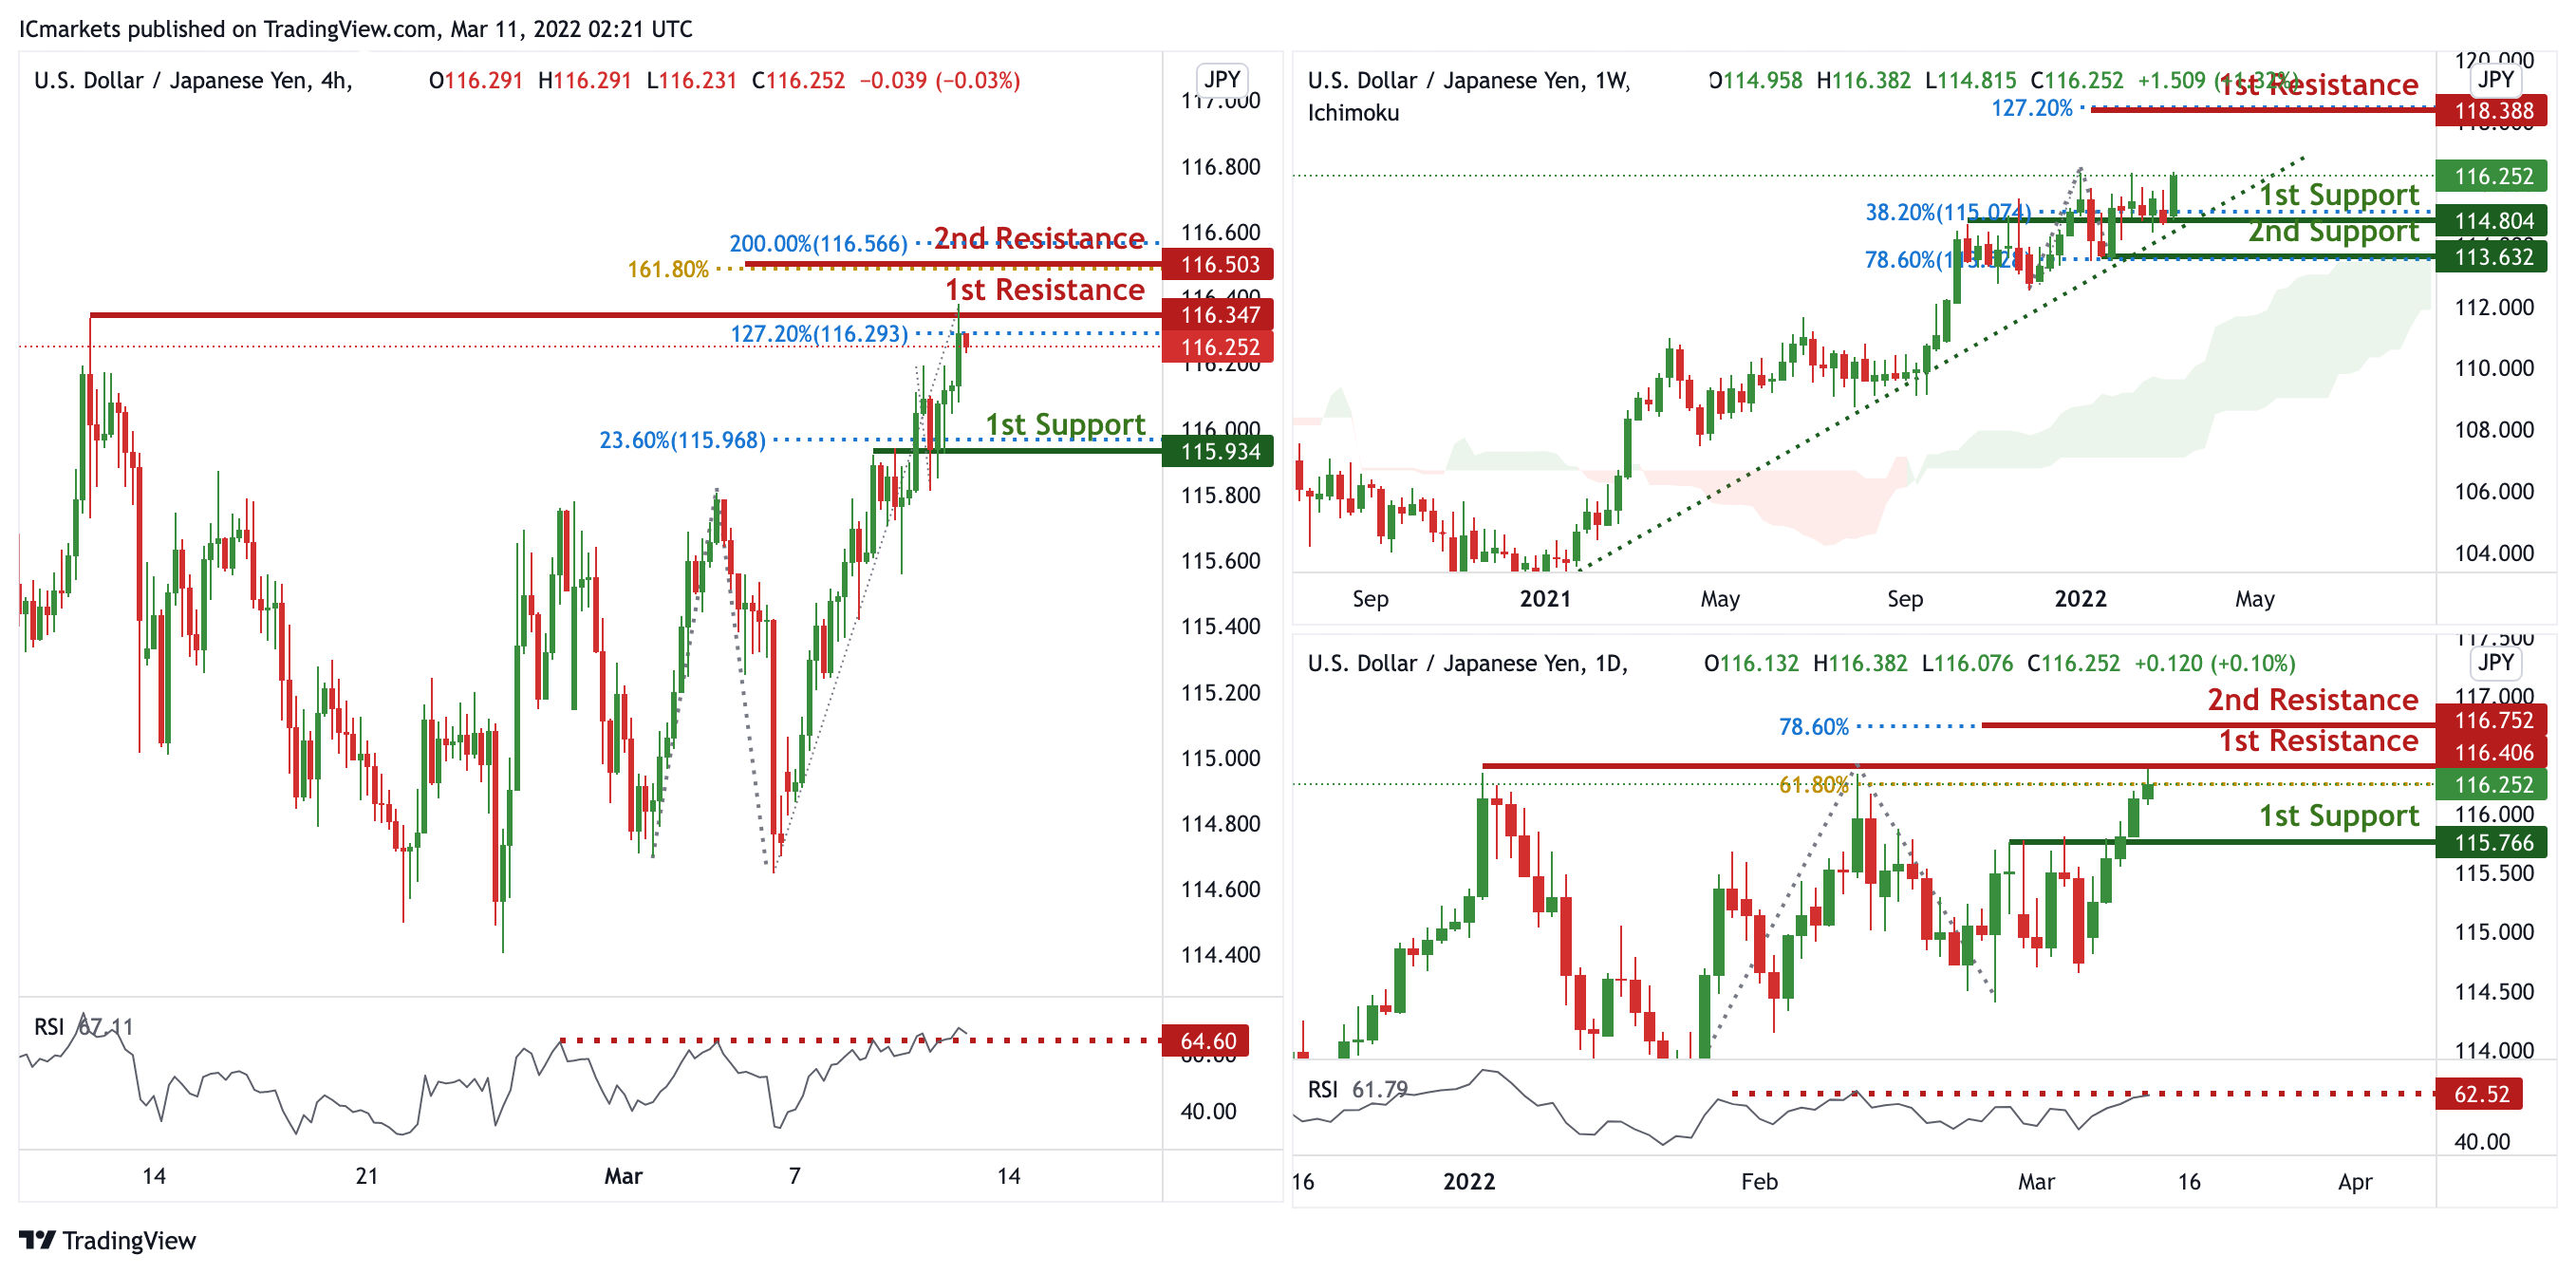
USD/JPY:
On the weekly, prices are on bullish momentum and abiding to our ascending trendline support. We see the potential for further bullish continuation from our 1st support at 114.804 in line with 38.2% Fibonacci retracement towards our 1st resistance at 118.388 in line with 127.2% Fibonacci projection. Prices are trading above our ichimoku clouds and RSI is on bullish momentum, further supporting our bullish bias.
On the daily, prices are at a strong resistance level. We see the potential for a dip from our 1st resistance at 116.406 in line with 61.8% Fibonacci projection towards our 1st support at 100.008 which is also a graphical overlap. RSI is at levels where dips previously occurred, further supporting the bias of a pullback. On the H4 timeframe prices are at a strong resistance level. We see the potential for a dip from our 1st resistance at 116.347 in line with 127.2% Fibonacci projection towards our 1st support at 115.934 which is also a graphical overlap. RSI is at levels where dips previously occurred, further supporting the bias of a pullback.
Areas of consideration:
- H4 time frame, 1st resistance at 116.347
- H4 time frame, 1st support at 115.934
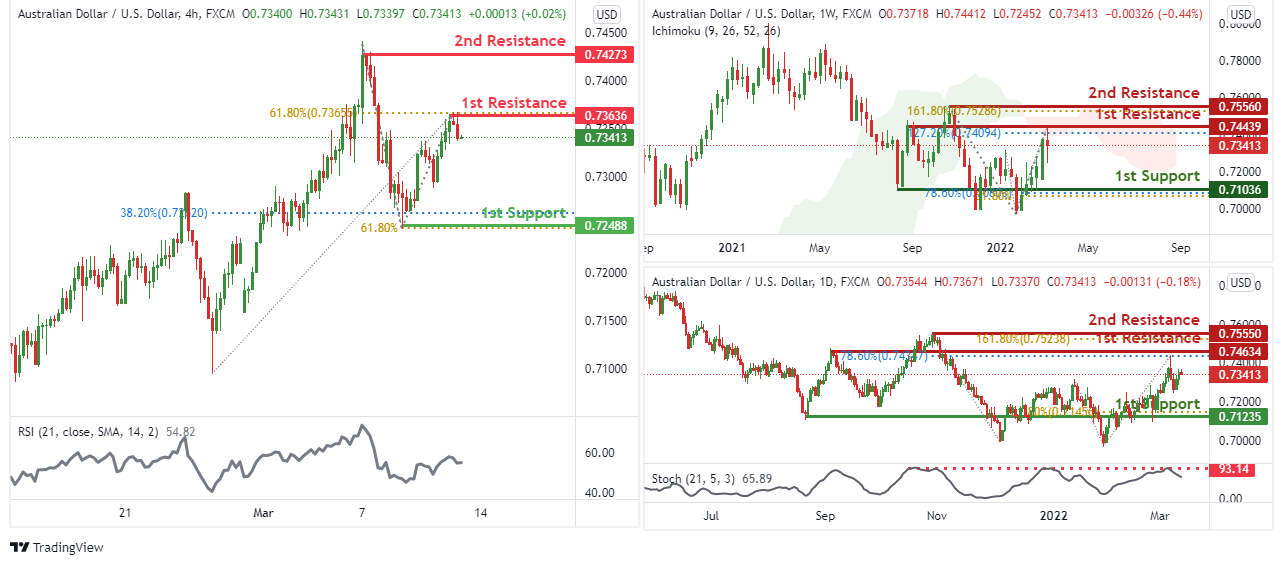
AUD/USD:
On the weekly chart, we can see that price can potentially dip from the 1st resistance level of 0.74439 which is also 127.2% Fibonacci extension. Price can move to the 1st support level of 0.71036 which is also 61.8% Fibonacci projection and 78.6% Fibonacci retracement. Our bearish bias is further supported by price trading below the Ichimoku cloud indicator.
On the daily chart, price is near the 1st resistance level of 0.73636 in line with 78.6% Fibonacci retracement. Price can potentially dip to the 1st support level of 0.71235 in line with 61.8% Fibonacci retracement. Our bearish bias is further supported by the stochastic indicator as it is near the resistance level.
On the H4 chart, price is near the 1st resistance level of 1.31763 in line with 61.8% Fibonacci retracement. Price can potentially dip to the 1st support level of 0.72488 in line with 38.2% Fibonacci retracement and 61.8% Fibonacci projection. Our bearish bias is further supported by the RSI indicator.
Areas of consideration
- H4 1st resistance at 0.73636
- H4 1st support at 0.72488
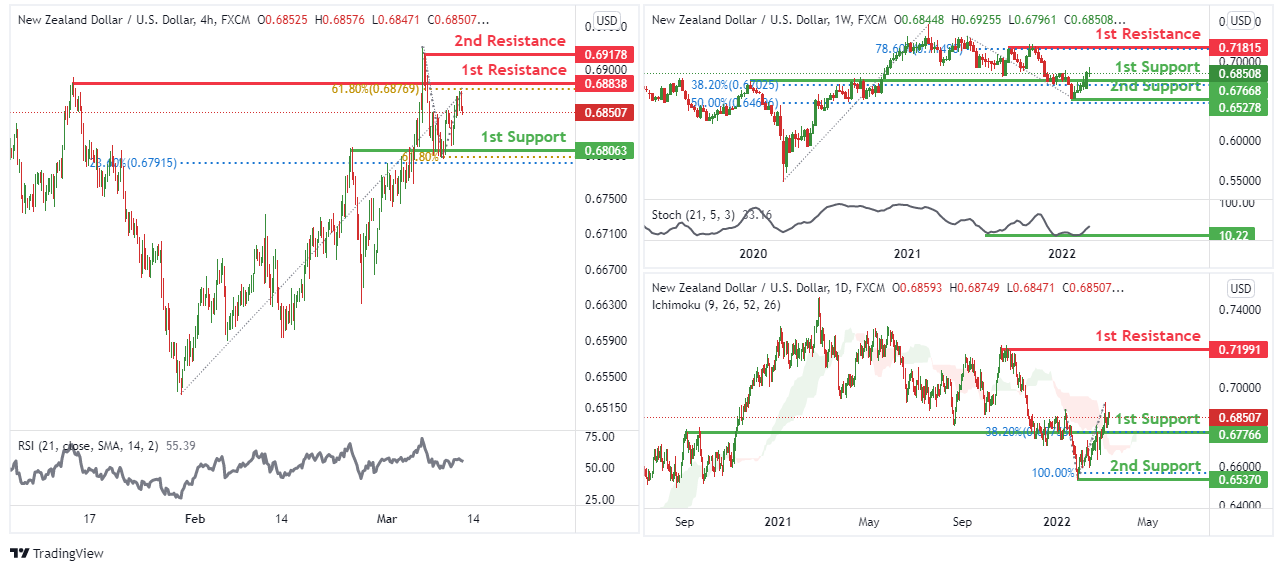
NZD/USD:
On the weekly chart , price is near 1st support level of 0.68506 in line with 38.2% Fibonacci retracement. Price can potentially move towards the 1st resistance level of 0.71815 in line with 78.6% Fibonacci retracement. Our bullish bias is supported by the stochastic indicator as it is near support level.
On the daily chart, price is at 1st support level of 0.67766 in line with 38.2% Fibonacci retracement. Price can move towards the 1st resistance level of 0.71991 which is a graphical swing high. Our bullish bias is supported by price trading above the Ichimoku cloud indicator..
On the H4 price is near 1st resistance level of 0.68838 in line with 61.8% Fibonacci retracement. Price can potentially dip to the 1st support level at 0.68063 in line with 23.6% Fibonacci retracement and 61.8% Fibonacci projection, which is also a graphical swing low. Our bearish bias is further supported by the RSI indicator.
Areas of consideration :
- H4 1st resistance at 0.68838
- H4 1st support at 0.68063
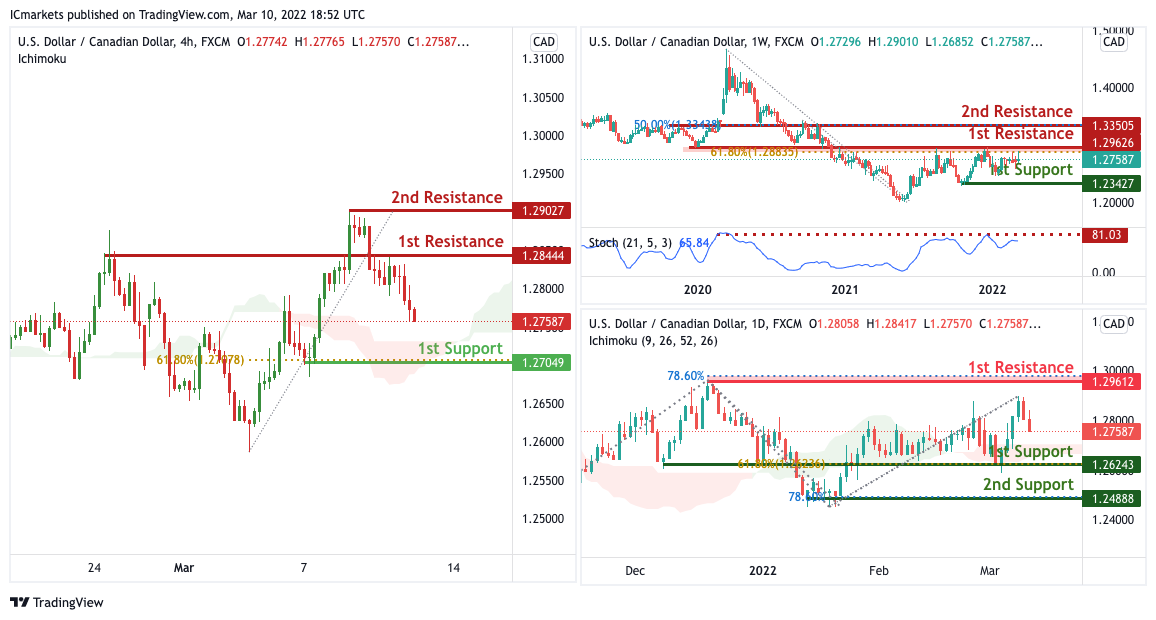
USD/CAD:
On the weekly timeframe, with price expected to reverse off the resistance of the stochastics indicator, we have a bearish bias that price will drop to our 1st support at 1.23427 in line with the horizontal swing low support from our 1st resistance of 1.29626 in line with the horizontal overlap resistance and 61.8% Fibonacci retracement. Alternatively, price may break our 1st resistance and head for 2nd resistance at 1.33505 in line with the 50% Fibonacci retracement and horizontal pullback resistance.
On the Daily timeframe, price is near 1st support level of 1.26243 in line with horizontal overlap support and 61.8% Fibonacci retracement. Price can potentially rise to the 1st resistance level of 1.29612 in line with the swing high resistance and 78.6% Fibonacci retracement. Alternatively, price may break 1st support and head for 2nd support at 1.24888 where the swing low support. Our bullish bias is supported by how price is moving above the ichimoku cloud.
On the H4 timeframe, with price expected to reverse off the resistance of the stochastics indicator, we have a bearish bias that price will drop to our 1st support at 1.27049 in line with the horizontal swing low support and 61.8% Fibonacci retracement from our 1st resistance of 1.28444 in line with the horizontal overlap resistance. Alternatively, price may break our 1st resistance and head for 2nd resistance at 1.29027in line with the horizontal swing high resistance.
Areas of consideration:
- H4 time frame, 1st support at 1.27049
- H4 time frame, 1st resistance at 1.28444
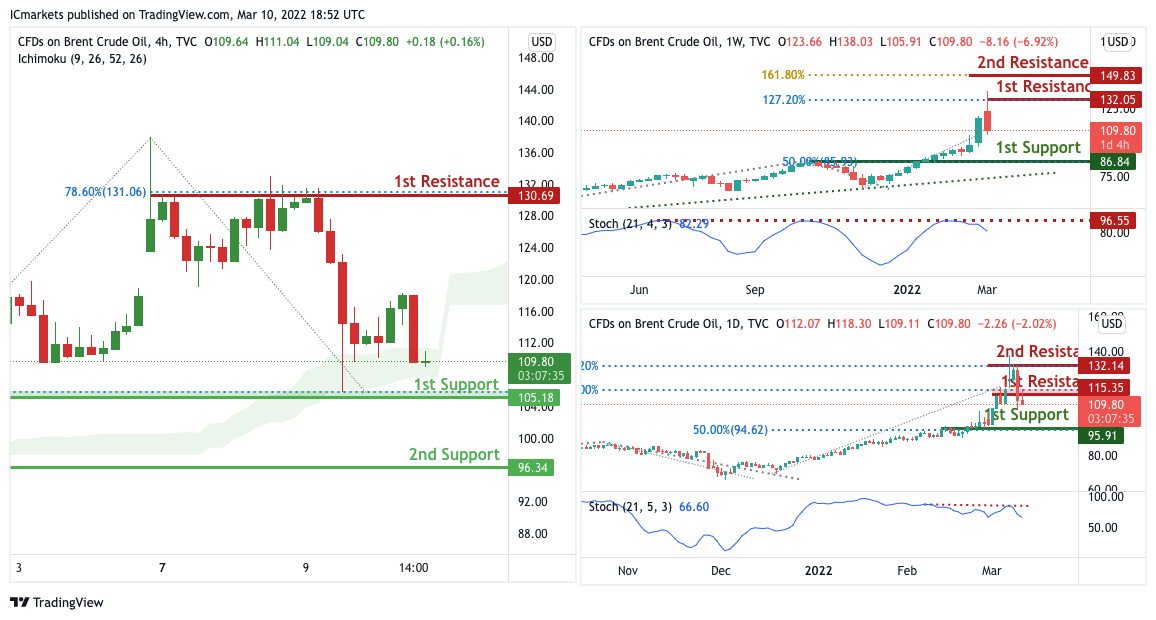
OIL:
On the weekly timeframe, with price expected to reverse off the resistance of the stochastics indicator, we have a bearish bias that price will drop to our 1st support at 86.84 in line with the 50% Fibonacci retracement from our 1st resistance of 132.05 in line with the 127.2% Fibonacci extension. Alternatively, price may break our 1st resistance and head for 2nd resistance at 149.83 in line with the 161.8% Fibonacci extension.
On the Daily timeframe, with price expected to reverse off the resistance of the stochastics indicator, we have a bearish bias that price will drop to our 1st support at 95.91 in line with the 50% Fibonacci retracement from our 1st resistance of 115.35 in line with the 100% Fibonacci projection. Alternatively, price may break our 1st resistance and head for 2nd resistance at 132.14 in line with the 127.2% Fibonacci extension..
On the H4 timeframe, price is near 1st support level of 105.18 in line with horizontal overlap support and 78.6% Fibonacci retracement. Price can potentially rise to the 1st resistance level of 130.69 in line with the swing high resistance and 78.6% Fibonacci retracement. Alternatively, price may break 1st support and head for 2nd support at 96.34 where the swing low support. Our bullish bias is supported by how price is moving above the ichimoku cloud.
Areas of consideration:
- H4 time frame, 1st resistance of 130.69
- H4 time frame, 1st support of 105.18
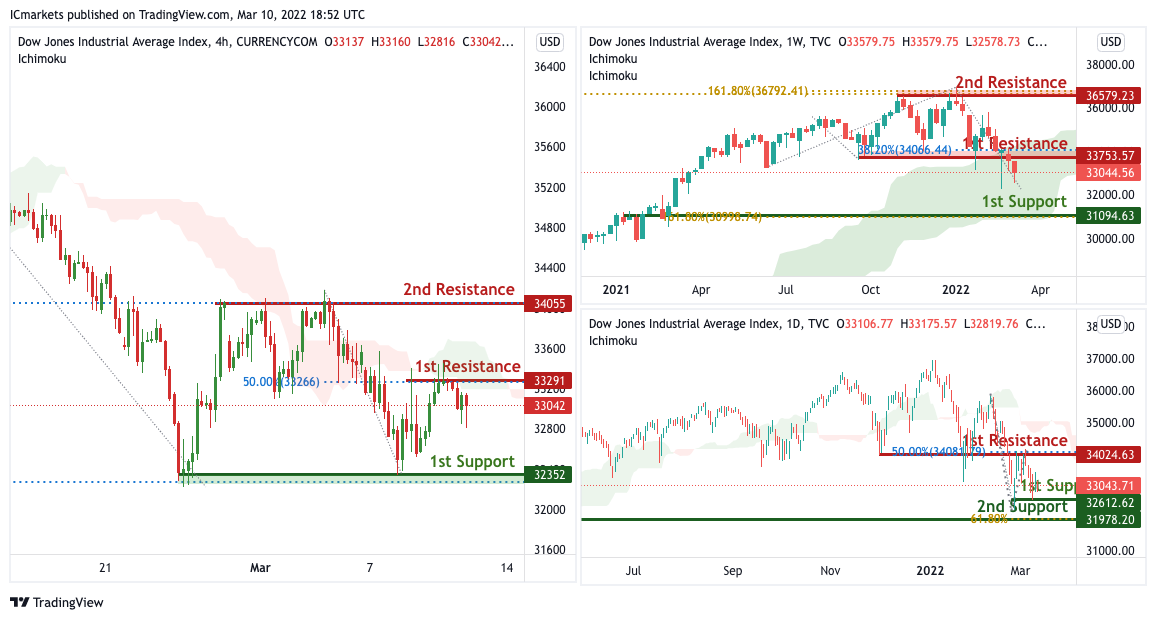
Dow Jones Industrial Average:
On the Weekly timeframe, we have a bearish bias that price will drop from 1st resistance at 33753 in line with the 38.2% Fibonacci retracement to 1st support at 31094 in line with 61.8% Fibonacci retracement.Alternatively, price may break pivot structure and head for 2nd support at 36579 in line with the 161.8% Fibonacci projection. Our bearish bias is supported by how price has recently broken the 1st support of the ichimoku cloud and is expected to bounce off the second support.
On the Daily timeframe, price is near 1st support level of 32612 in line with horizontal swing low support. Price can potentially rise to the 1st resistance level of 34024 in line with the 50% Fibonacci retracement. Alternatively, price may break 1st support and head for 2nd support at 31978 where the 61.8% Fibonacci retracement. Our bullish bias is supported by how price is moving above the ichimoku cloud.
On the H4 timeframe, with price at the resistance of the ichimoku cloud, we have a bearish bias that price will drop from 1st resistance at 33291 in line with the 50% Fibonacci retracement to 1st support at 32352 in line with the swing low support and 127.2% Fibonacci extension .Alternatively, price may break pivot structure and head for 2nd support at 34055 in line with the 50% Fibonacci retracement. Our bearish bias is supported by how price is moving below the ichimoku cloud.
Areas of consideration :
- H4 1st support at 32352
- H4 1st resistance at 33291


