
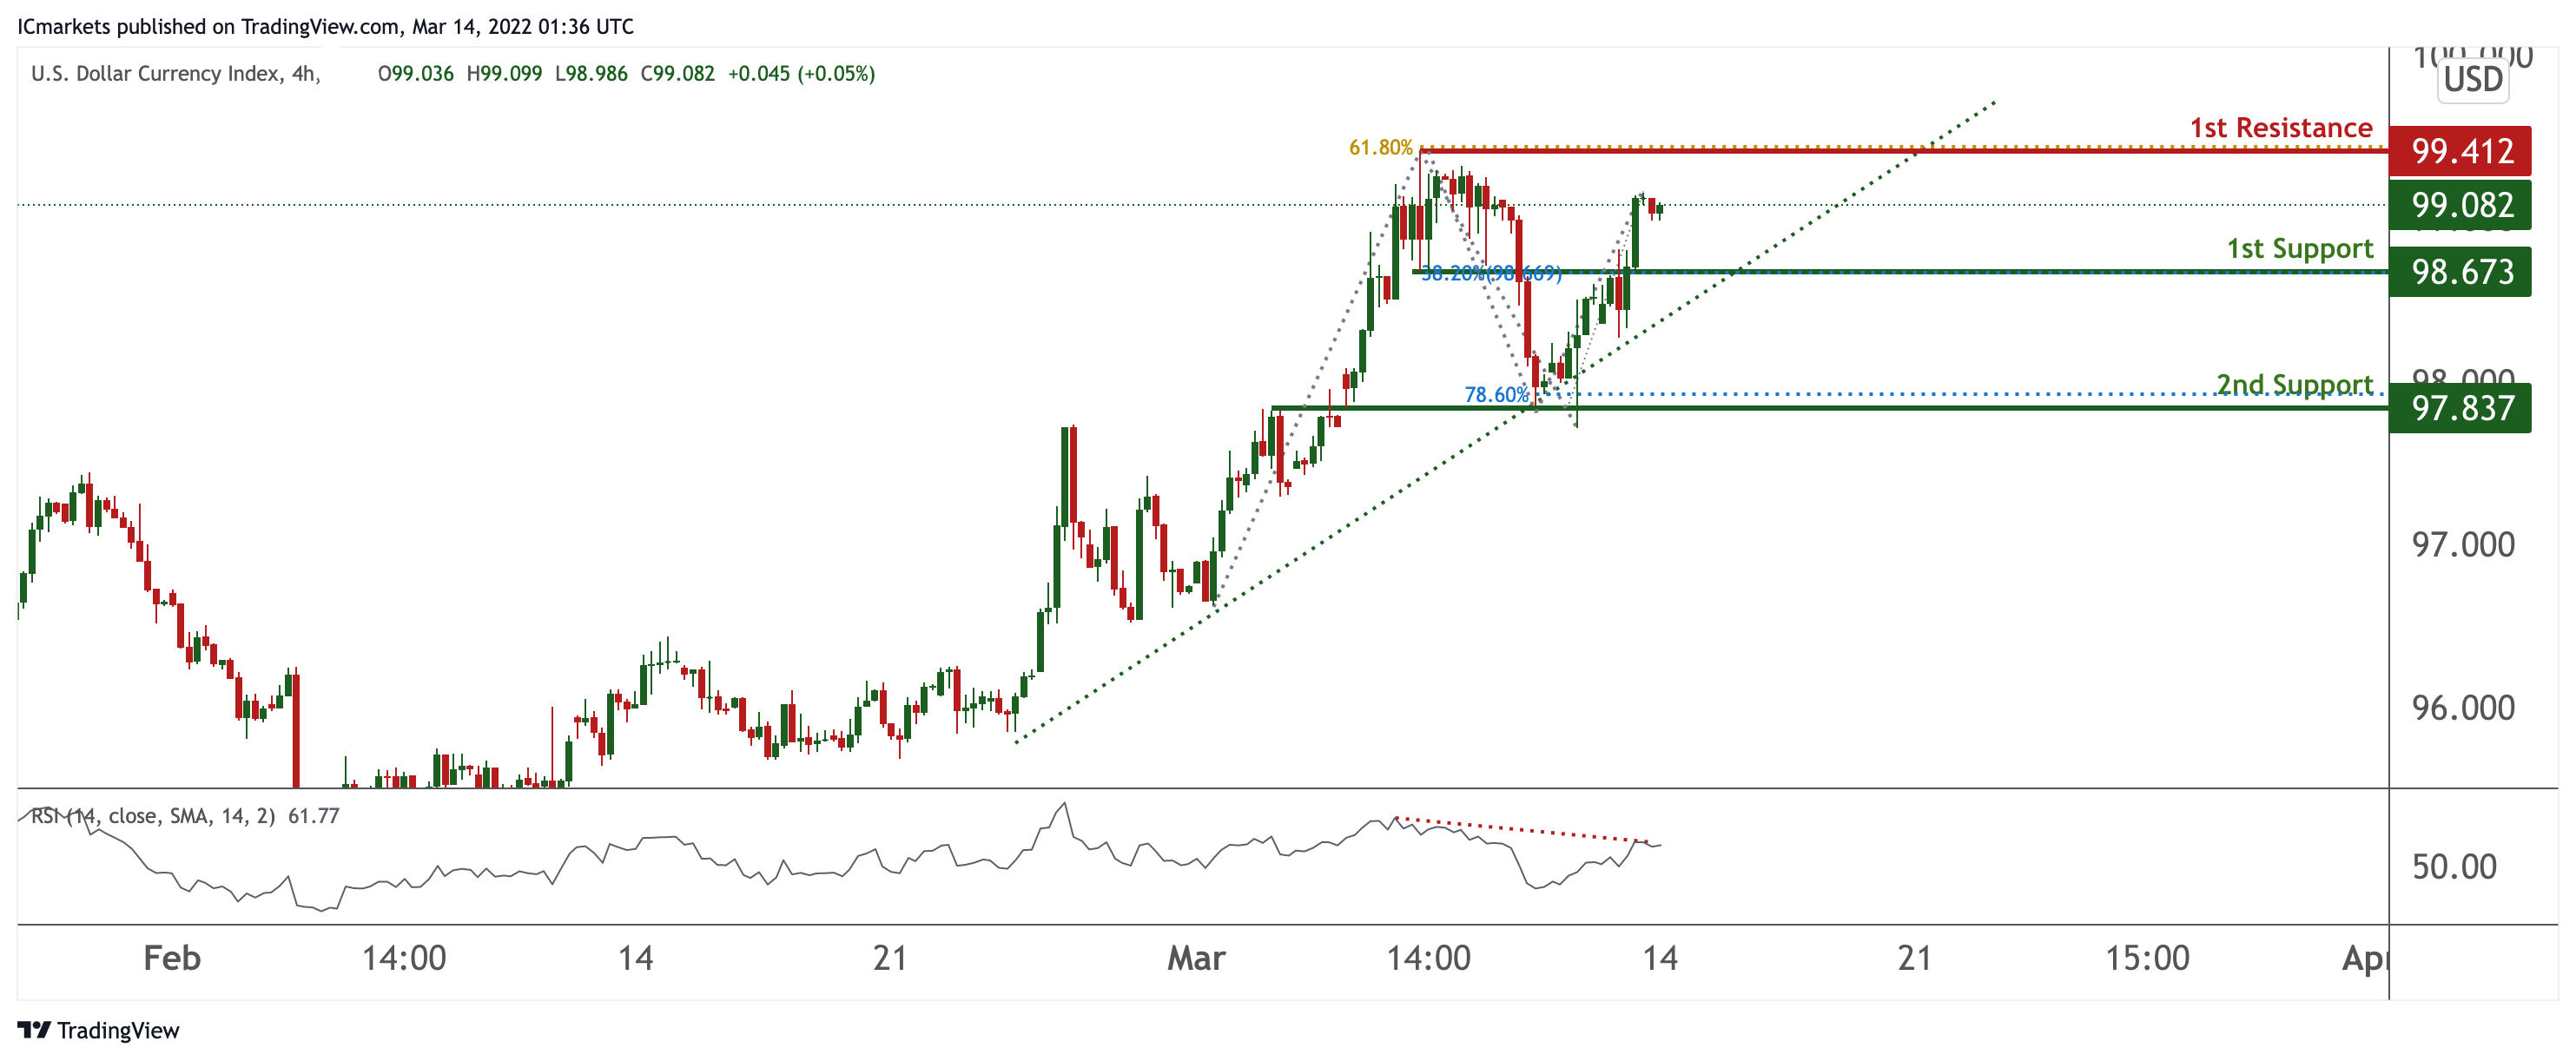
DXY:
On the H4 timeframe, prices are on bullish momentum and abiding to our ascending trendline support. We see the potential for a short pullback from our 1st resistance at 99.412 in line with 61.8% Fibonacci projection towards our 1st support at 98.673 in line with 38.2% Fibonacci retracement. RSI is on bearish momentum, further supporting our bias.
Areas of consideration:
- H4 time frame, 1st resistance at 99.412
- H4 time frame, 1st support at 98.673
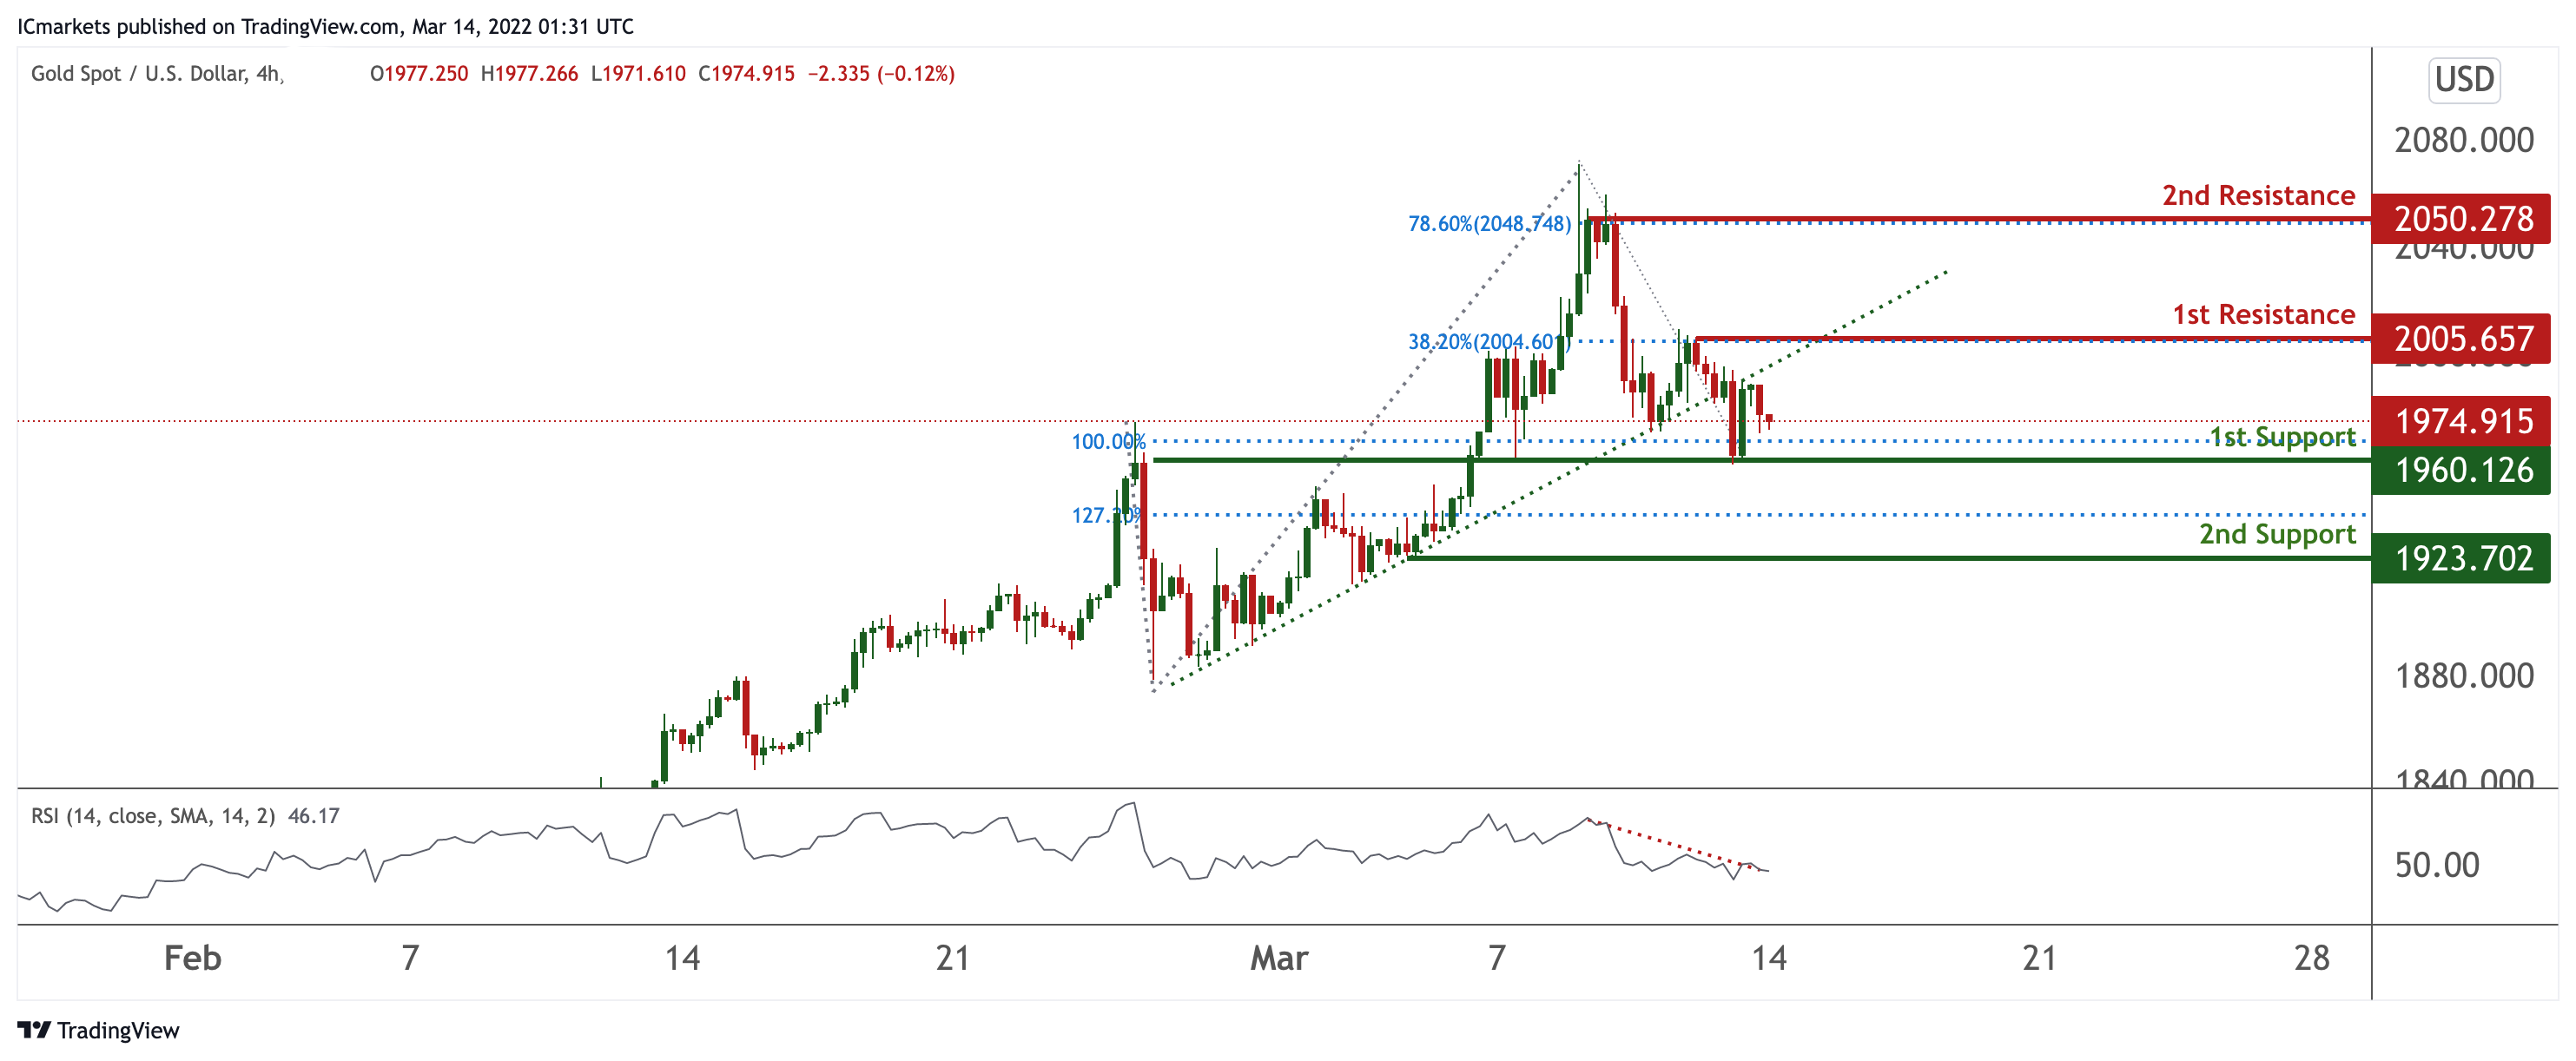
XAU/USD (GOLD):
On the H4, prices have recently broken out of our ascending trendline support. We see the potential for further bearish continuation from our 1st resistance at 2005.657 in line with 38.2% Fibonacci retracement towards our 1st support at 1960.126 in line with 100% Fibonacci projection. Ichimoku is on bearish momentum, further supporting our bias.
Areas of consideration:
- 4h 1st support at 1960.126
- 4h 1st resistance at 2005.657
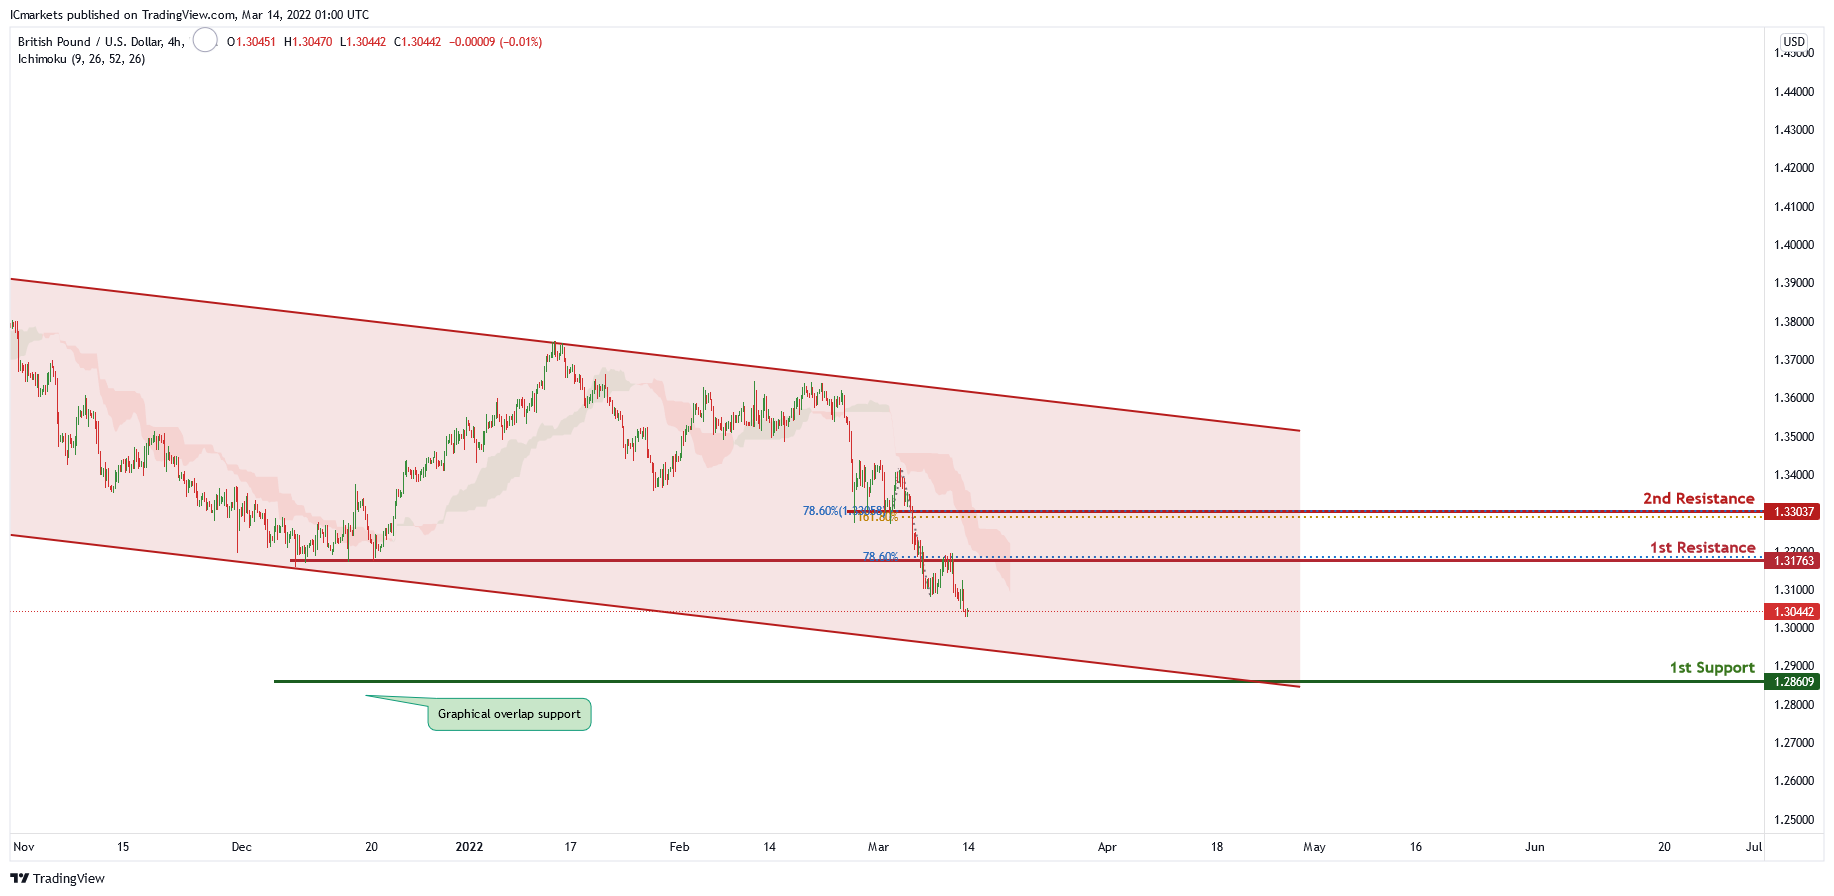
GBP/USD
On the H4 chart price is trading in a descending channel and has recently broken the 1st resistance level of 1.31763 in line with 78.6% Fibonacci retracement. Price can potentially dip to the 1st support level of 1.28652 in line which is also the graphical overlap support. Our bearish bias is supported by the ichimoku cloud indicator as price is trading under it.
Areas of consideration
- H4 1st resistance at 1.31763
- H4 1st support at 1.28652
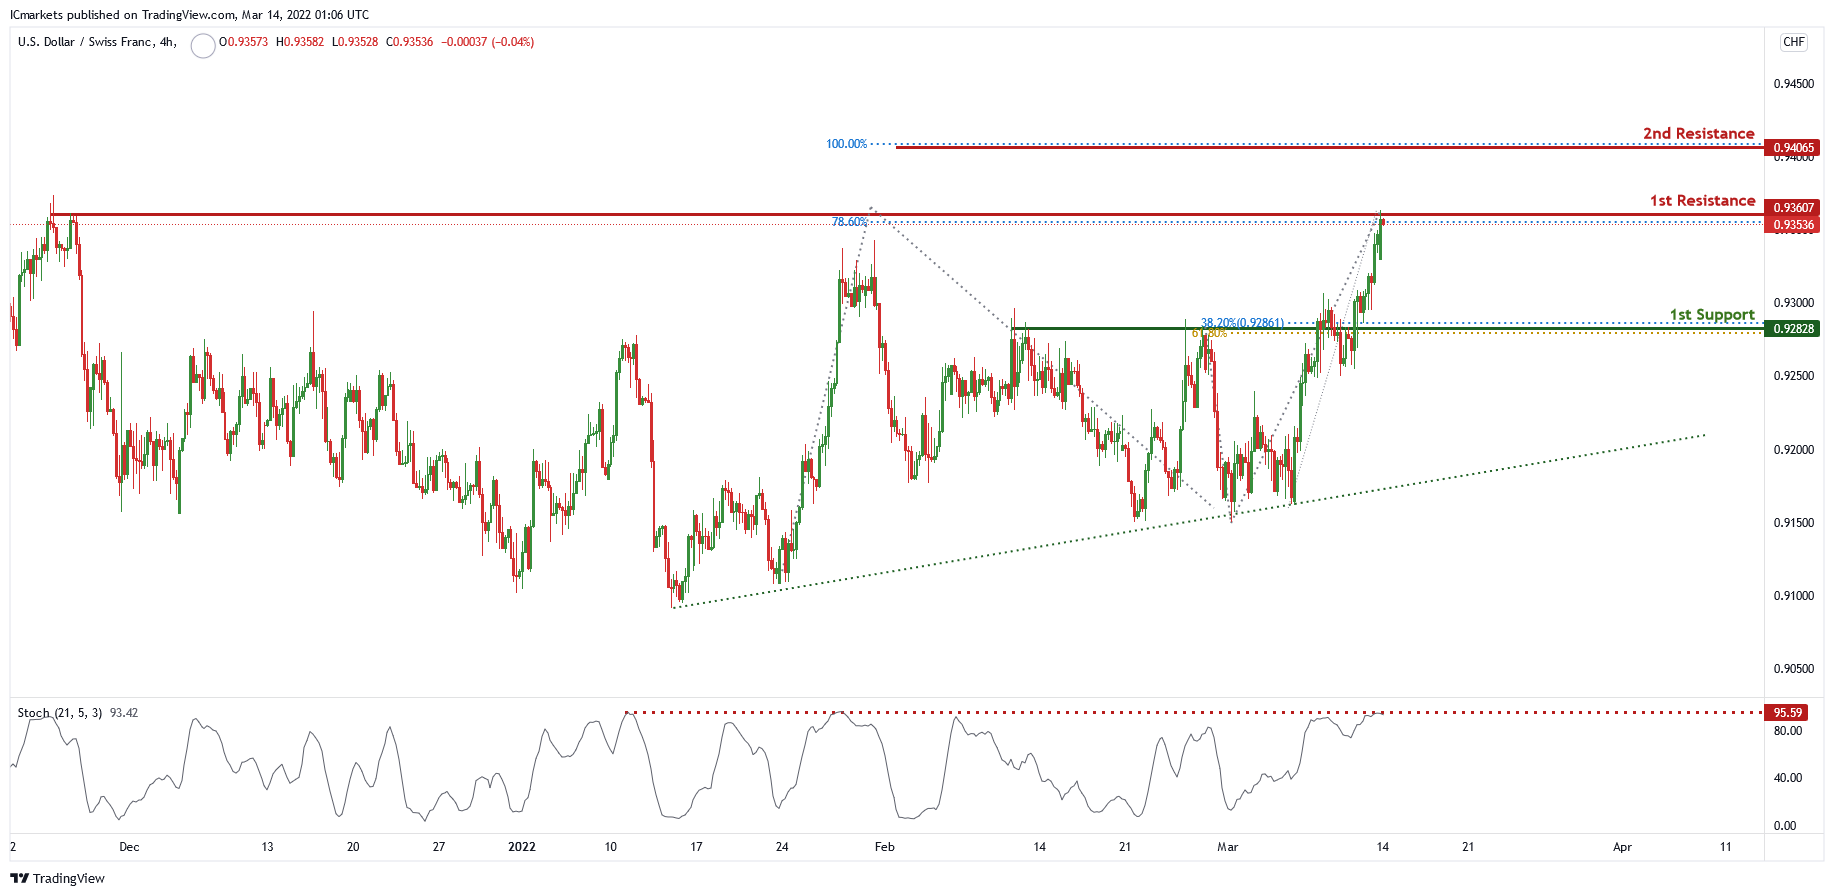
USD/CHF:
On the H4, price is abiding by an ascending trendline and near 1st resistance level of 0.93607 in line with 78.6% Fibonacci projection. Price can potentially dip to the 1st support level of 0.92828 in line with 38.2% Fibonacci retracement and 61.8% Fibonacci projection. Our bearish bias is further supported by the stochastic indicator as it is at resistance level.
Areas of consideration
- 1st support level 0.92828
- 1st resistance 0.93607
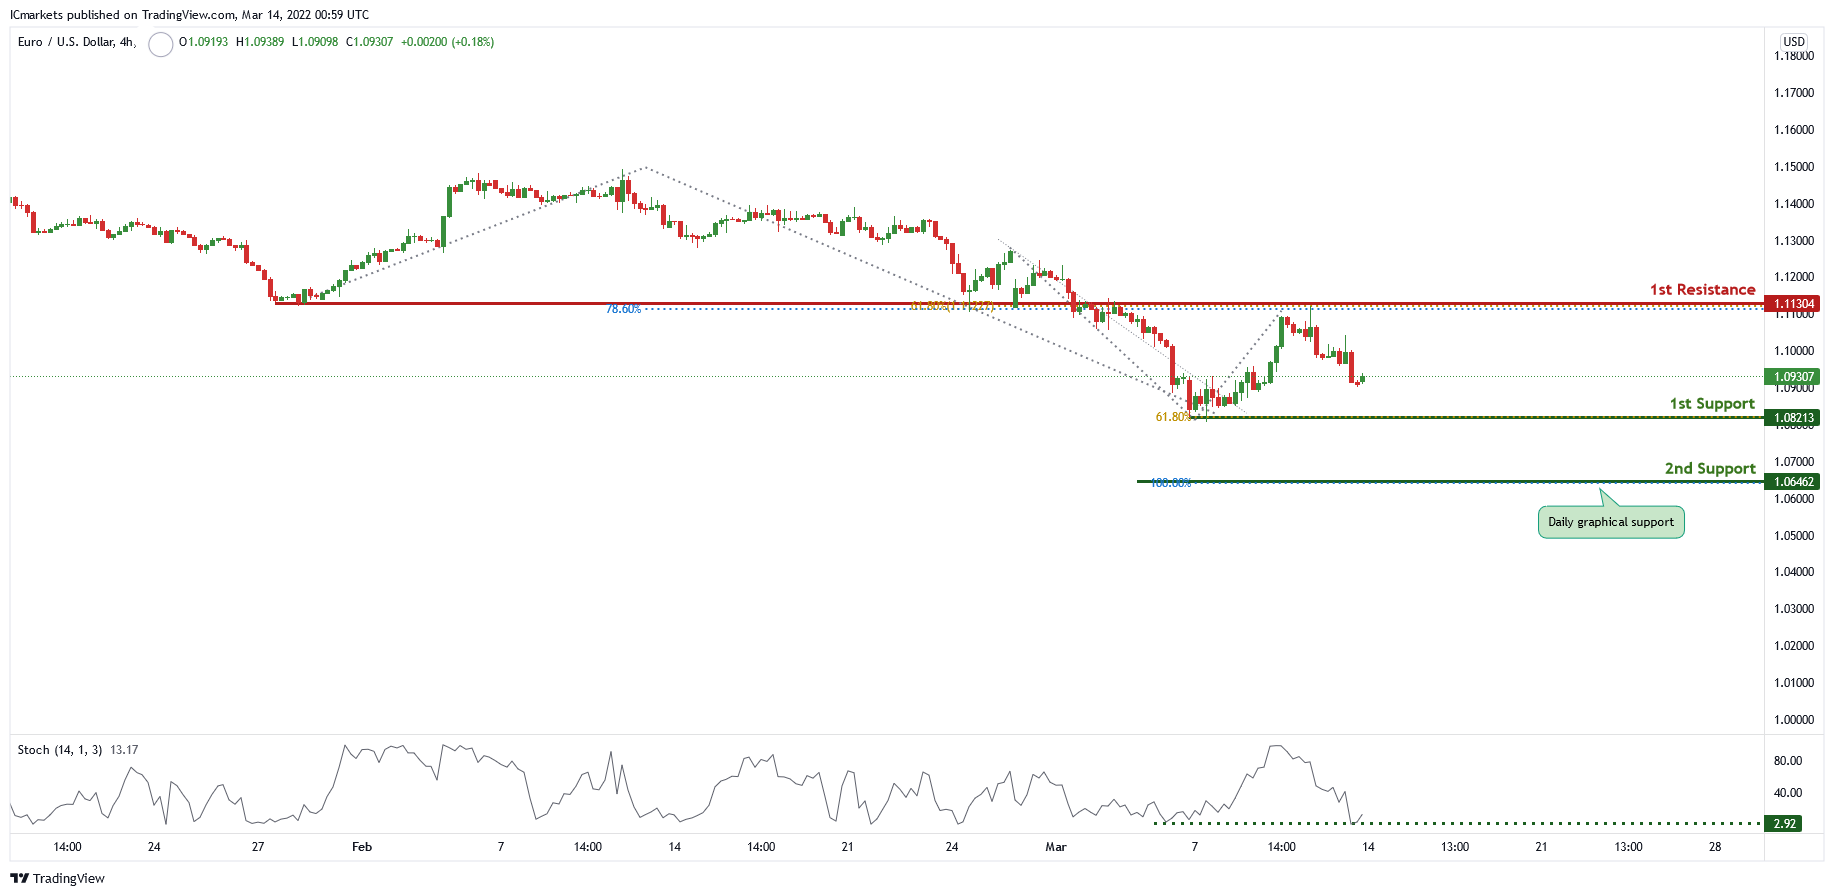
EUR/USD :
On the H4 price is near 1st resistance level of 1.11304 in line with 78.6% Fibonacci projection and 61.8% Fibonacci retracement. Price can potentially dip to the 1st support level which is the graphical swing low and 61.8% Fibonacci projection. Our bearish bias is supported by the stochastic indicator as it is the graphical swing low and 61.8% Fibonacci projection
Areas of consideration :
- H4 1st resistance at 1.11304
- H4 1st support at 1.08213
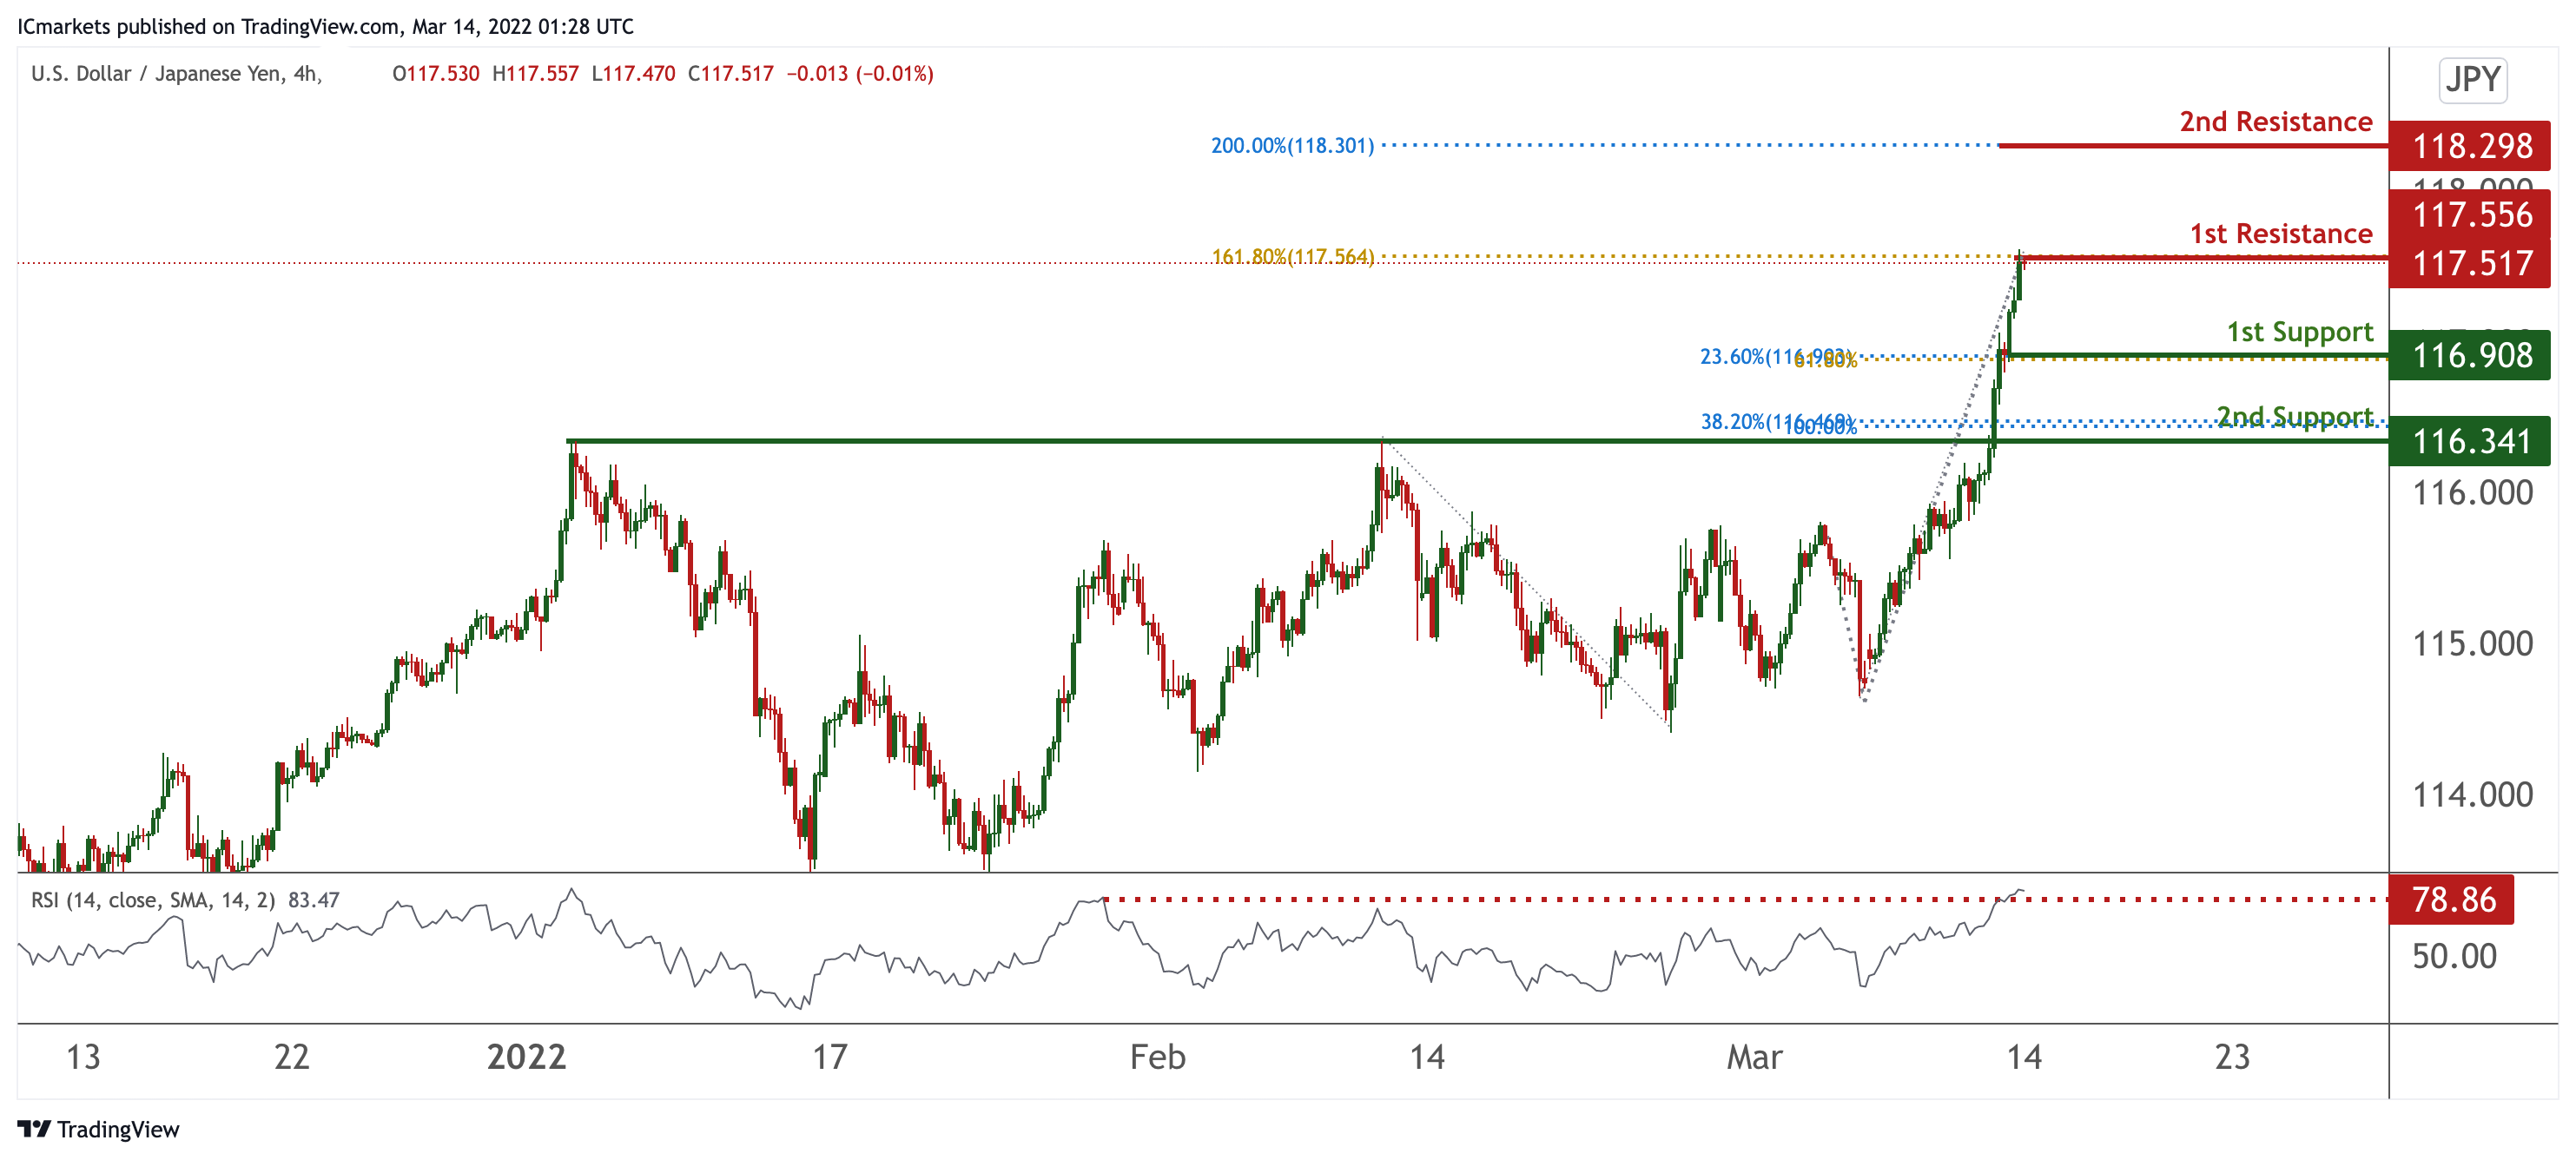
USD/JPY:
On the H4 timeframe prices are at a strong weekly resistance. We see the potential for a dip from our 1st resistance at 117.517 in line with 161.8% Fibonacci projection towards our 1st support at 116.908 in line with 23.6% Fibonacci retracement and 61.8% Fibonacci retracement. RSI is at levels where dips previously occurred, further supporting our bias of a pullback.
Areas of consideration:
- H4 time frame, 1st resistance at 117.517
- H4 time frame, 1st support at 116.908
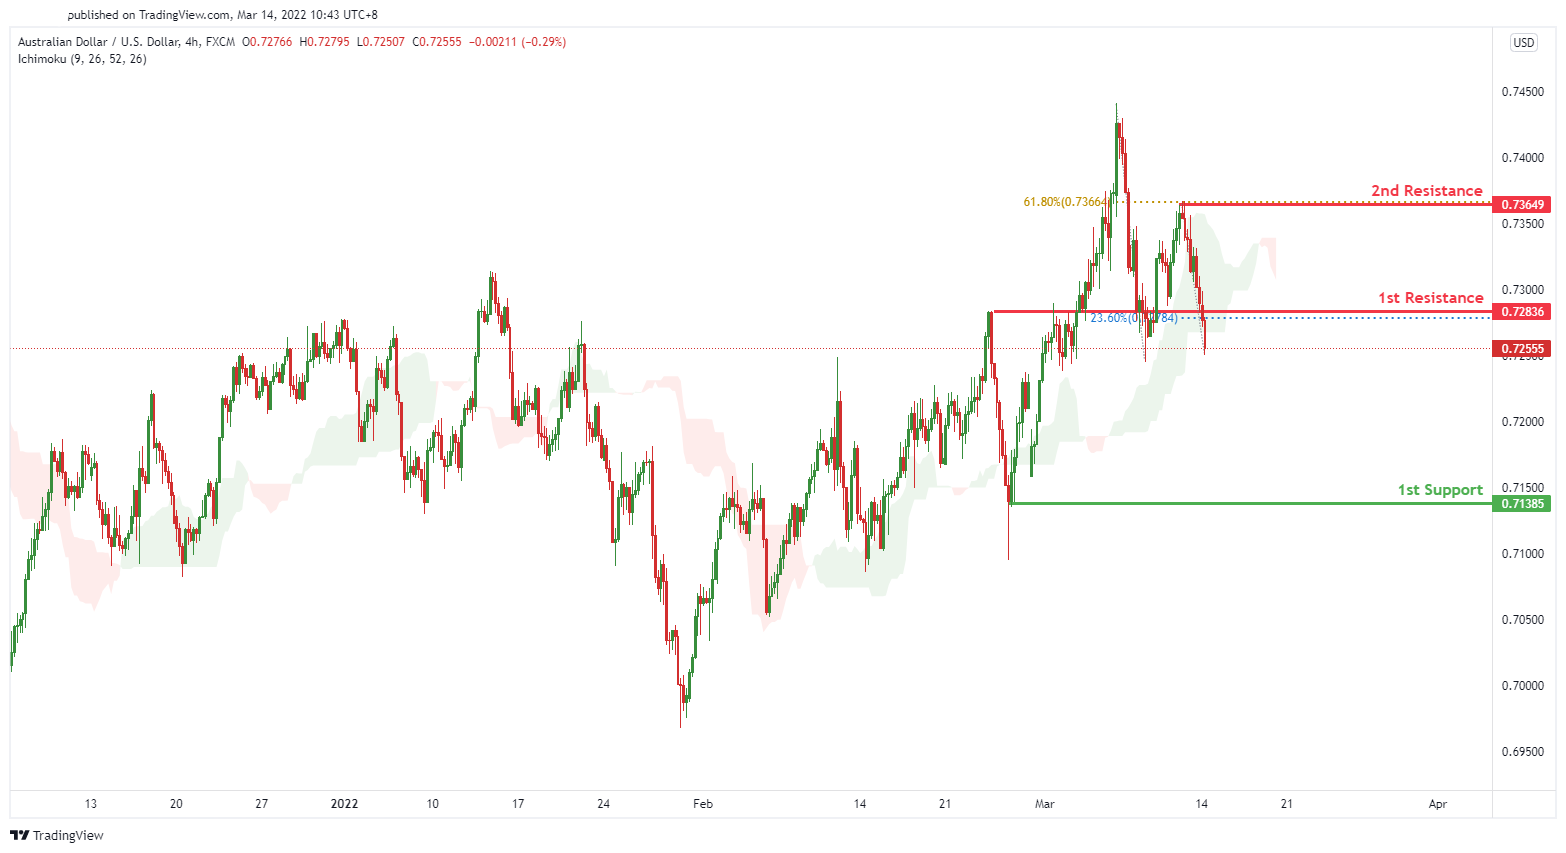
AUD/USD:
On the H4 chart, price is near the 1st resistance level of 0.72933 in line with 50% Fibonacci retracement and 100% Fibonacci projection. Price can potentially dip to the 1st support level of 0.69737 with a graphical swing low. Our bearish bias is further supported by the stochastic indicator whereby it is at support level.
Areas of consideration
- H4 1st resistance at 0.72933
- H4 1st support at 0.69737
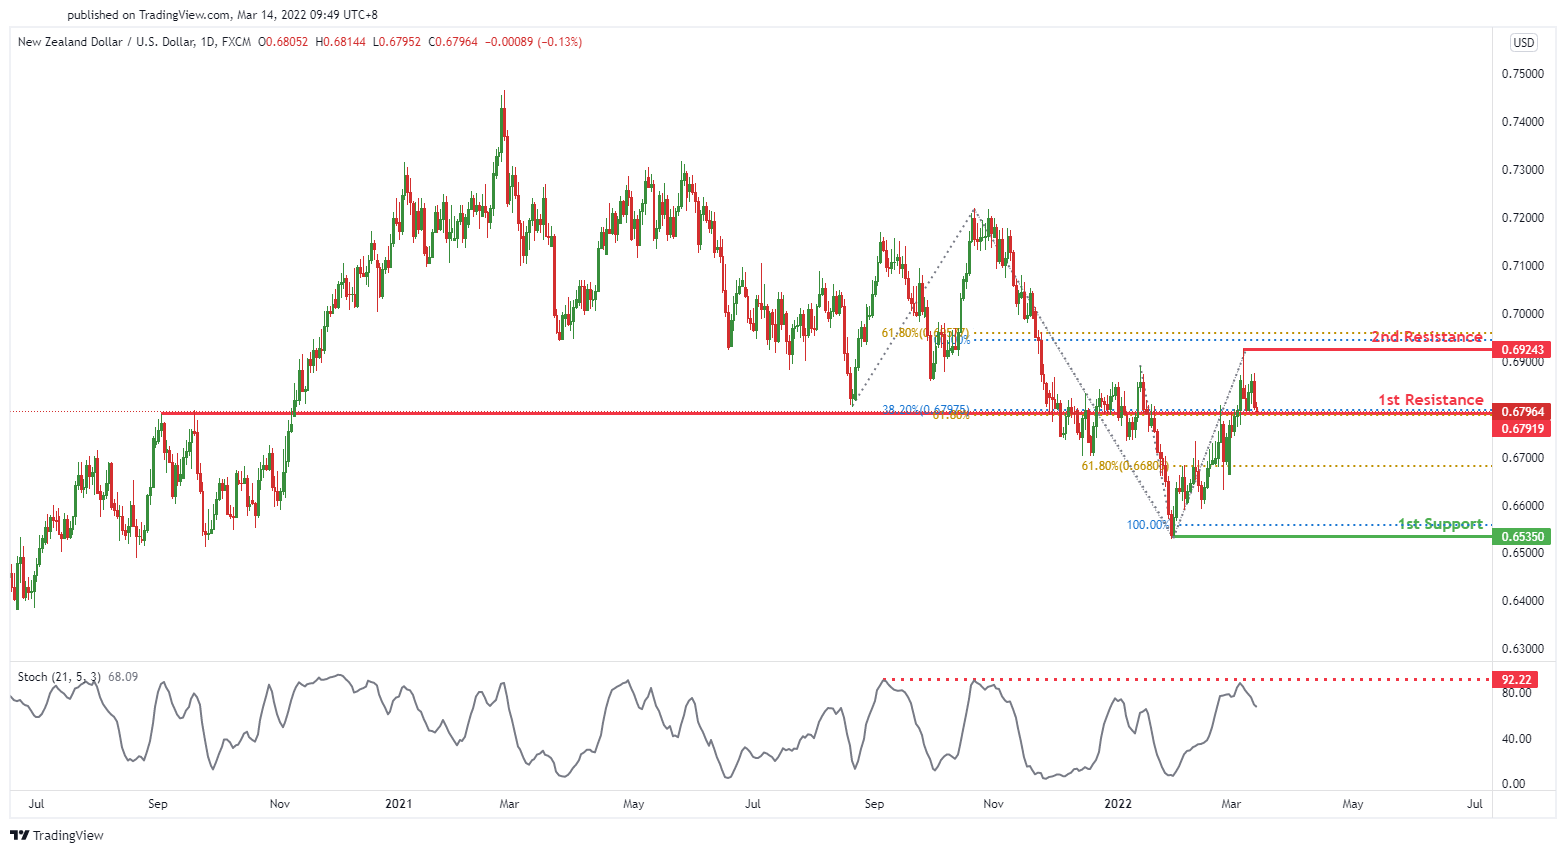
NZD/USD:
On the H4 price is near 1st resistance level of 0.67919 in line with 38.2% Fibonacci retracement. Price can potentially dip to the 1st support level at 0.65350 in line with 100% Fibonacci projection, which is also a graphical swing low. Our bearish bias is further supported by the RSI indicator as it is at resistance level.
Areas of consideration :
- H4 1st resistance at 0.67919
- H4 1st support at 0.65350
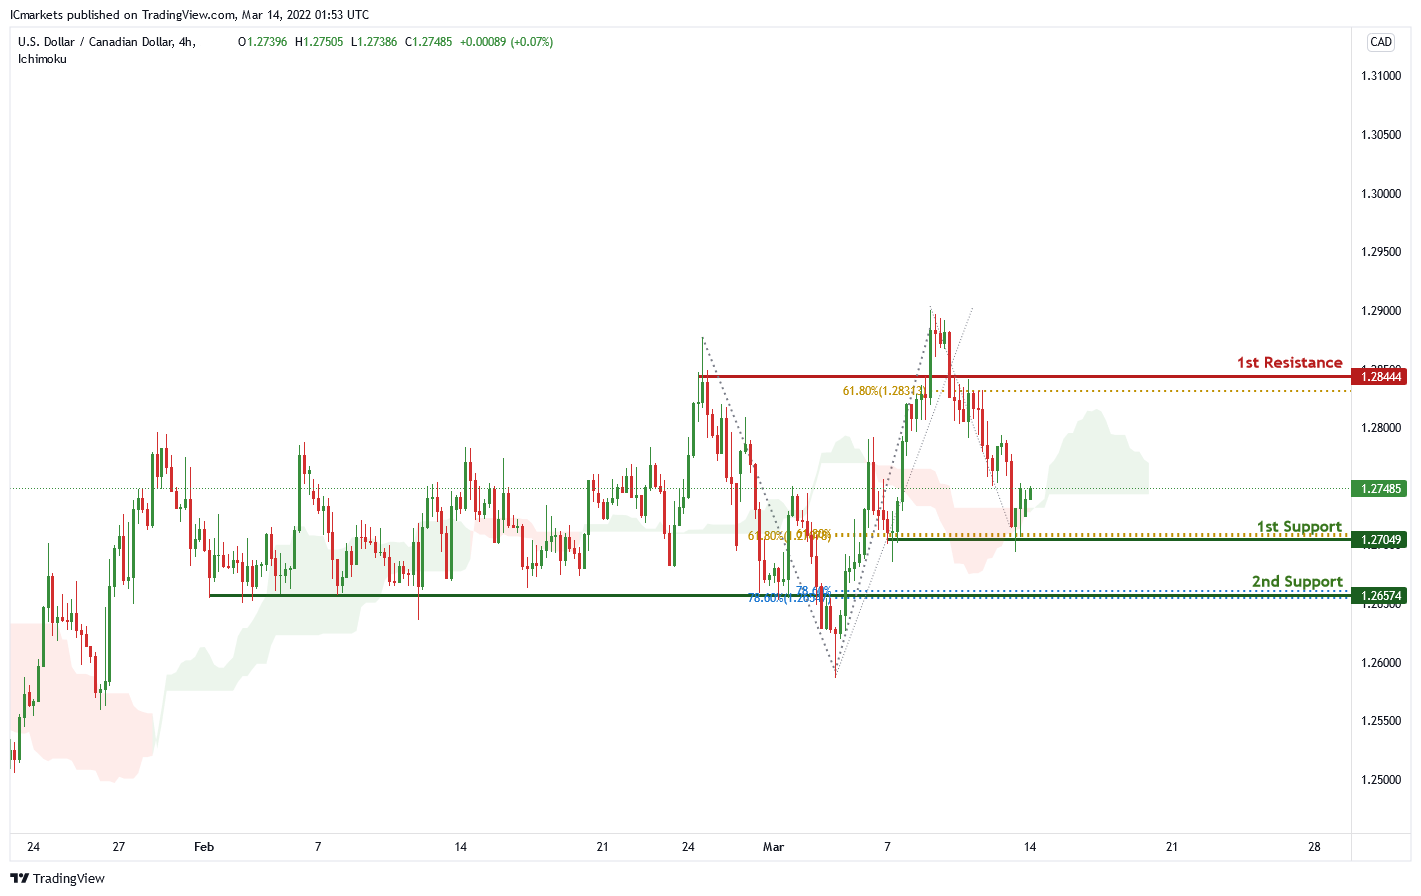
USD/CAD:
On the H4 chart , price is near 1st support level of 1.27049 in line with 61.8% Fibonacci retracement and 61.8% Fibonacci projection. Price can potentially go to the 1st resistance level of 1.2844 in line with 61.8% Fibonacci projection. Our bullish bias is supported by the ichimoku cloud indicator.
Areas of consideration:
- H4 time frame, 1st support at 1.27049
- H4 time frame, 1st resistance at 1.28444
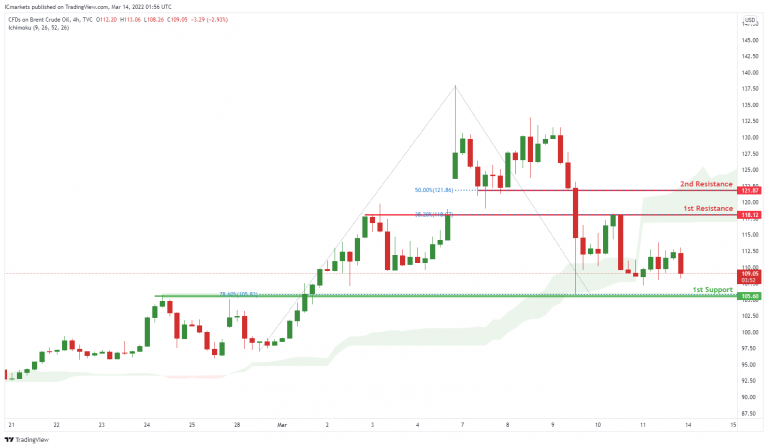
OIL:
On the H4, with price moving below the ichimoku cloud, we have a bias that price will drop from 1st resistance at 118.12 in line with the 38.2% Fibonacci retracement to 1st support at 105.60 in line with the swing low support .Alternatively, price may break pivot structure and head for 2nd support at 121.87 in line with the 50% Fibonacci retracement.
Areas of consideration:
- H4 time frame, 1st resistance of 118.12
- H4 time frame, 1st support of 105.60
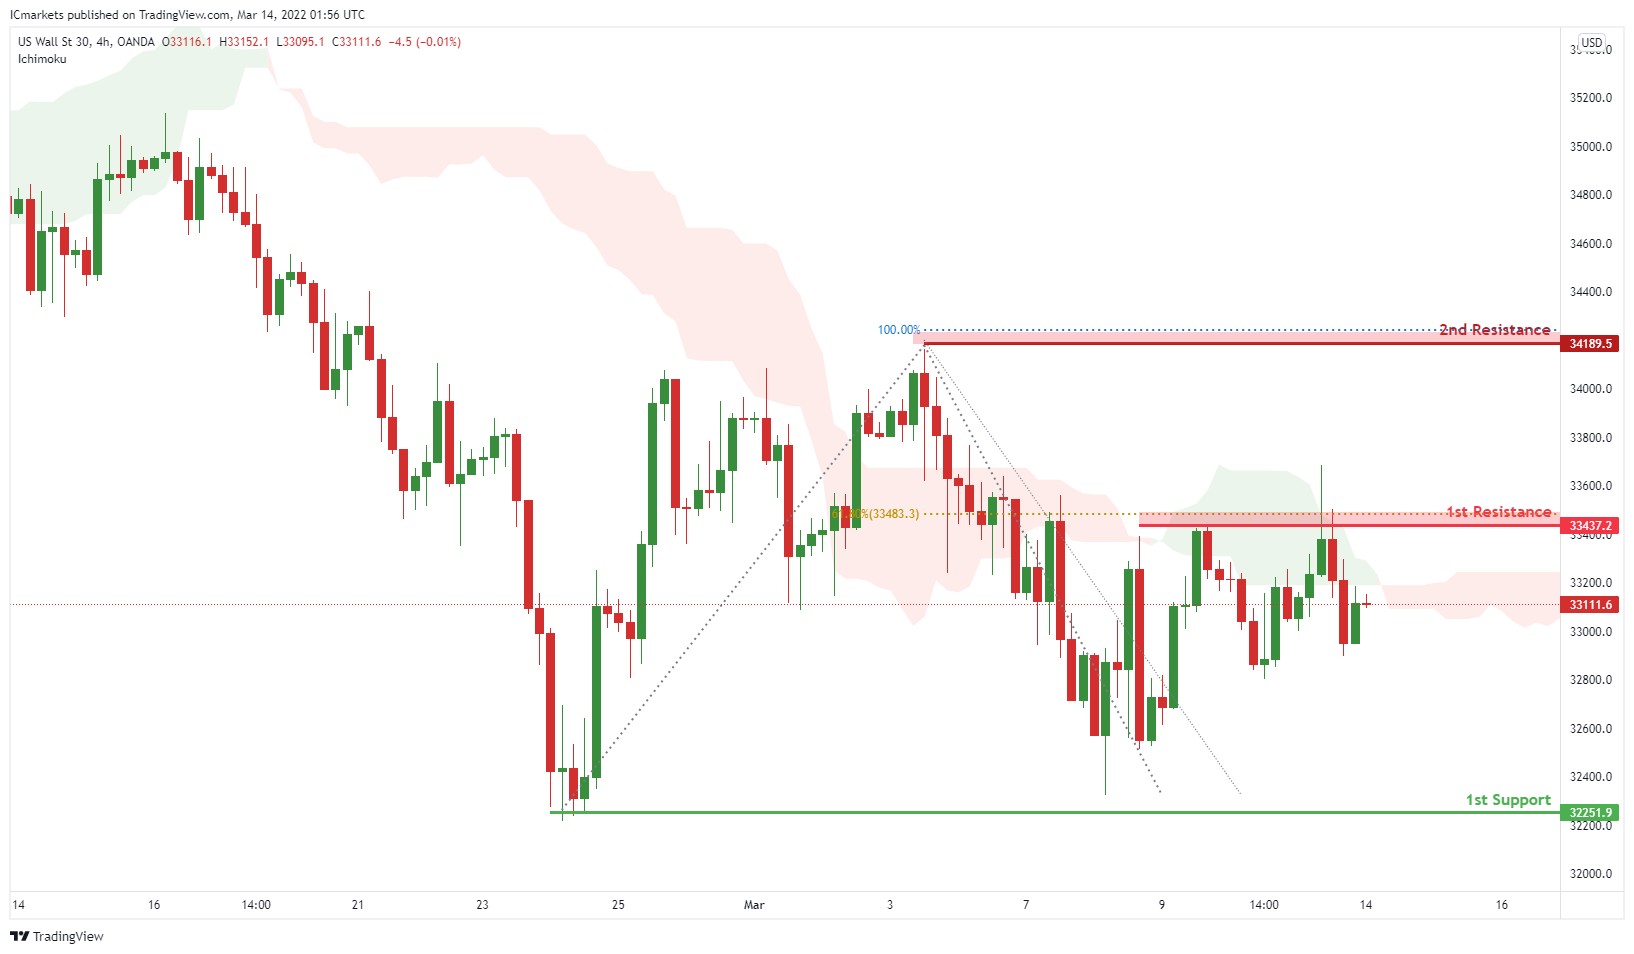
Dow Jones Industrial Average:
On the H4, with price moving below the ichimoku cloud, we have a bias that price will drop from 1st resistance at 33437 in line with the 61.8% Fibonacci retracement to 1st support at 32251 in line with the swing low support .Alternatively, price may break pivot structure and head for 2nd support at 34189 in line with the 100% Fibonacci projection.
Areas of consideration :
- H4 1st support at 32251
- H4 1st resistance at 33437


