
DXY:
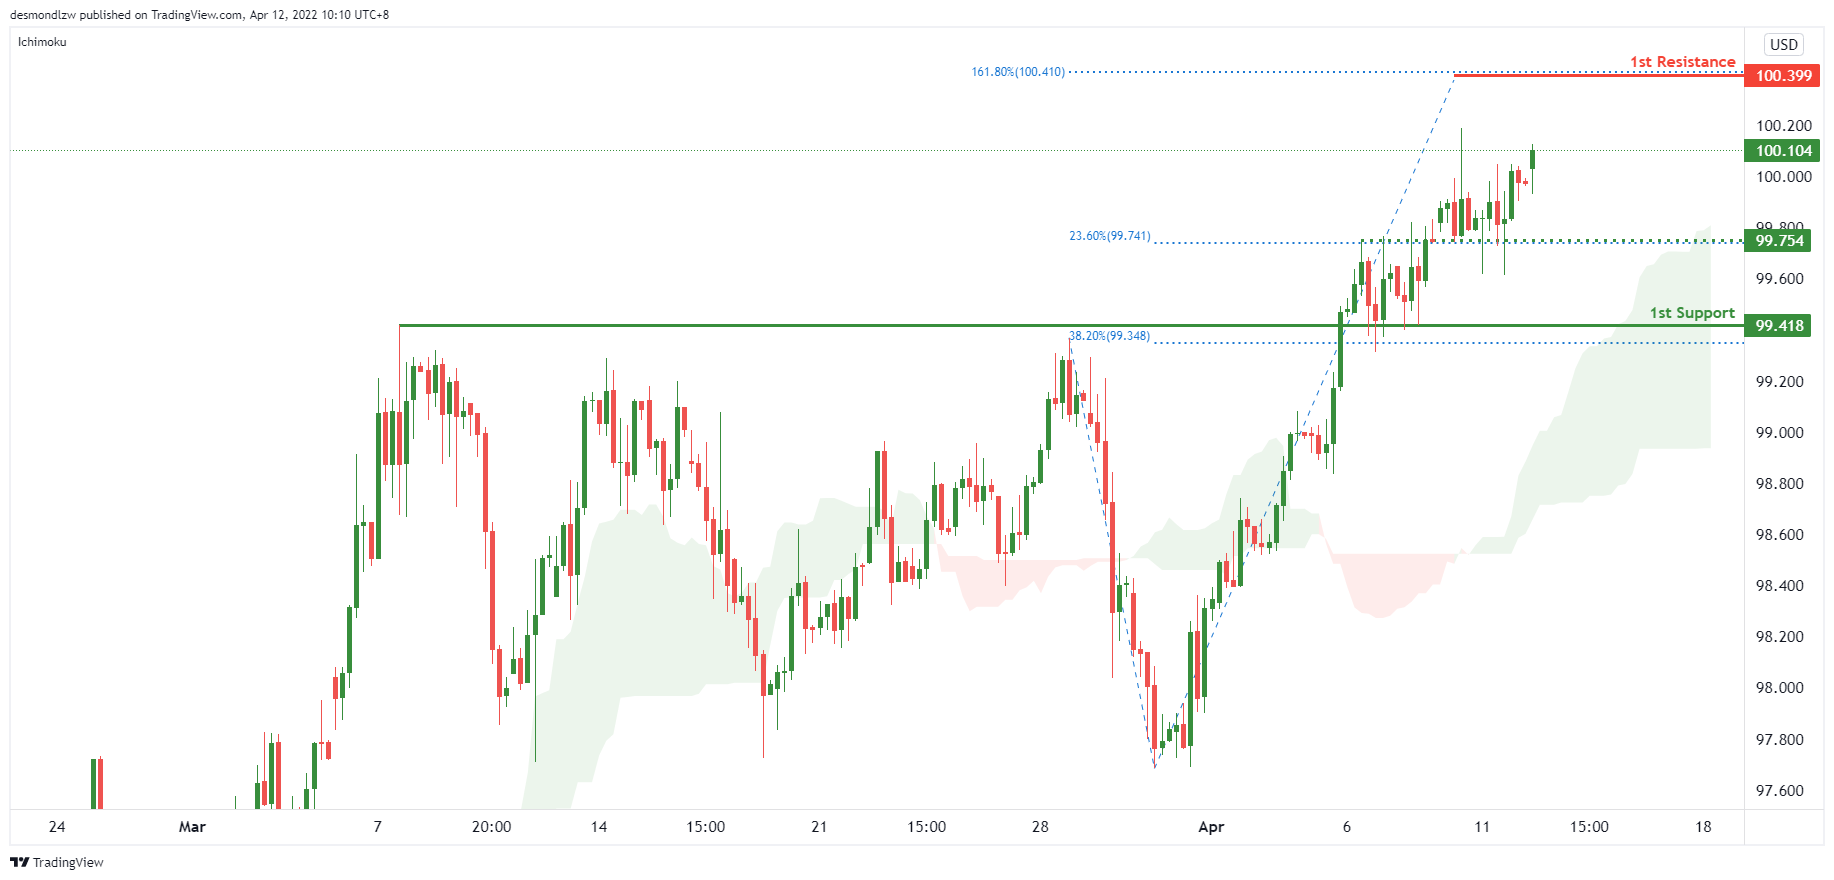
On the H4 timeframe, prices are consolidating on an intermediate support. We see the potential for a bounce from our intermediate support at 99.754 in line 23.6% Fibonacci retracement towards our 1st resistance at 100.399 in line with 161.8% Fibonacci projection. Prices are trading above our ichimoku cloud support, further supporting our bullish bias.
Areas of consideration:
- H4 time frame, 1st resistance at 100.399
- H4 time frame, 1st support at 99.754
XAU/USD (GOLD):
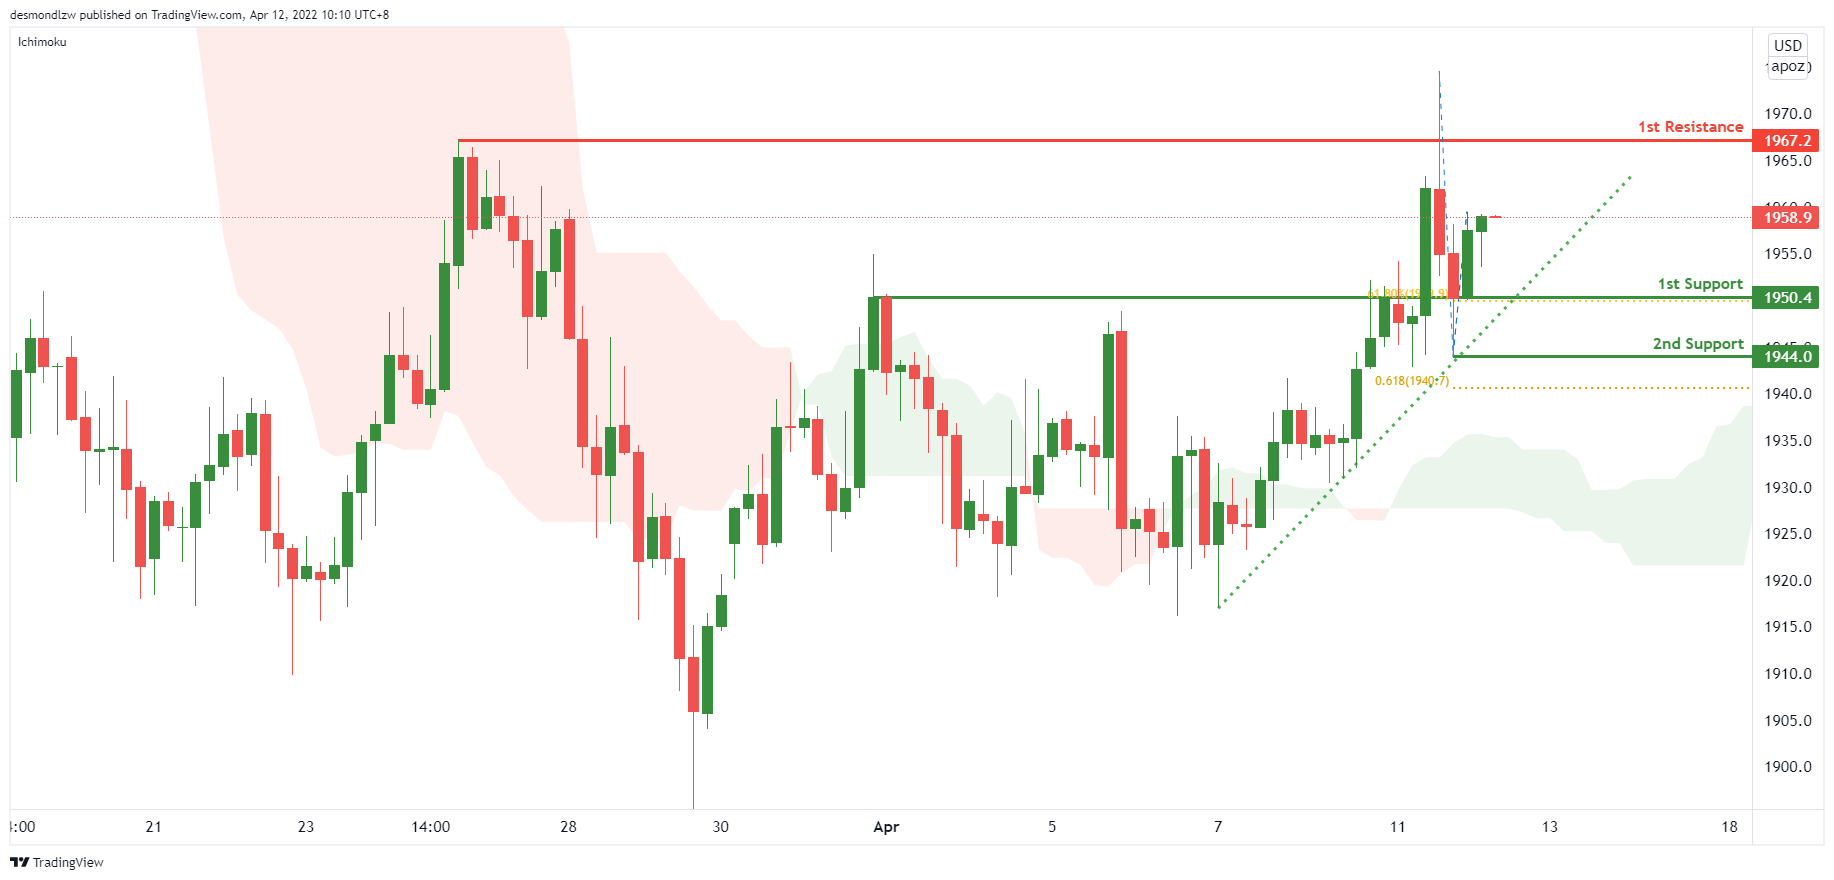
On the H4, prices are on bullish momentum and abiding by our ascending trendline. We see the potential for a bounce from our 1st support at 1950.4 in line with 61.8% Fibonacci retracement towards our 1st resistance at 1967.2 which is a graphical swing high. Prices are trading above our ichimoku cloud support, further supporting our bullish bias.
Areas of consideration:
- 4h 1st support at 1950.4
- 4h 1st resistance at 1967.2
GBP/USD:
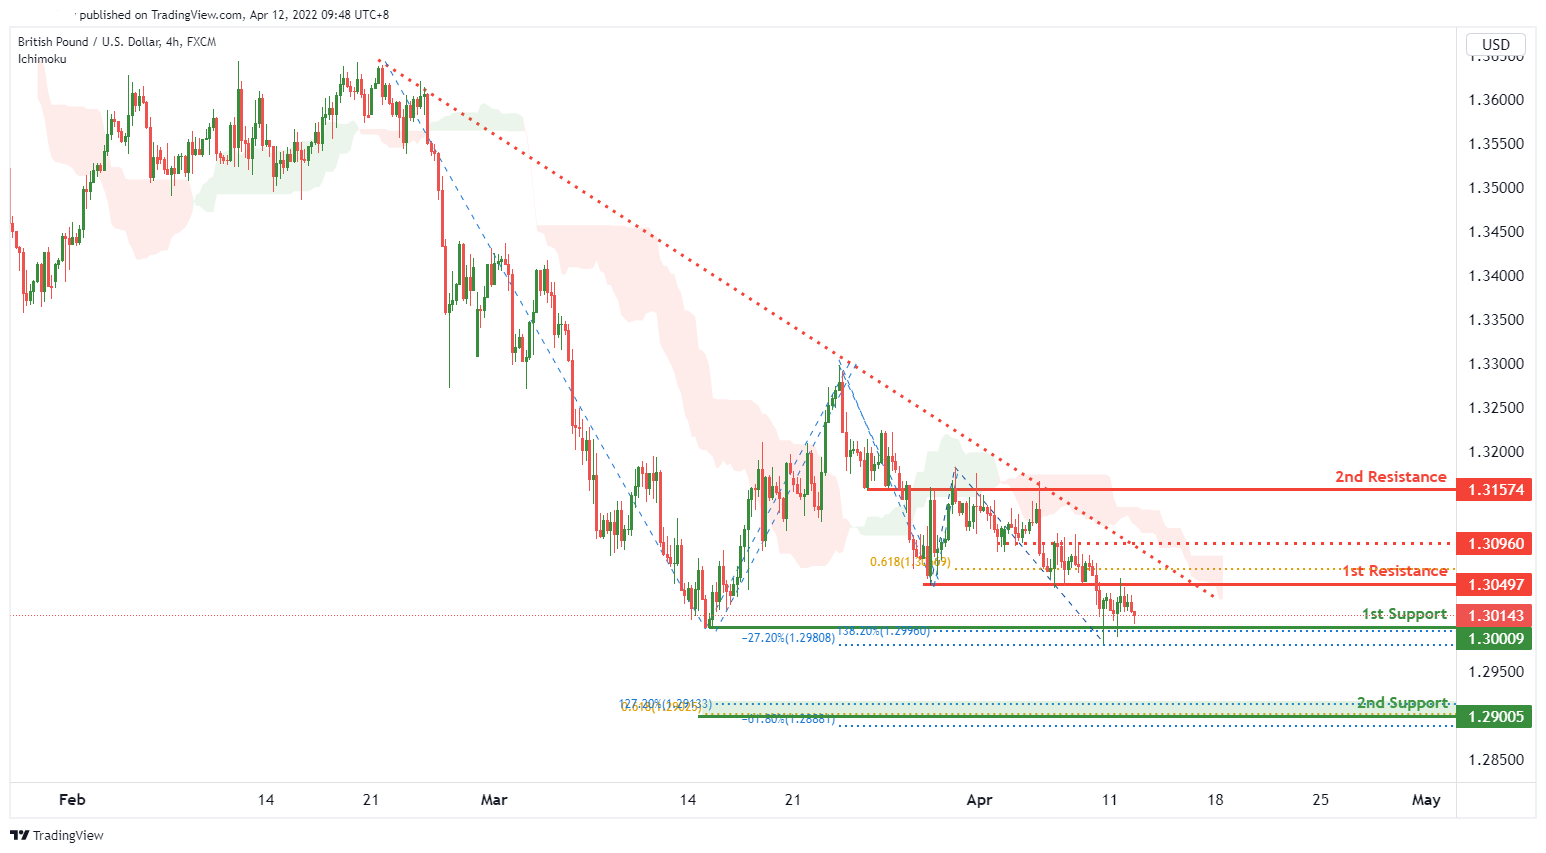
On the H4 timeframe, we expect to see a potential for bullish bounce from our 1st support level of 1.30009 in line with 138.2% Fibonacci extension and -27.2% Fibonacci expansion towards the 2nd resistance level of 1.31574 in line with a graphical overlap resistance. Alternatively, price might potentially dip from 1st resistance level of 1.30497 in line with 61.8% Fibonacci projection towards the 2nd support level of 1.29005 in line with Fibonacci confluence (61.8% Fibonacci projection, 127.2% Fibonacci extension and -61.8% fibonacci expansion). We have a neutral bias as we are waiting for price confirmation.
Areas of consideration:
- H4 1st resistance at 1.30497
- H4 1st support at 1.30009
USD/CHF:
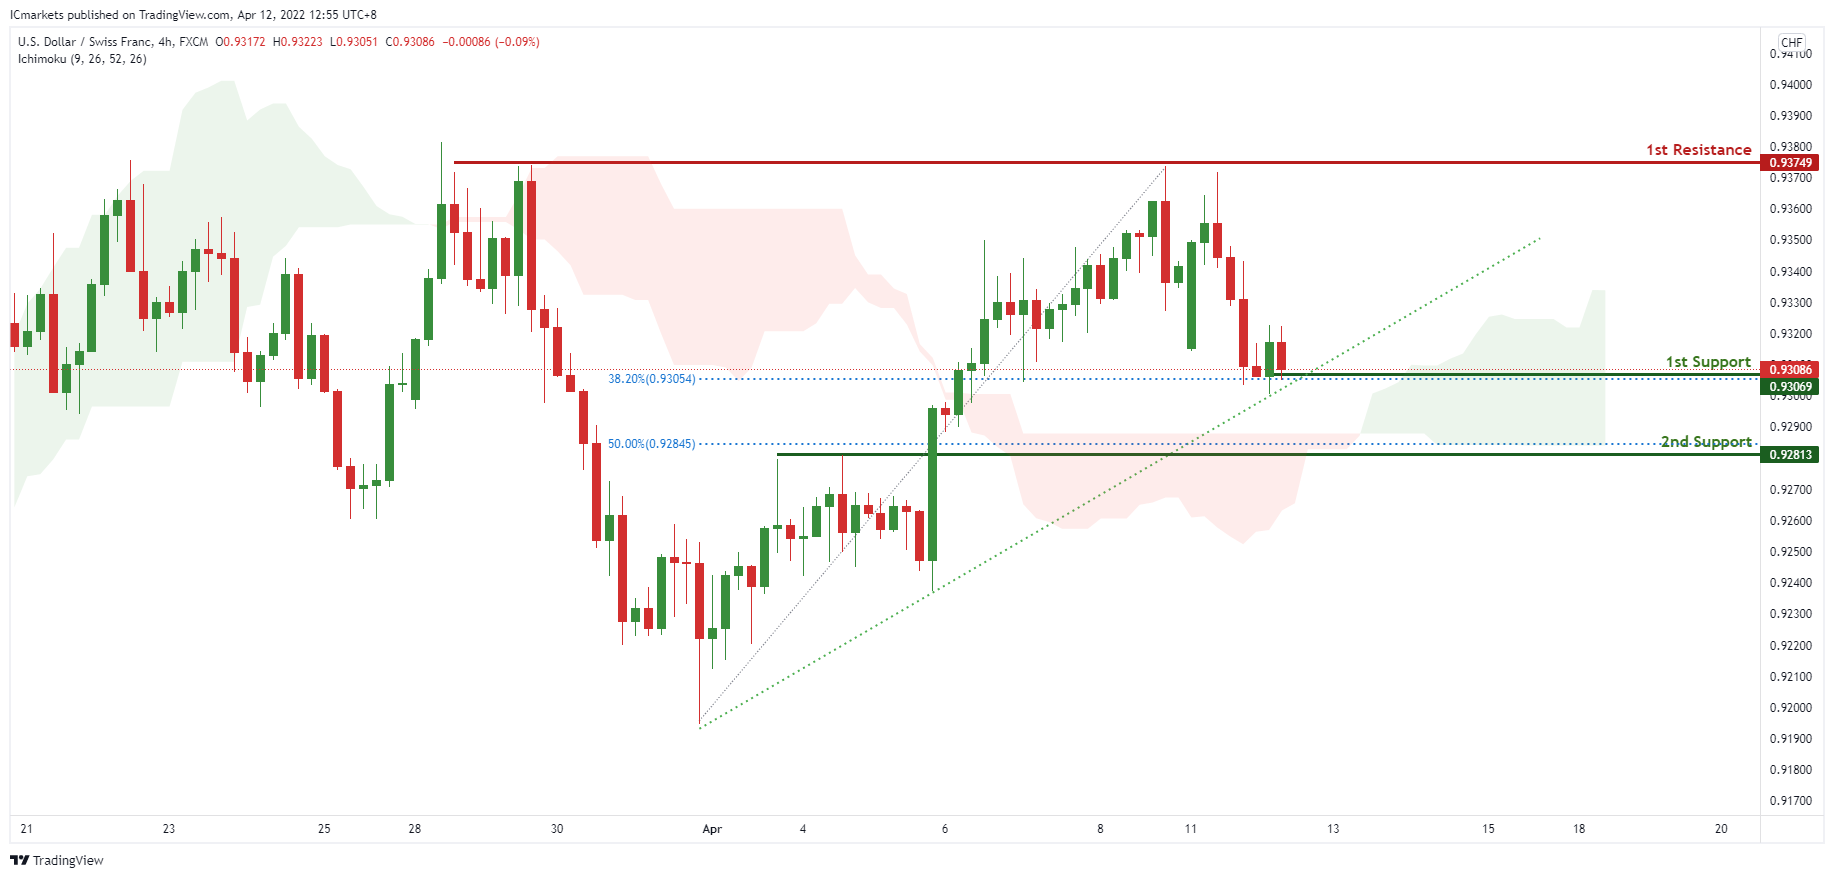
On the H4, prices are on bullish momentum and abiding by an ascending trendline support. We see the potential for further bullish continuation from our 1st support at 0.93069 in line with 38.2% FIbonacci retracement towards our 1st resistance at 0.93749 which is a graphical swing high and strong graphical resistance. Prices are trading above our ichimoku clouds, further supporting our bullish bias.
Areas of consideration
- 1st support level at 0.93069
- 1st resistance level at 0.93749
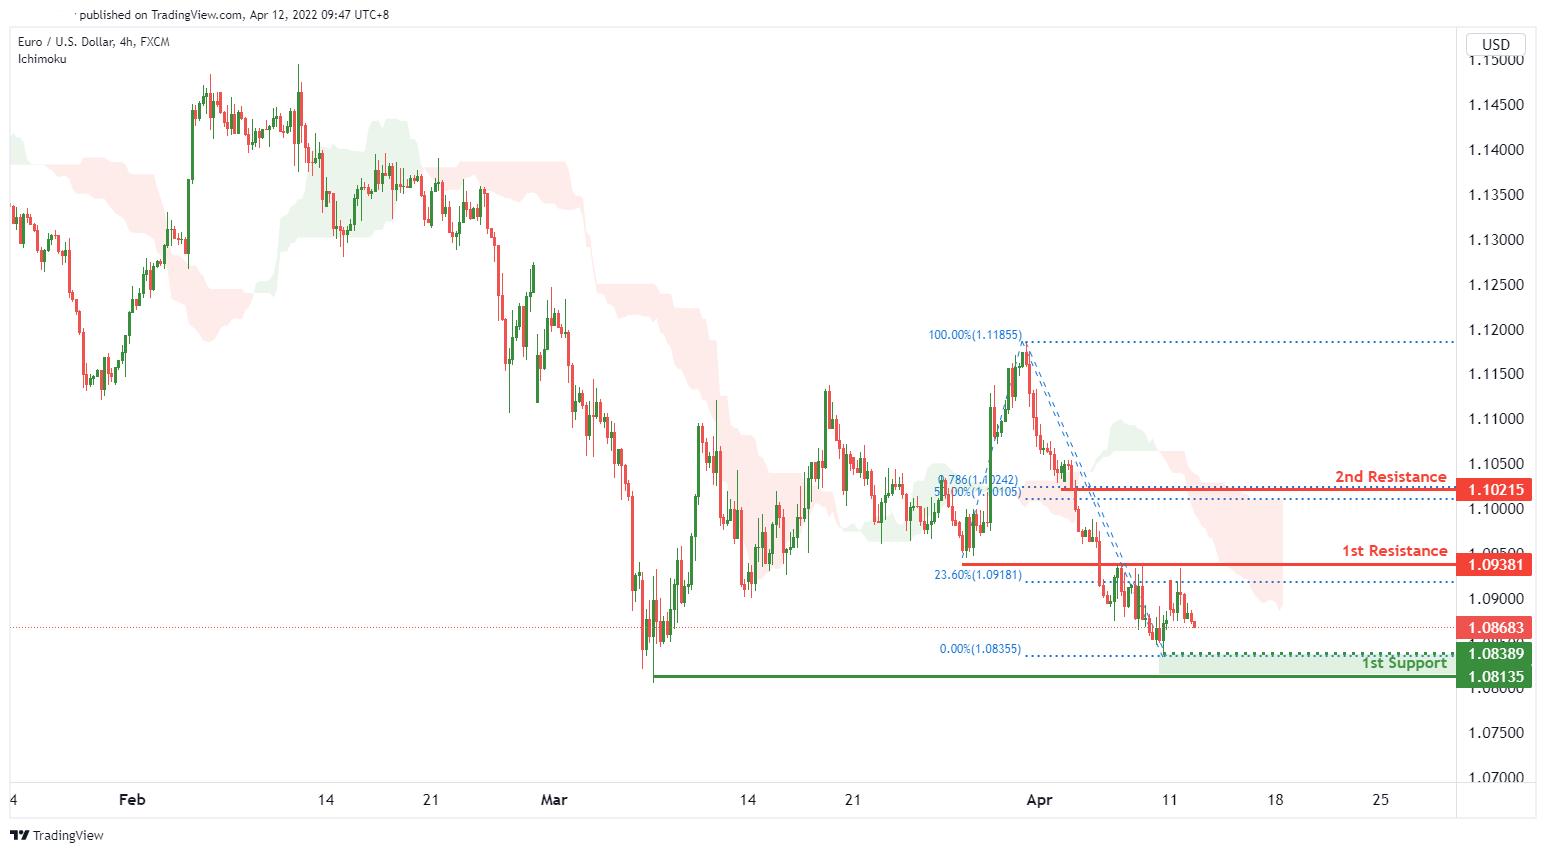
EUR/USD :
On the H4 timeframe, price is near a key pivot. We see the potential for a bearish reversal from our 1st resistance level of 1.09381 in line with 23.6% Fibonacci retracement towards our 1st support level of 1.08135 in line with a graphical swing low support. Our bearish bias is supported by price trading below the ichimoku cloud indicator.
Areas of consideration :
- H4 1st resistance at 1.09381
- H4 1st support at 1.08135
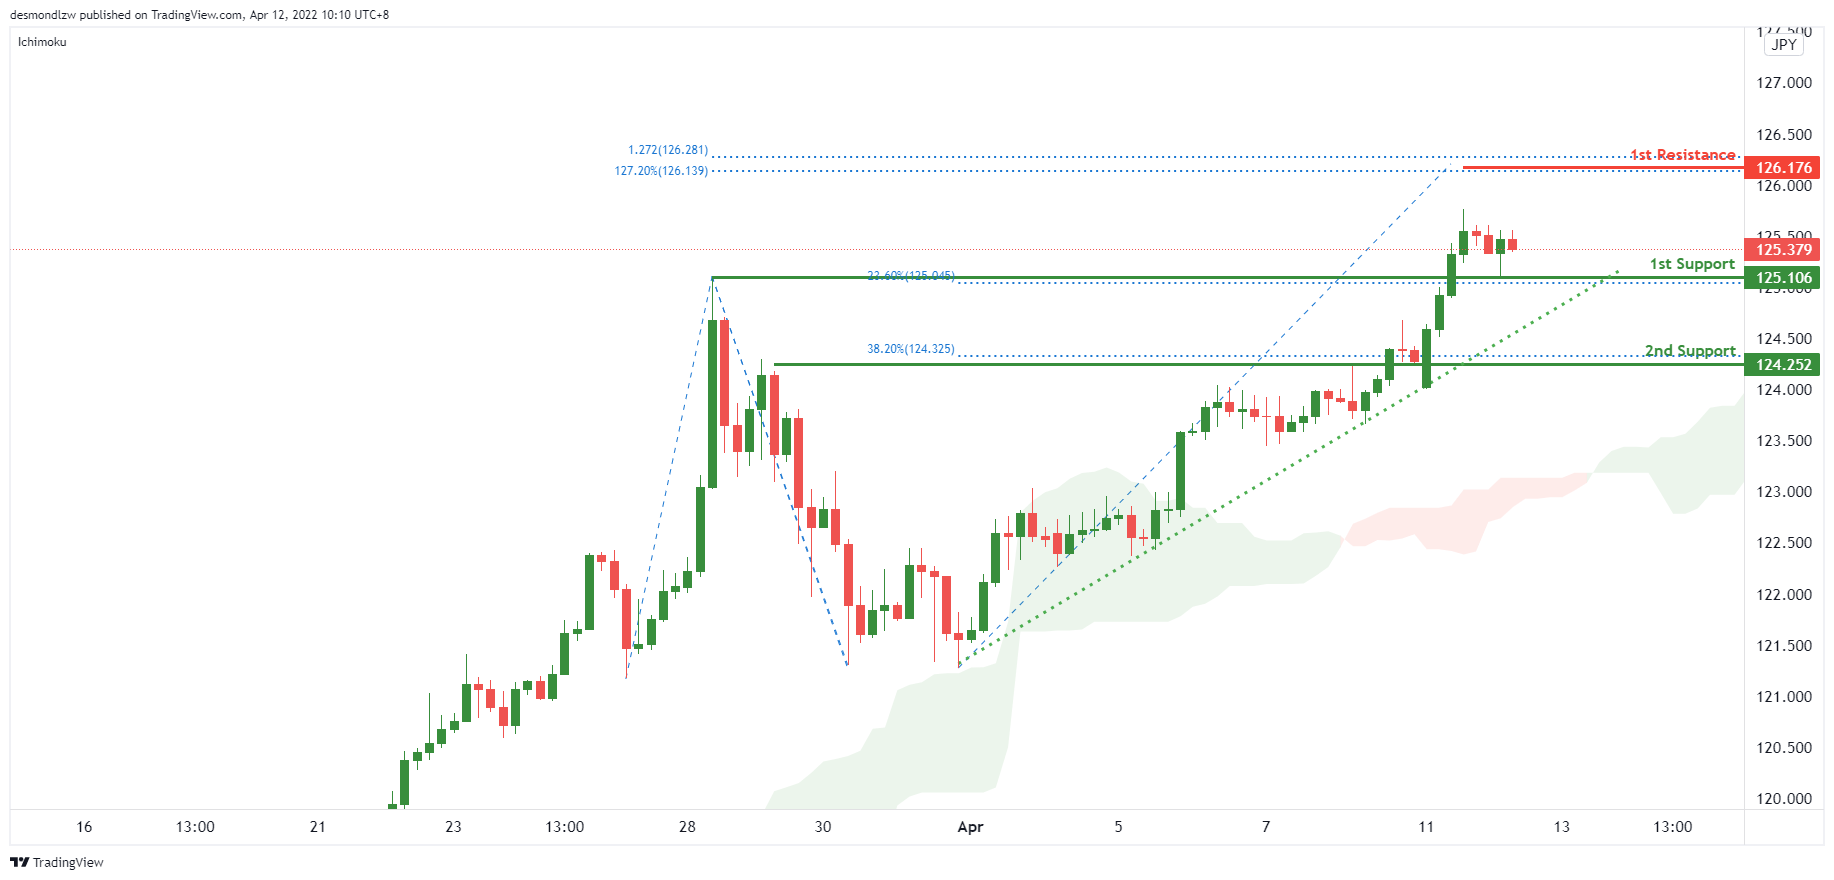
USD/JPY:
On the H4 timeframe, prices are on bullish momentum and abiding by an ascending trendline support. We see the potential for further bullish continuation from our 1st support at 125.106 in line with 23.6% Fibonacci retracement towards our 1st resistance at 126.176 which is an area of Fibonacci confluences. Breaking out 1st support will find prices dipping towards our 2nd support at 124.252 in line with 38.2% Fibonacci retracement. Prices are trading above our ichimoku clouds, further supporting our bullish bias.
Areas of consideration:
- H4 time frame, 1st resistance at 126.176
- H4 time frame, 1st support at 124.252
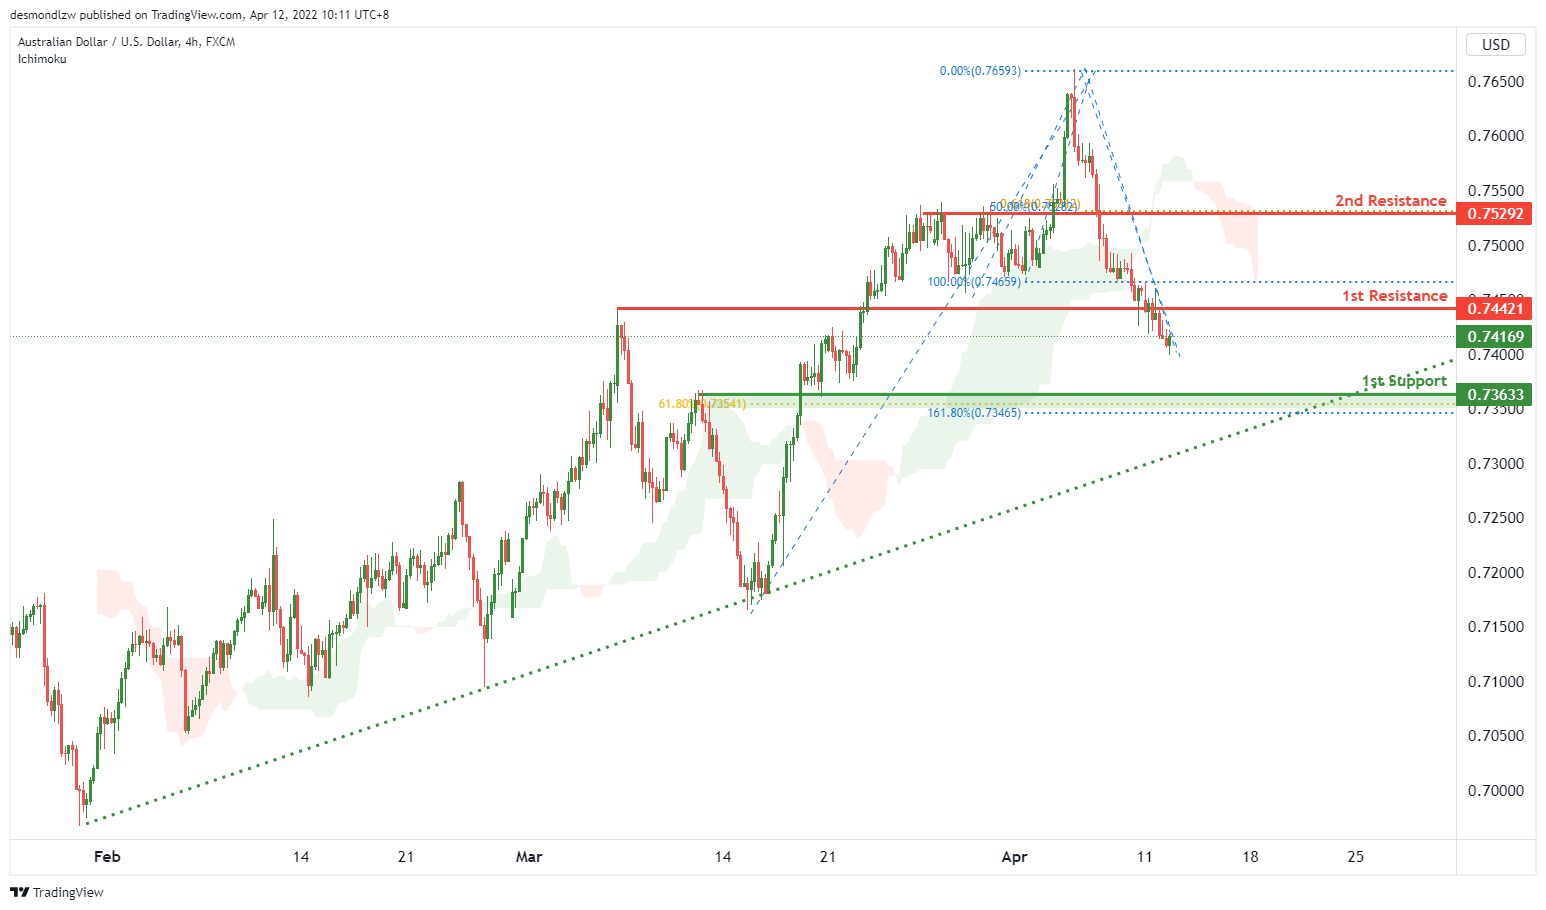
AUD/USD:
On the H4 timeframe, we see the potential for a bearish continuation from our 1st resistance level at 0.74421 in line with graphical overlap resistance towards our 1st support level at 0.73633 in line with 61.8% Fibonacci retracement and 161.8% Fibonacci extension. Our bearish bias is supported by price trading below the ichimoku cloud indicator.
Areas of consideration
- H4 1st resistance at 0.74421
- H4 1st support at 0.73633
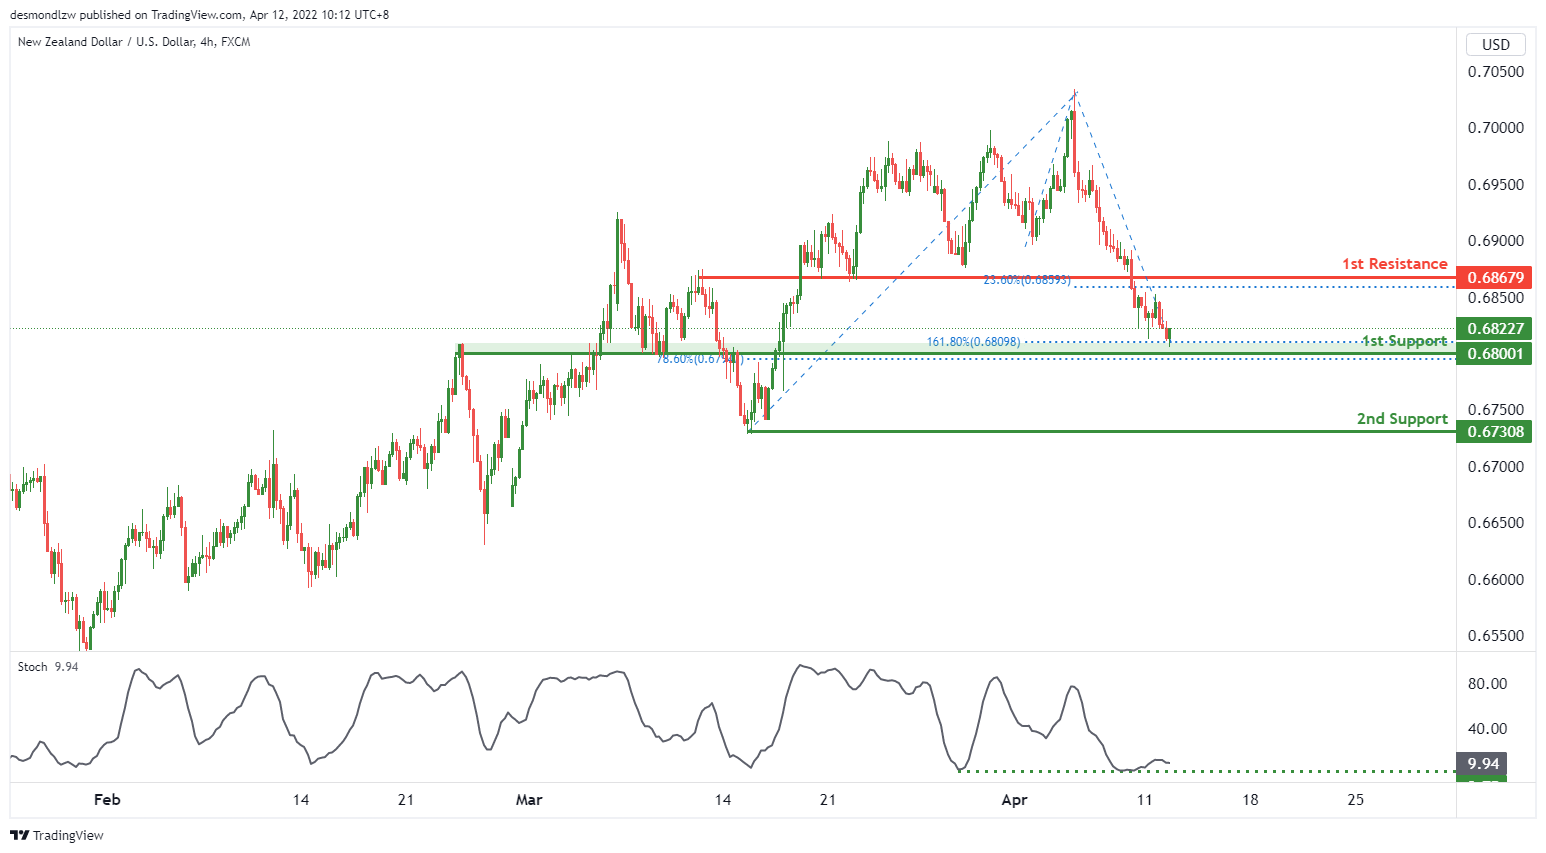
NZD/USD:
On the H4, we expect to see a potential for a bullish bounce from our 1st support of 0.68001 in line with the 78.6% fibonacci retracement and 161.8% Fibonacci extension towards our 1st resistance level at 0.68679 in line with the 23.6% Fibonacci retracement. Our bullish bias is supported by the stochastic indicator where price is at support level.
Areas of consideration:
- H4 time frame, 1st support at 0.68001
- H4 time frame, 1st resistance at 0.68679
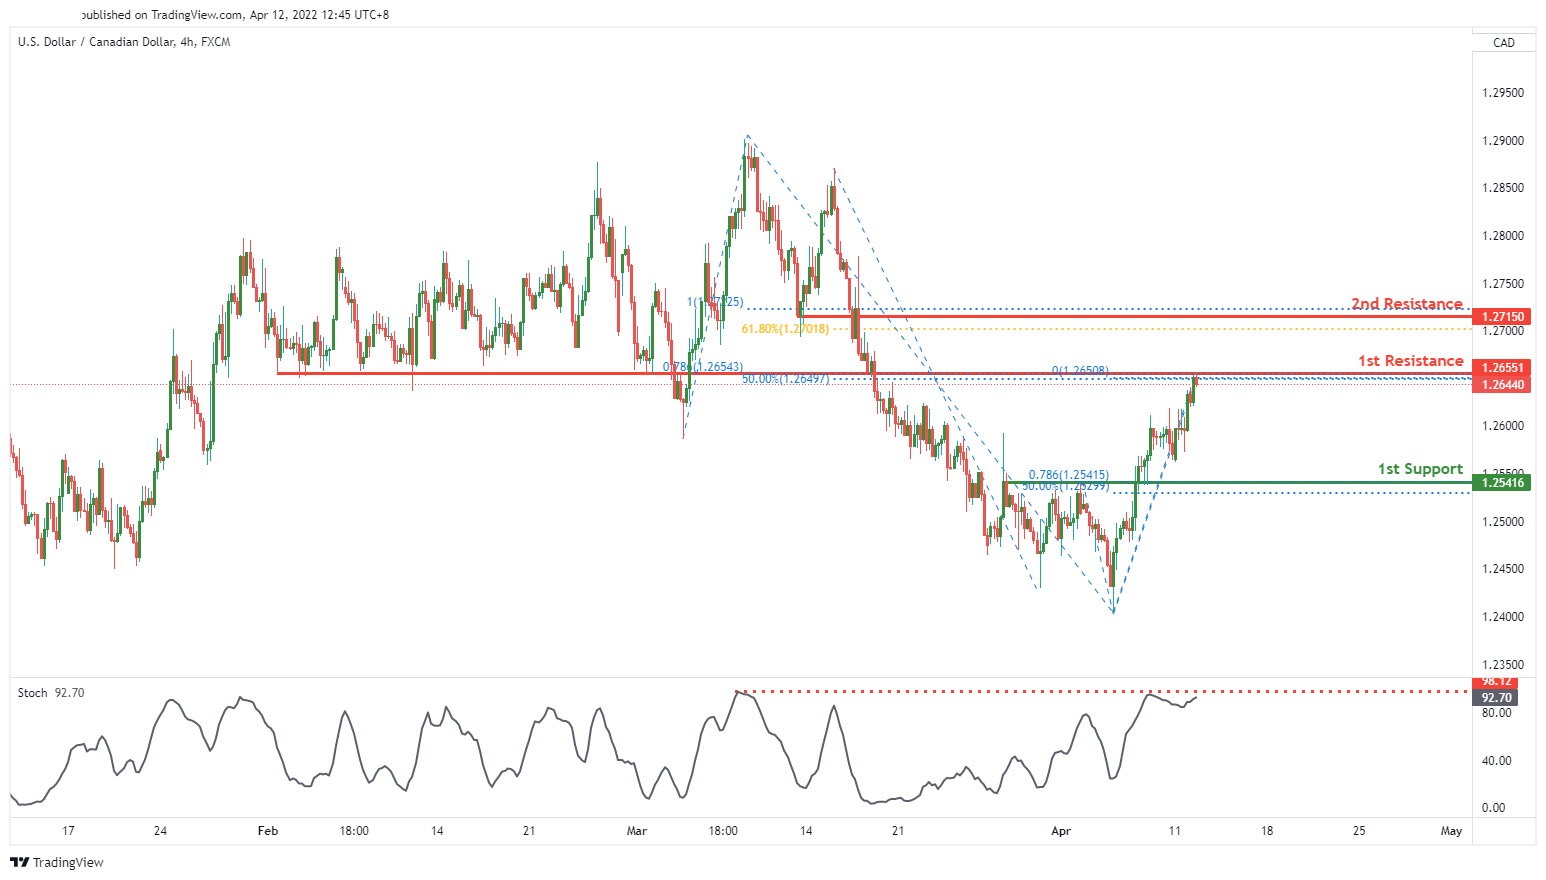
USD/CAD:
On the H4, we expect a potential for bearish reversal from 1st resistance level of 1.26551 in line with 50% Fibonacci retracement and 78.6% Fibonacci projection towards to 1st support level of 1.25416 in line with 50% Fibonacci retracement and 78.6% Fibonacci projection. Our bearish bias is supported by the stochastic indicator where price is trading at resistance level.
Areas of consideration:
- H4 time frame, 1st support at 1.26551
- H4 time frame, 1st resistance at 1.25416
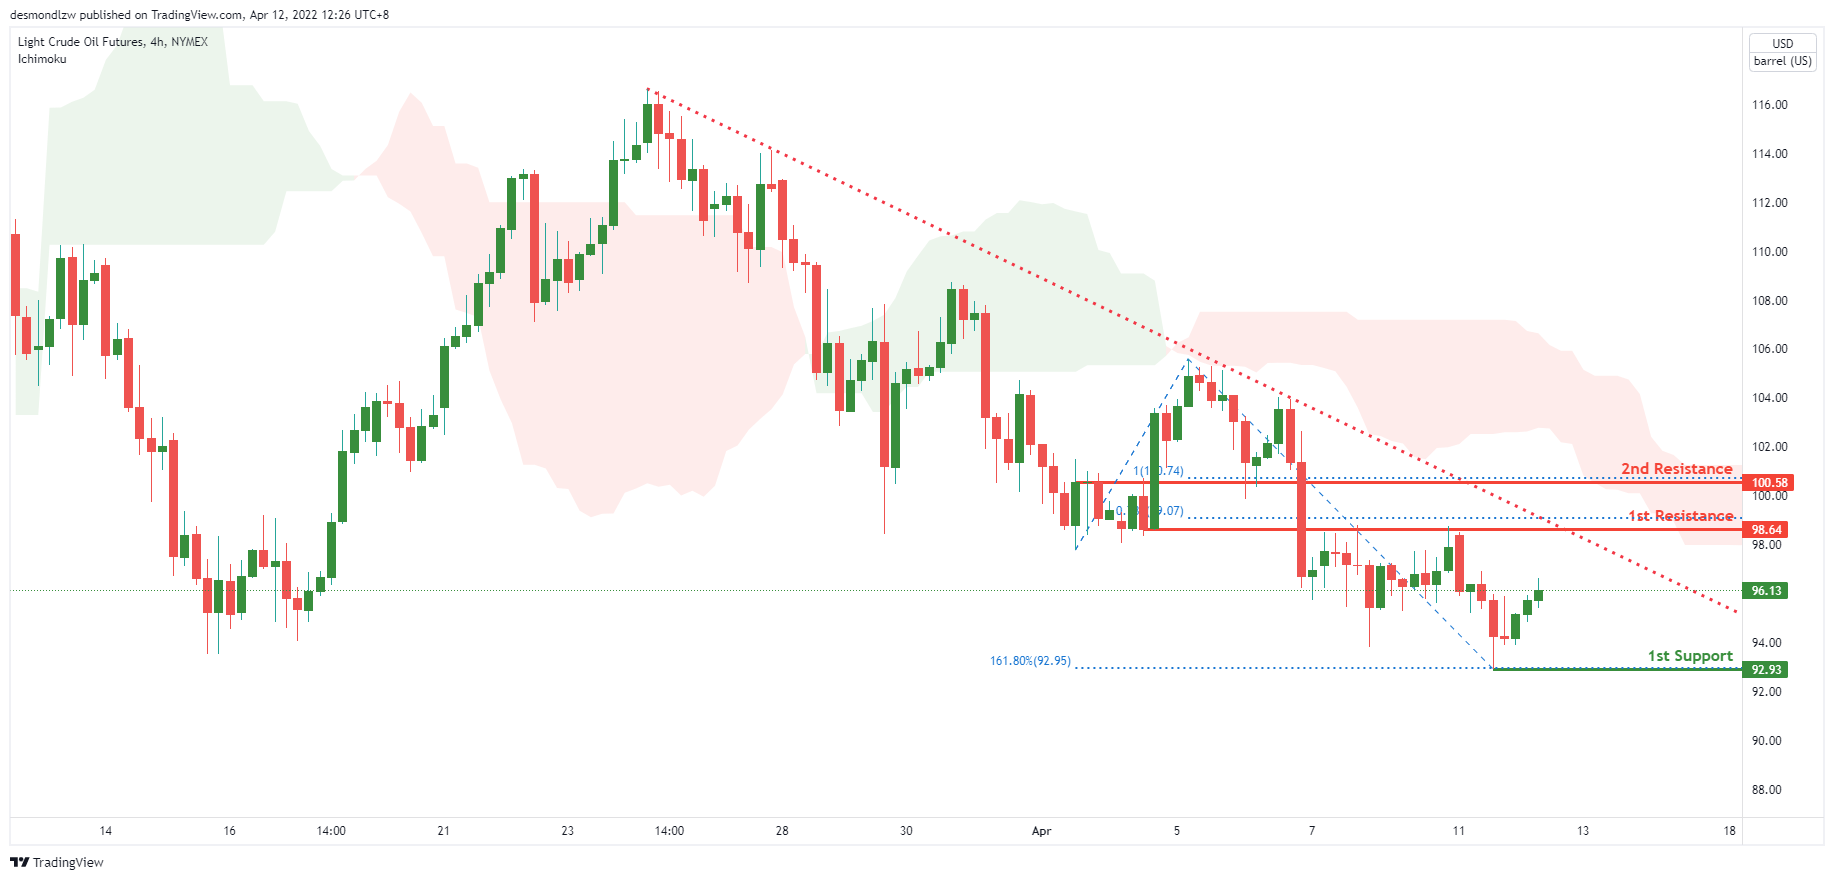
OIL:
On the H4, prices are on bearish momentum and abiding by a descending trendline. We see the potential for a dip from our 1st resistance at 98.64 in line with 78.6% Fibonacci Projection towards our 1st support at 92.93 in line with graphical swing low and 161.8% Fibonacci projection. Alternatively, price may break 1st resistance and head for 2nd resistance at 100.58 in line with the 100% Fibonacci Projection.
Areas of consideration:
- H4 time frame, 1st resistance of 98.64
- H4 time frame, 1st support of 92.93
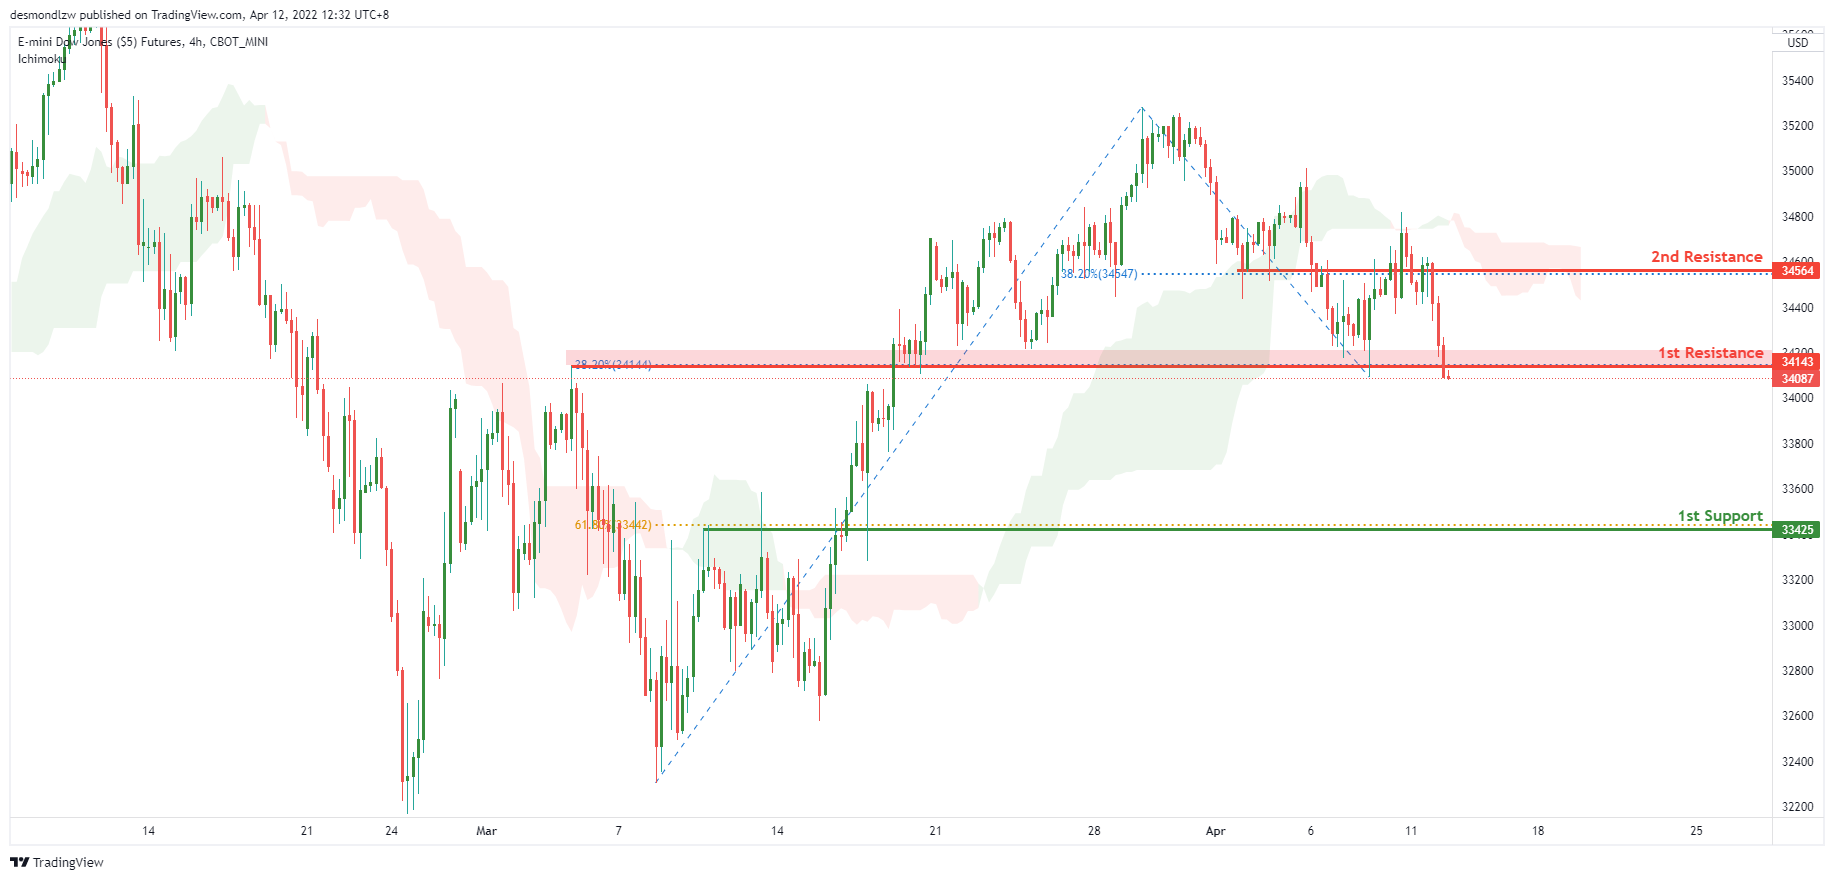
Dow Jones Industrial Average:
On the H4, with price trading below the ichimoku cloud, we have a bias that prices will dip to our 1st support at 33425 in line with the 61.8% Fibonacci retracement from our 1st resistance at 34143 in line with the horizontal overlap and 38.2% Fibonacci retracement. Alternatively, price may break 1st resistance structure and head for 2nd resistance at 34564 in line with 38.2% Fibonacci retracement.
Areas of consideration :
- H4 1st support at 33425
- H4 1st resistance at 34143


