
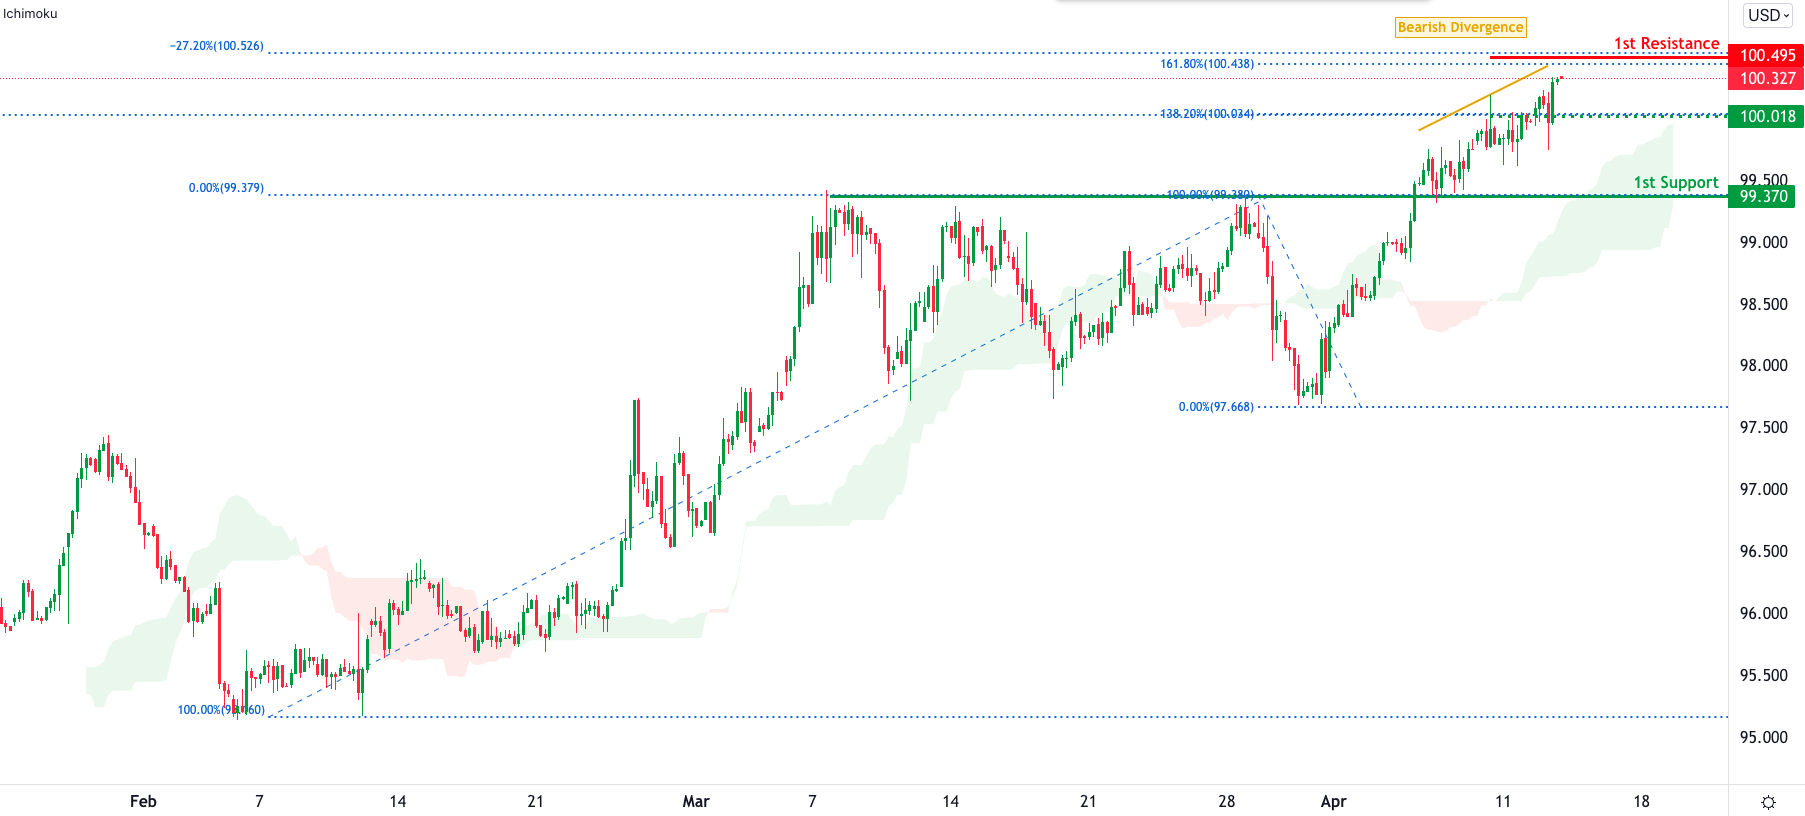
DXY:
Price is approaching major resistance at the 100.49 area which is in line with a 161.8 Fibonacci extension and a -27% Fibonacci expansion. It is worth noting that there is a strong bearish divergence here with RSI suggesting that a possible bearish reversal might occur. Intermediate support is at 100.00 big fig which was a previous major resistance-turned-support. If this intermediate support is broken, then the next key support level is at 99.37 which is a pullback support level.
Areas of consideration:
- H4 time frame, 1st resistance at 100.49
- H4 time frame, intermediate support at 100.00 big figure
- H4 time frame, 1st support at 99.37
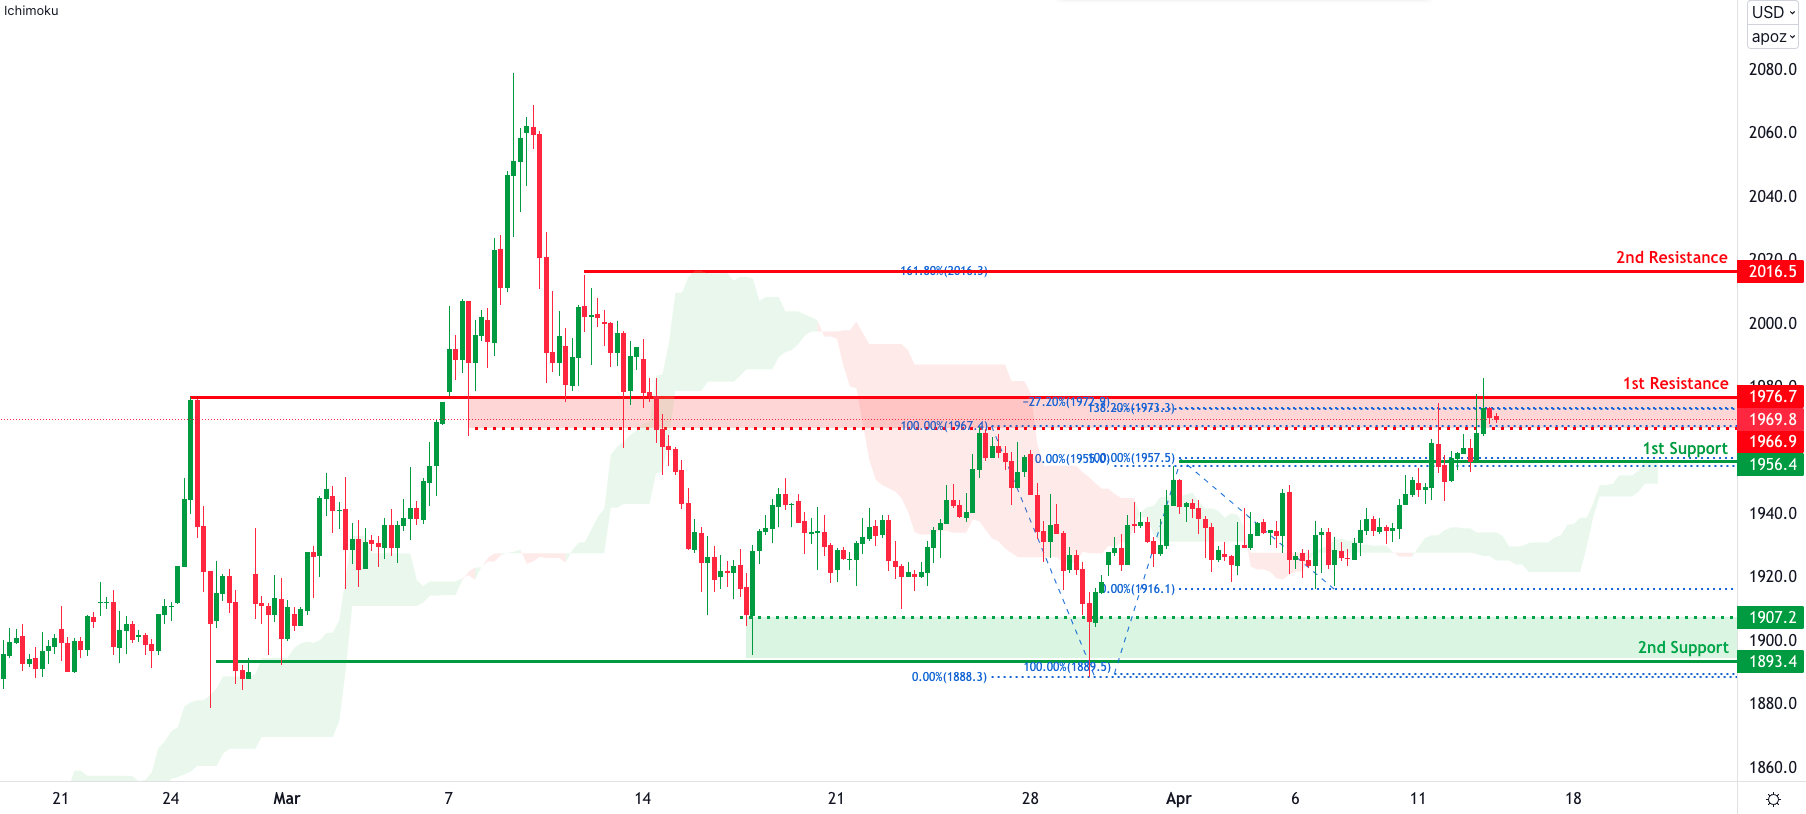
XAU/USD (GOLD):
Price is in-between two major levels, the resistance at 1976 which has a strong Fibonacci confluence and the support at 1956 which is a pullback support level that lines up with the 23.6% Fibonacci retracement. If price breaks out of the 1st resistance, the next key resistance is at 2016 which happens to line up with the 161.8 Fibonacci extension too. If price breaks the 1st support level, the next key support would be down at 1893 which is a swing low support where price bounced from multiple times.
Areas of consideration:
- H4 time frame, 1st Resistance at 1976.7
- H4 time frame, 2nd Resistance at 2016
- H4 time frame, 1st Support at 1956
- H4 time frame, 2nd Support at 1893
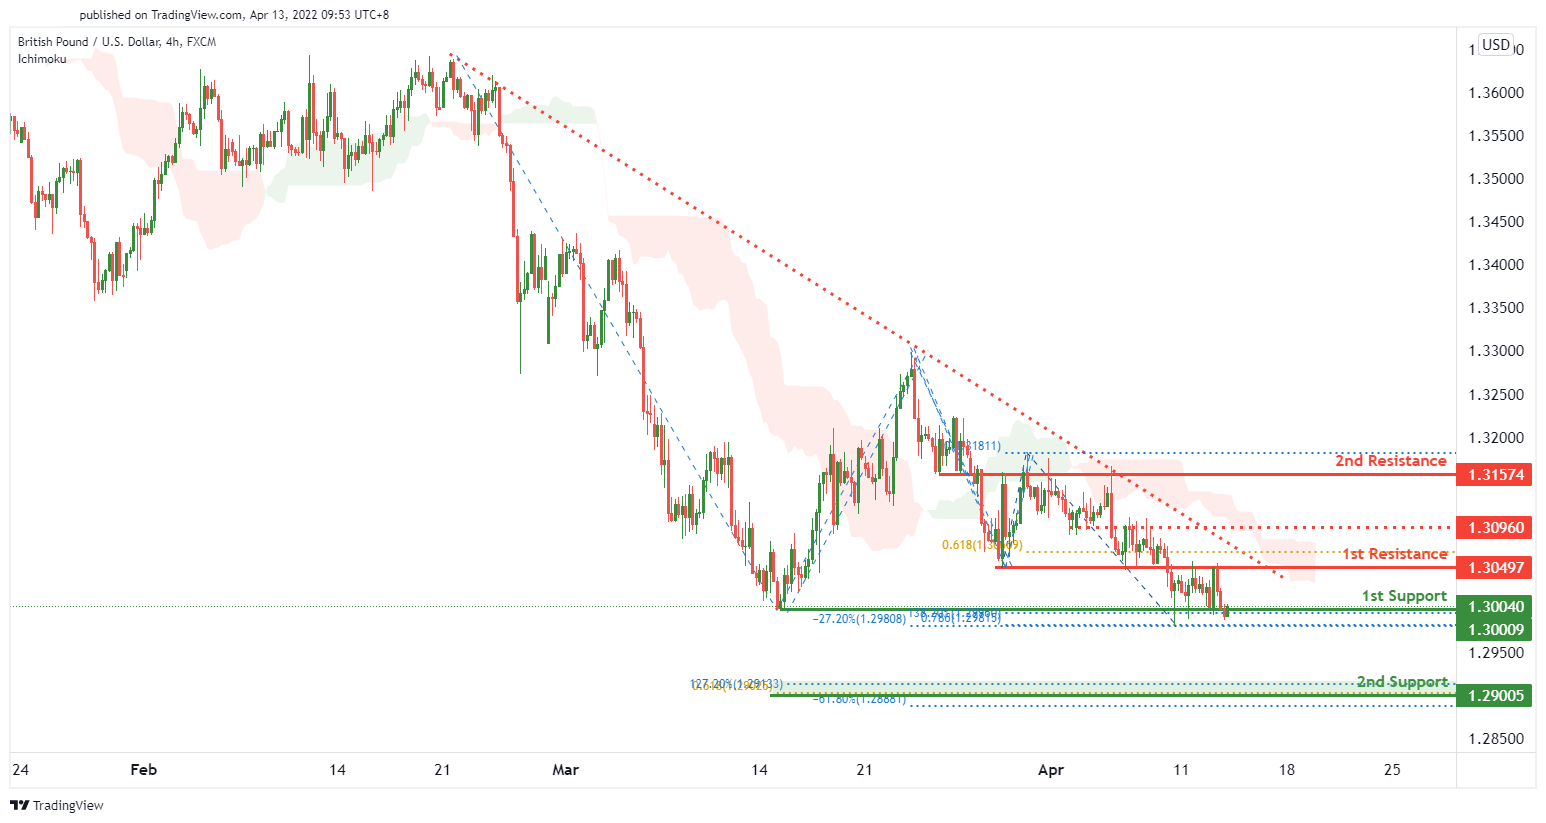
GBP/USD:
On the H4 timeframe, we expect to see a potential for bearish dip from 1st resistance level of 1.30497 in line with 61.8% Fibonacci projection towards the 2nd support level of 1.29005 in line with Fibonacci confluence (61.8% Fibonacci projection, 127.2% Fibonacci extension and -61.8% fibonacci expansion). Alternatively, price might potentially bounce from our 1st support level of 1.30009 in line with 138.2% Fibonacci extension and -27.2% Fibonacci expansion towards the 2nd resistance level of 1.31574 in line with a graphical overlap resistance. We have a neutral bias as we are waiting for price confirmation.
Areas of consideration:
- H4 1st resistance at 1.30497
- H4 2nd resistance at 1.31574
- H4 1st support at 1.30009
- H4 2nd support at 1.29005
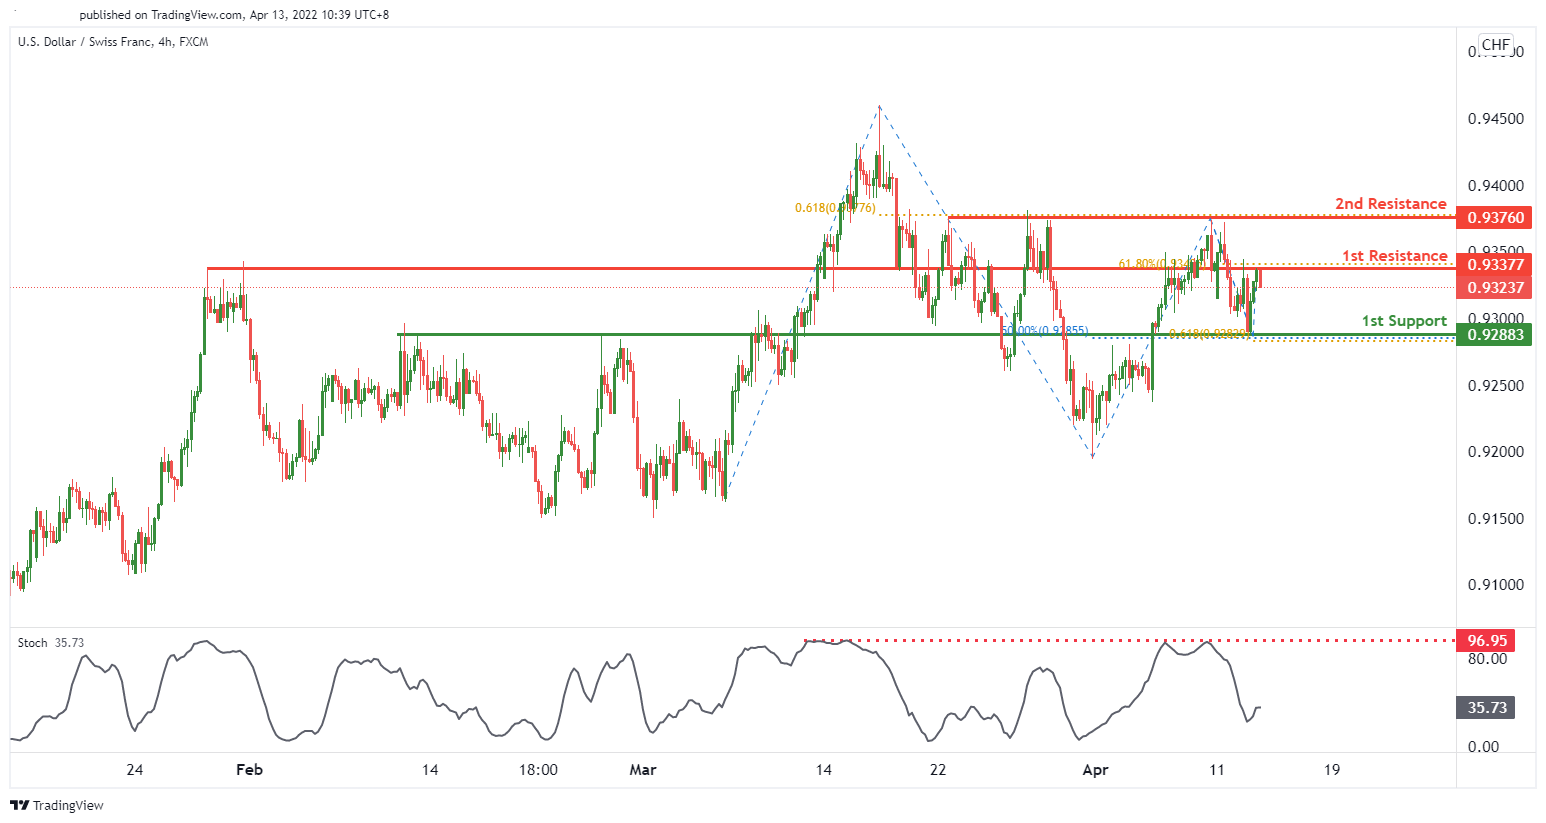
USD/CHF:
On the H4, prices are on bearish momentum. We see the potential for bearish dip from our 1st resistance at 0.93377 in line with 61.8% FIbonacci retracement towards our 1st support at 0.92883 which is in line with 50% Fibonacci retracement and 61.8% Fibonacci projection. Our bearish bias is supported by the stochastic indicator where price is trading at resistance level.
Areas of consideration
- 1st support level at 0.92883
- 1st resistance level at 0.93377
- 2nd resistance level at 0.93760
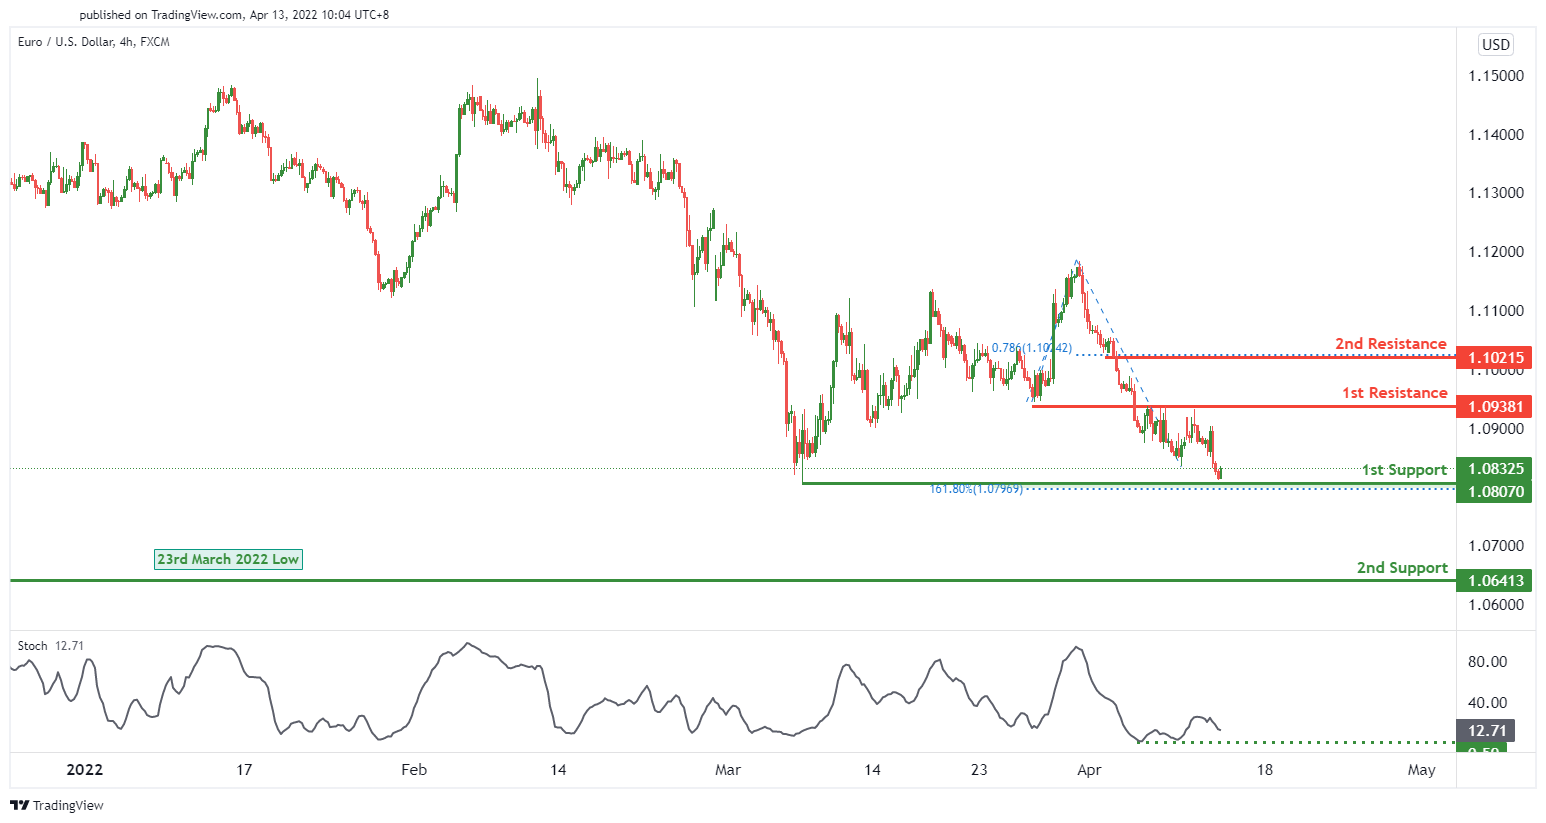
EUR/USD :
On the H4 timeframe, price is near a key pivot. We see the potential for a bullish bounce from our 1st support level of 1.08070 in line with 161.8% Fibonacci extension towards our 1st resistance level of 1.09381 in line with a graphical pullback resistance. Our bullish bias is supported by the stochastic indicator whereby price is trading at support level.
Areas of consideration :
- H4 1st resistance at 1.09381
- H4 1st support at 1.08070
- H4 2nd support at 1.06413
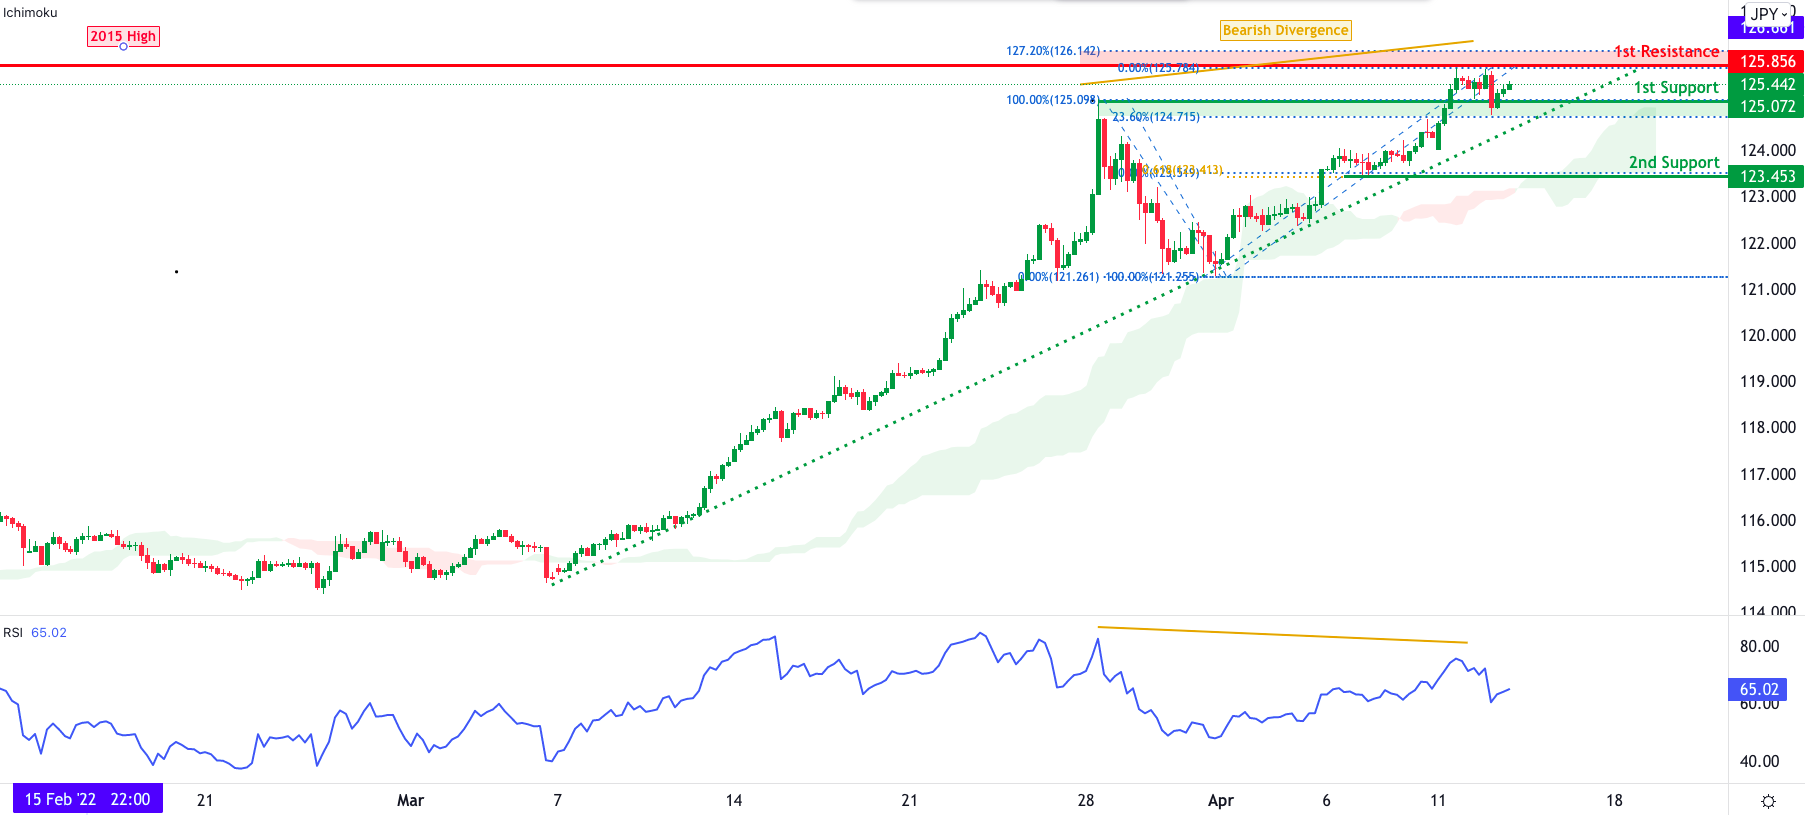
USD/JPY:
Price is testing major resistance at 125.85 which happens to be the all-time-high since 2015. There is both a 127% Fibonacci extension and a strong bearish divergence vs RSI that is at that level, suggesting that there could be a possible bearish reversal. We can see an ascending support line that is squeezing prices against the 1st resistance along with the 1st support area at 125.07 which also lines up with a 23% Fibonacci retracement. If price breaks the ascending support and 1st support area, we could see prices drop towards the 2nd support at 123.45.
Areas of consideration:
- H4 time frame, 1st resistance at 125.85
- H4 time frame, 1st support at 125.07
- H4 time frame, 2nd support at 123.45
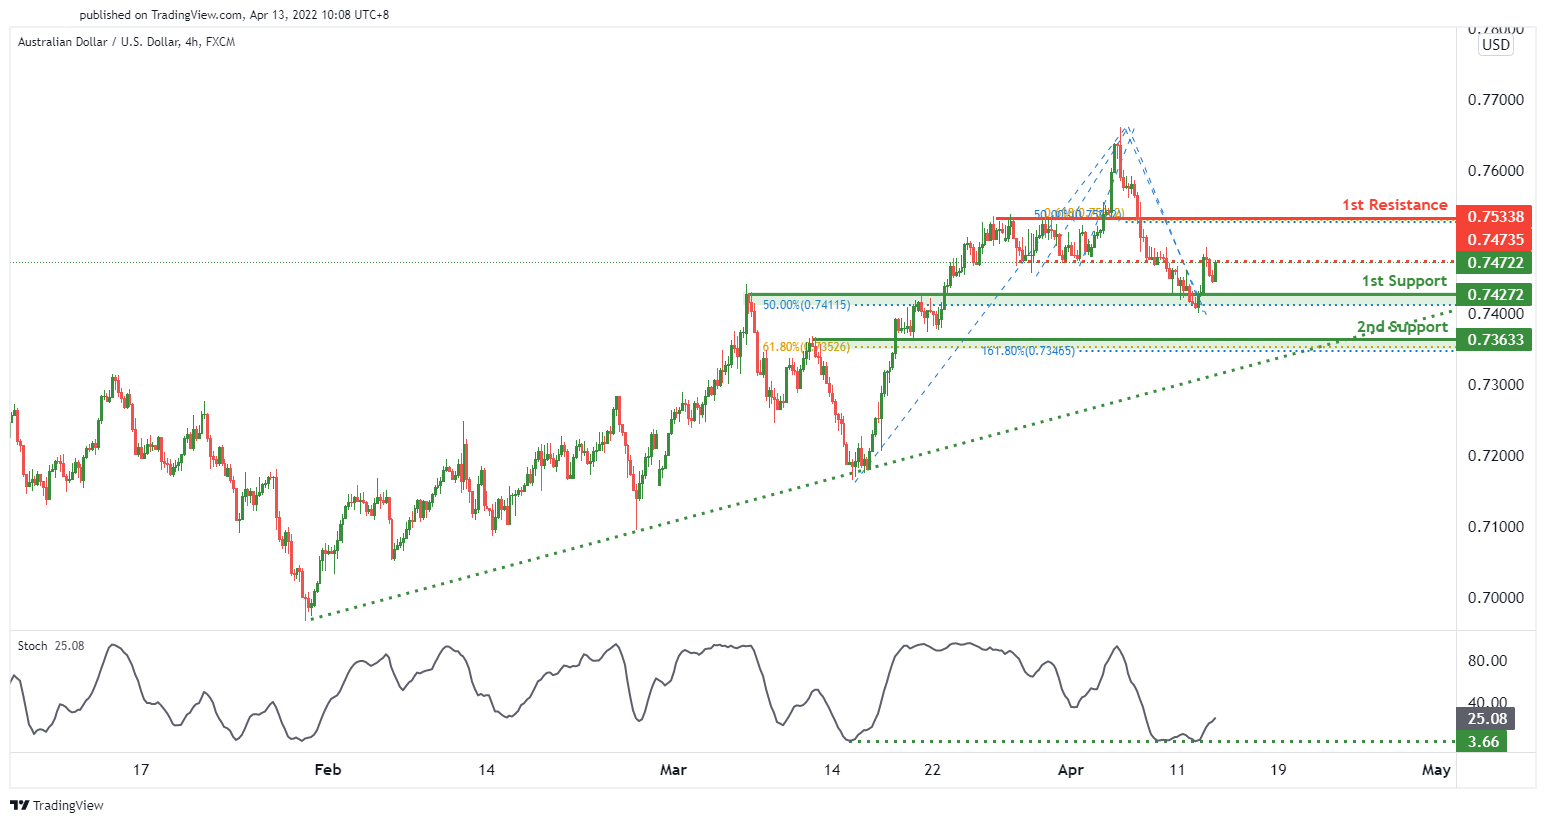
AUD/USD:
On the H4 timeframe, we see the potential for a bullish continuation from our 1st support level at 0.74272 in line with 50% Fibonacci retracement towards our 1st resistance level at 0.75338 in line with 50% Fibonacci retracement and 61.8% Fibonacci projection. Our bullish bias is supported by the stochastic indicator where price is trading at support level.
Areas of consideration
- H4 1st resistance at 0.75338
- H4 1st support at 0.74272
- H4 2nd support at 0.73633
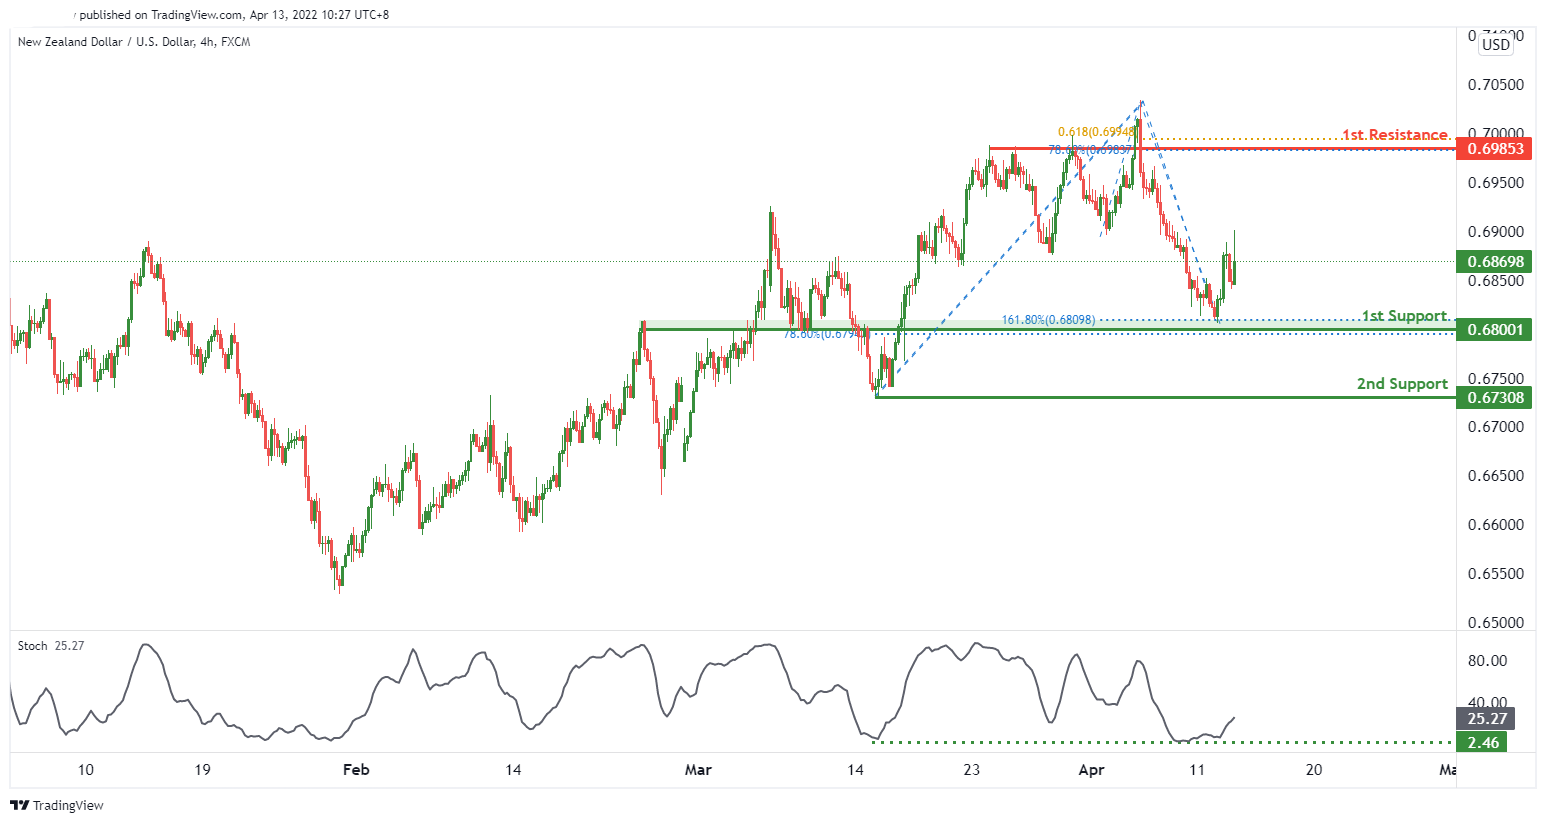
NZD/USD:
On the H4, we expect to see a potential for a bullish continuation from our 1st support of 0.68001 in line with the 78.6% fibonacci retracement and 161.8% Fibonacci extension towards our 1st resistance level at 0.69853 in line with the 78.6% Fibonacci retracement and 61.8% Fibonacci projection. Our bullish bias is supported by the stochastic indicator where price is at support level.
Areas of consideration:
- H4 time frame, 1st support at 0.68001
- H4 time frame, 2nd support at 0.67308
- H4 time frame, 1st resistance at 0.69853
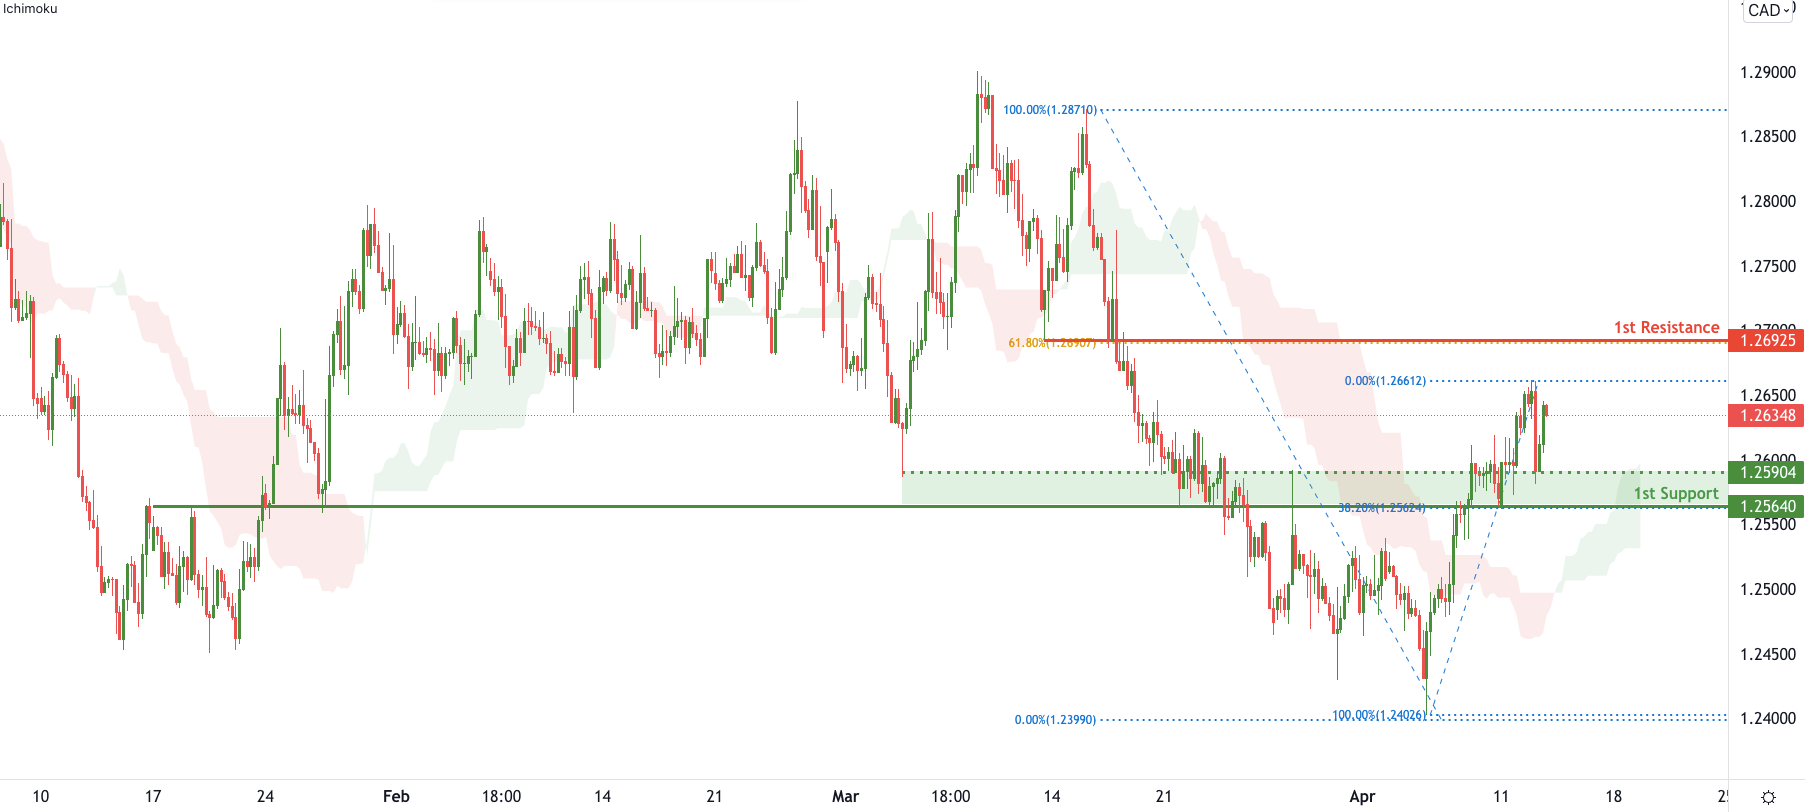
USD/CAD:
Price is seeing a 1st support level at 1.2564 which is an overlap support area along with a 38.2% Fibonacci retracement. Prices have crossed the Ichimoku cloud suggesting that there might be a resumption of some bullish momentum to take it up to the 1st resistance level at 1.2692 which is a pullback resistance that lines up with the 61.8% Fibonacci retracement.
Areas of consideration:
- H4 time frame, 1st resistance at 1.2692
- H4 time frame, 1st support at 1.2564
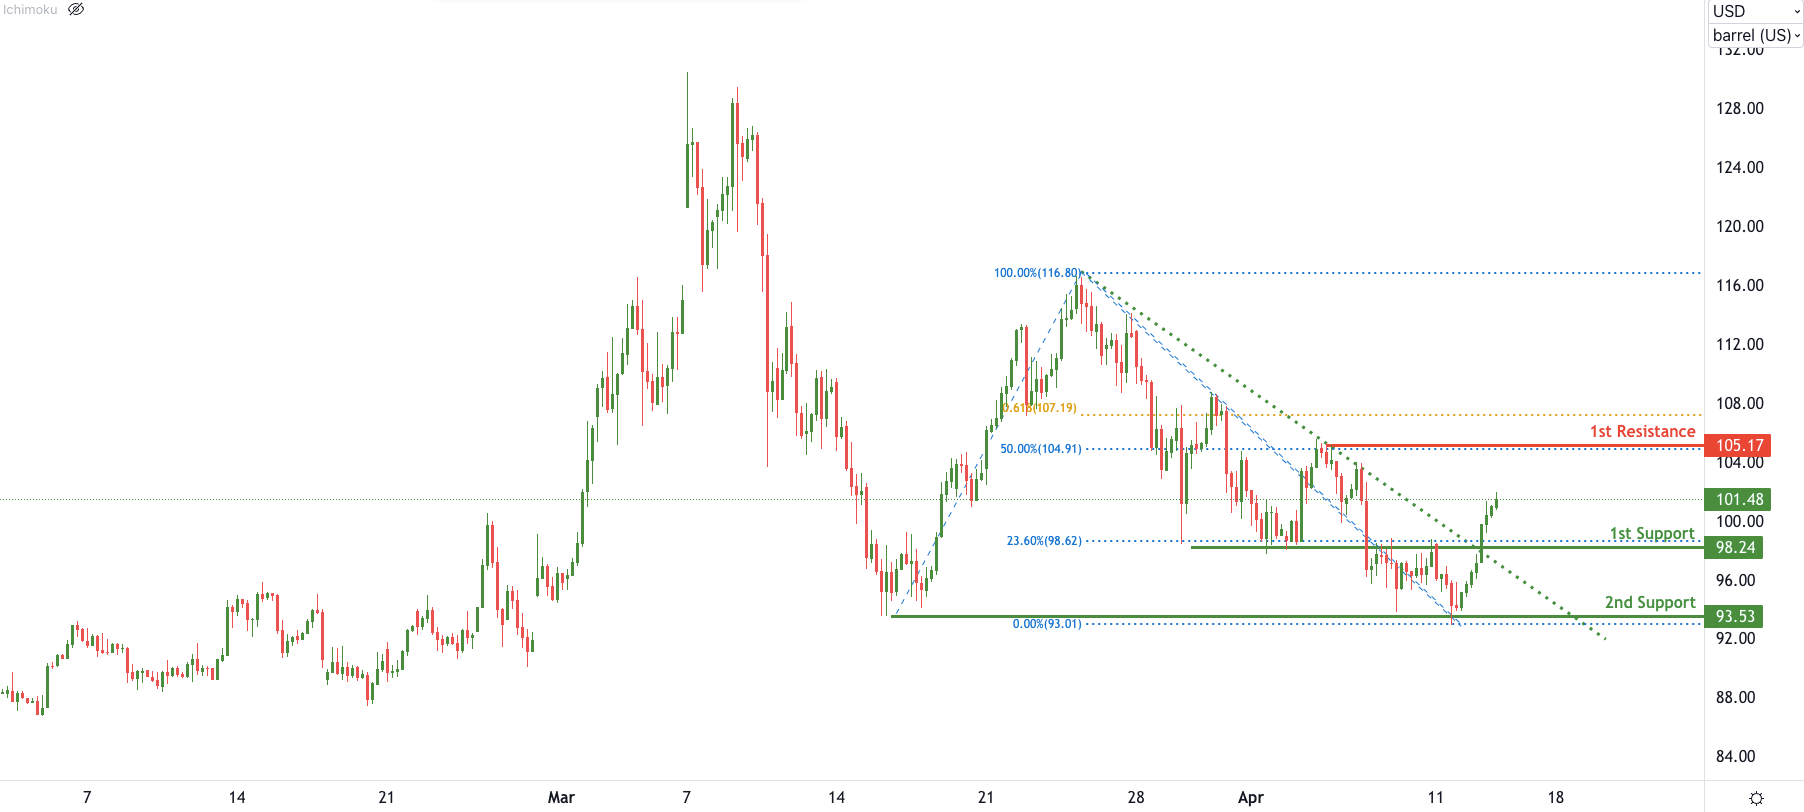
OIL:
Oil has broken out of a descending resistance-turned-support along with a resistance-turned-support level at 98.24, suggesting that there might be a potential bullish recovery towards 1st resistance at 105.17 which is a swing high resistance along with a major 50% Fibonacci retracement level. If price breaks below the 1st support, the next key support level is at 93.53 which has seen prices bounce off twice in the past.
Areas of consideration:
- H4 time frame, 1st resistance of 105.17
- H4 time frame, 1st support of 98.24
- H4 time frame, 2nd support at 93.53
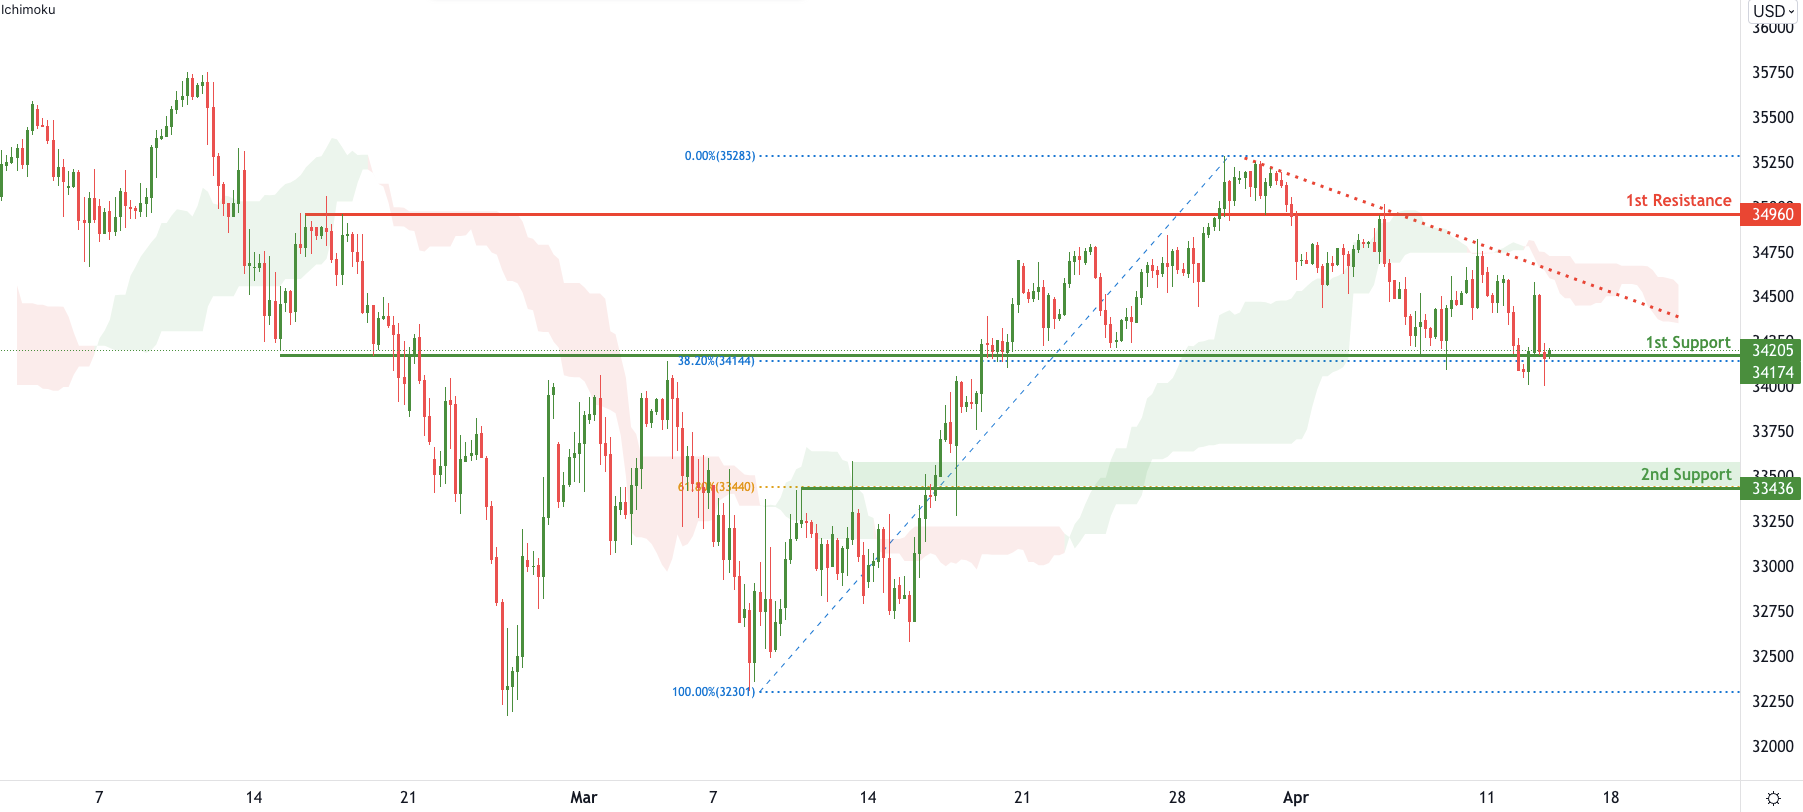
Dow Jones Industrial Average:
Price is seeing an overlap support level at 34174 which also lines up with the 38.2% Fibonacci retracement. The Ichimoku cloud is above prices and there is a descending resistance line that is also pushing it down and squeezing it against the 1st support level. If prices break the 1st support level, the next key support level is at the 33436 area which is a pullback support along with a major 61.8% Fibonacci retracement.
Areas of consideration :
- H4 time frame, 1st resistance at 34960
- H4 time frame, 1st support at 34174
- H4 time frame, 2nd support at 33436


