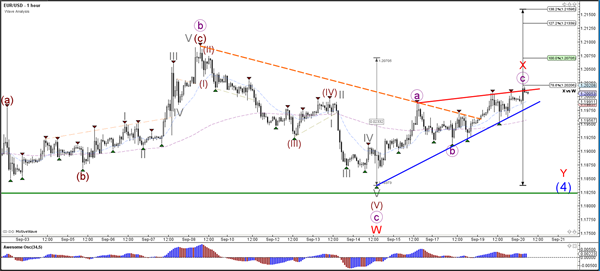
Currency pair EUR/USD
The EUR/USD respected the 78.6% Fibonacci resistance level of wave X vs W. Price could be building an extended WXY (red) correction within wave 4 (blue) unless price shows strong bullish candles once breaking above the resistance trend lines.
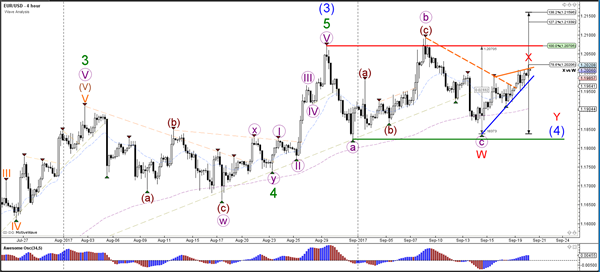
The EUR/USD seems to be building a rising wedge chart pattern at 1.20 when comparing the angle of the support (blue) trend line with the angle of the resistance (red). A break below support could see the start of wave Y (red) whereas a bullish break could see price test higher Fibonacci levels of wave X vs W.
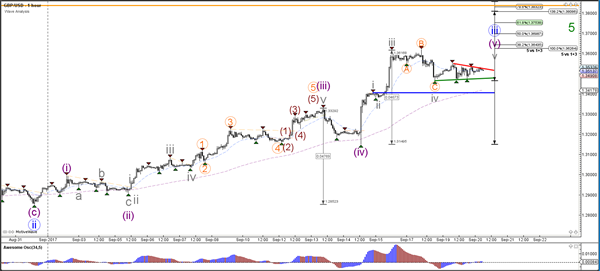
Currency pair GBP/USD
The GBP/USD is building a small triangle pattern (red/green) after its bearish retracement within the larger uptrend. A bullish breakout above resistance (red) could restart the wave 3 (blue).
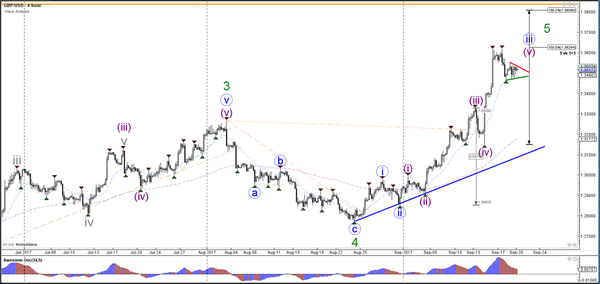
The GBP/USD is moving sideways and offers a key support (green) and resistance (red) trend line. A break below the top of wave 1 (blue) invalidates the wave 4 (grey).
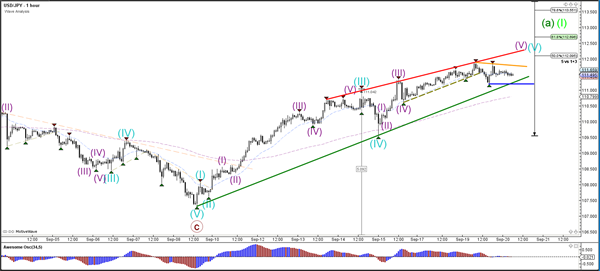
Currency pair USD/JPY
The USD/JPY seems to be in a 5th wave (blue) which could be part of a wave 1 (light green) or alternatively wave A (green).
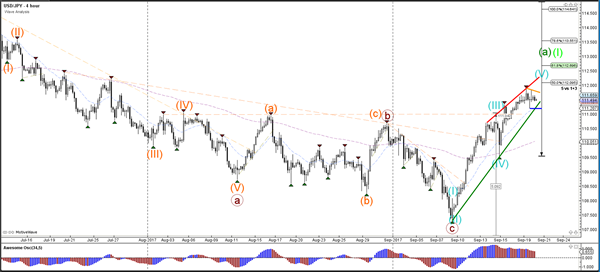
The USD/JPY is in a bullish trend channel (green/red). The bullish momentum could be finished if price manages to break below support (green/blue).