
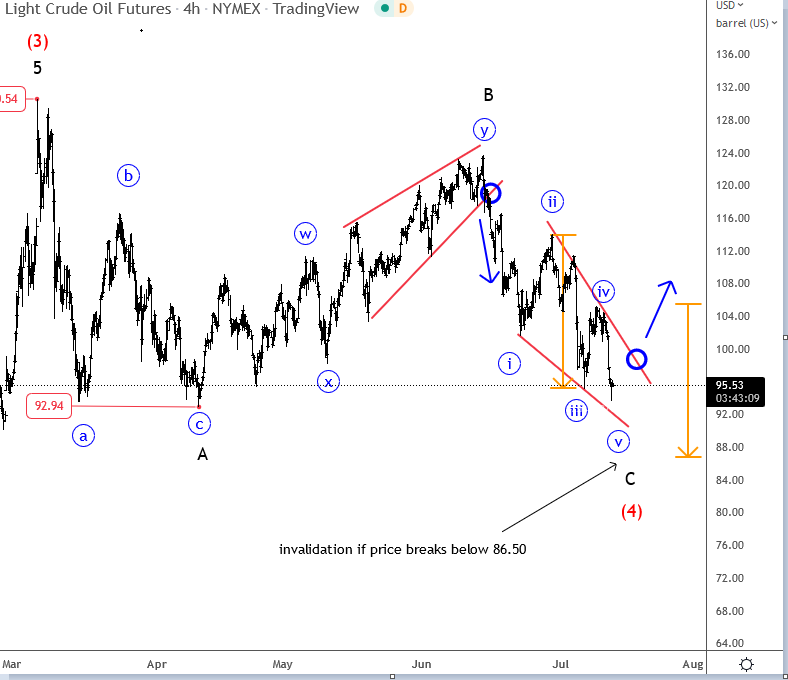
Crude oil is coming nicely down in the 4-hour chart after we spotted a wedge pattern within wave (Y) of B. So, we are now tracking wave C of a higher degree countertrend price action. We are talking about wave (4) that can be a flat rather than a triangle after recent break to a new intraday low. In fact, drop from 124 can be now counted in five waves, but it’s seen as an ending diagonal. That’s a reversal pattern that suggests that weakness can be limited. If we respect the price action and the wedge into 124.00, then confirmation for a turning point should be the same; a broken upper line that can put bulls in play (blue circle). Be patient here!
Big picture
Crude oil is bullish when looking on monthly and daily charts, but we can see it now in a higher degree corrective slow down, which can be wave four within an uptrend. There is a chance for a 2008 high retest before the market finally slows down.


