
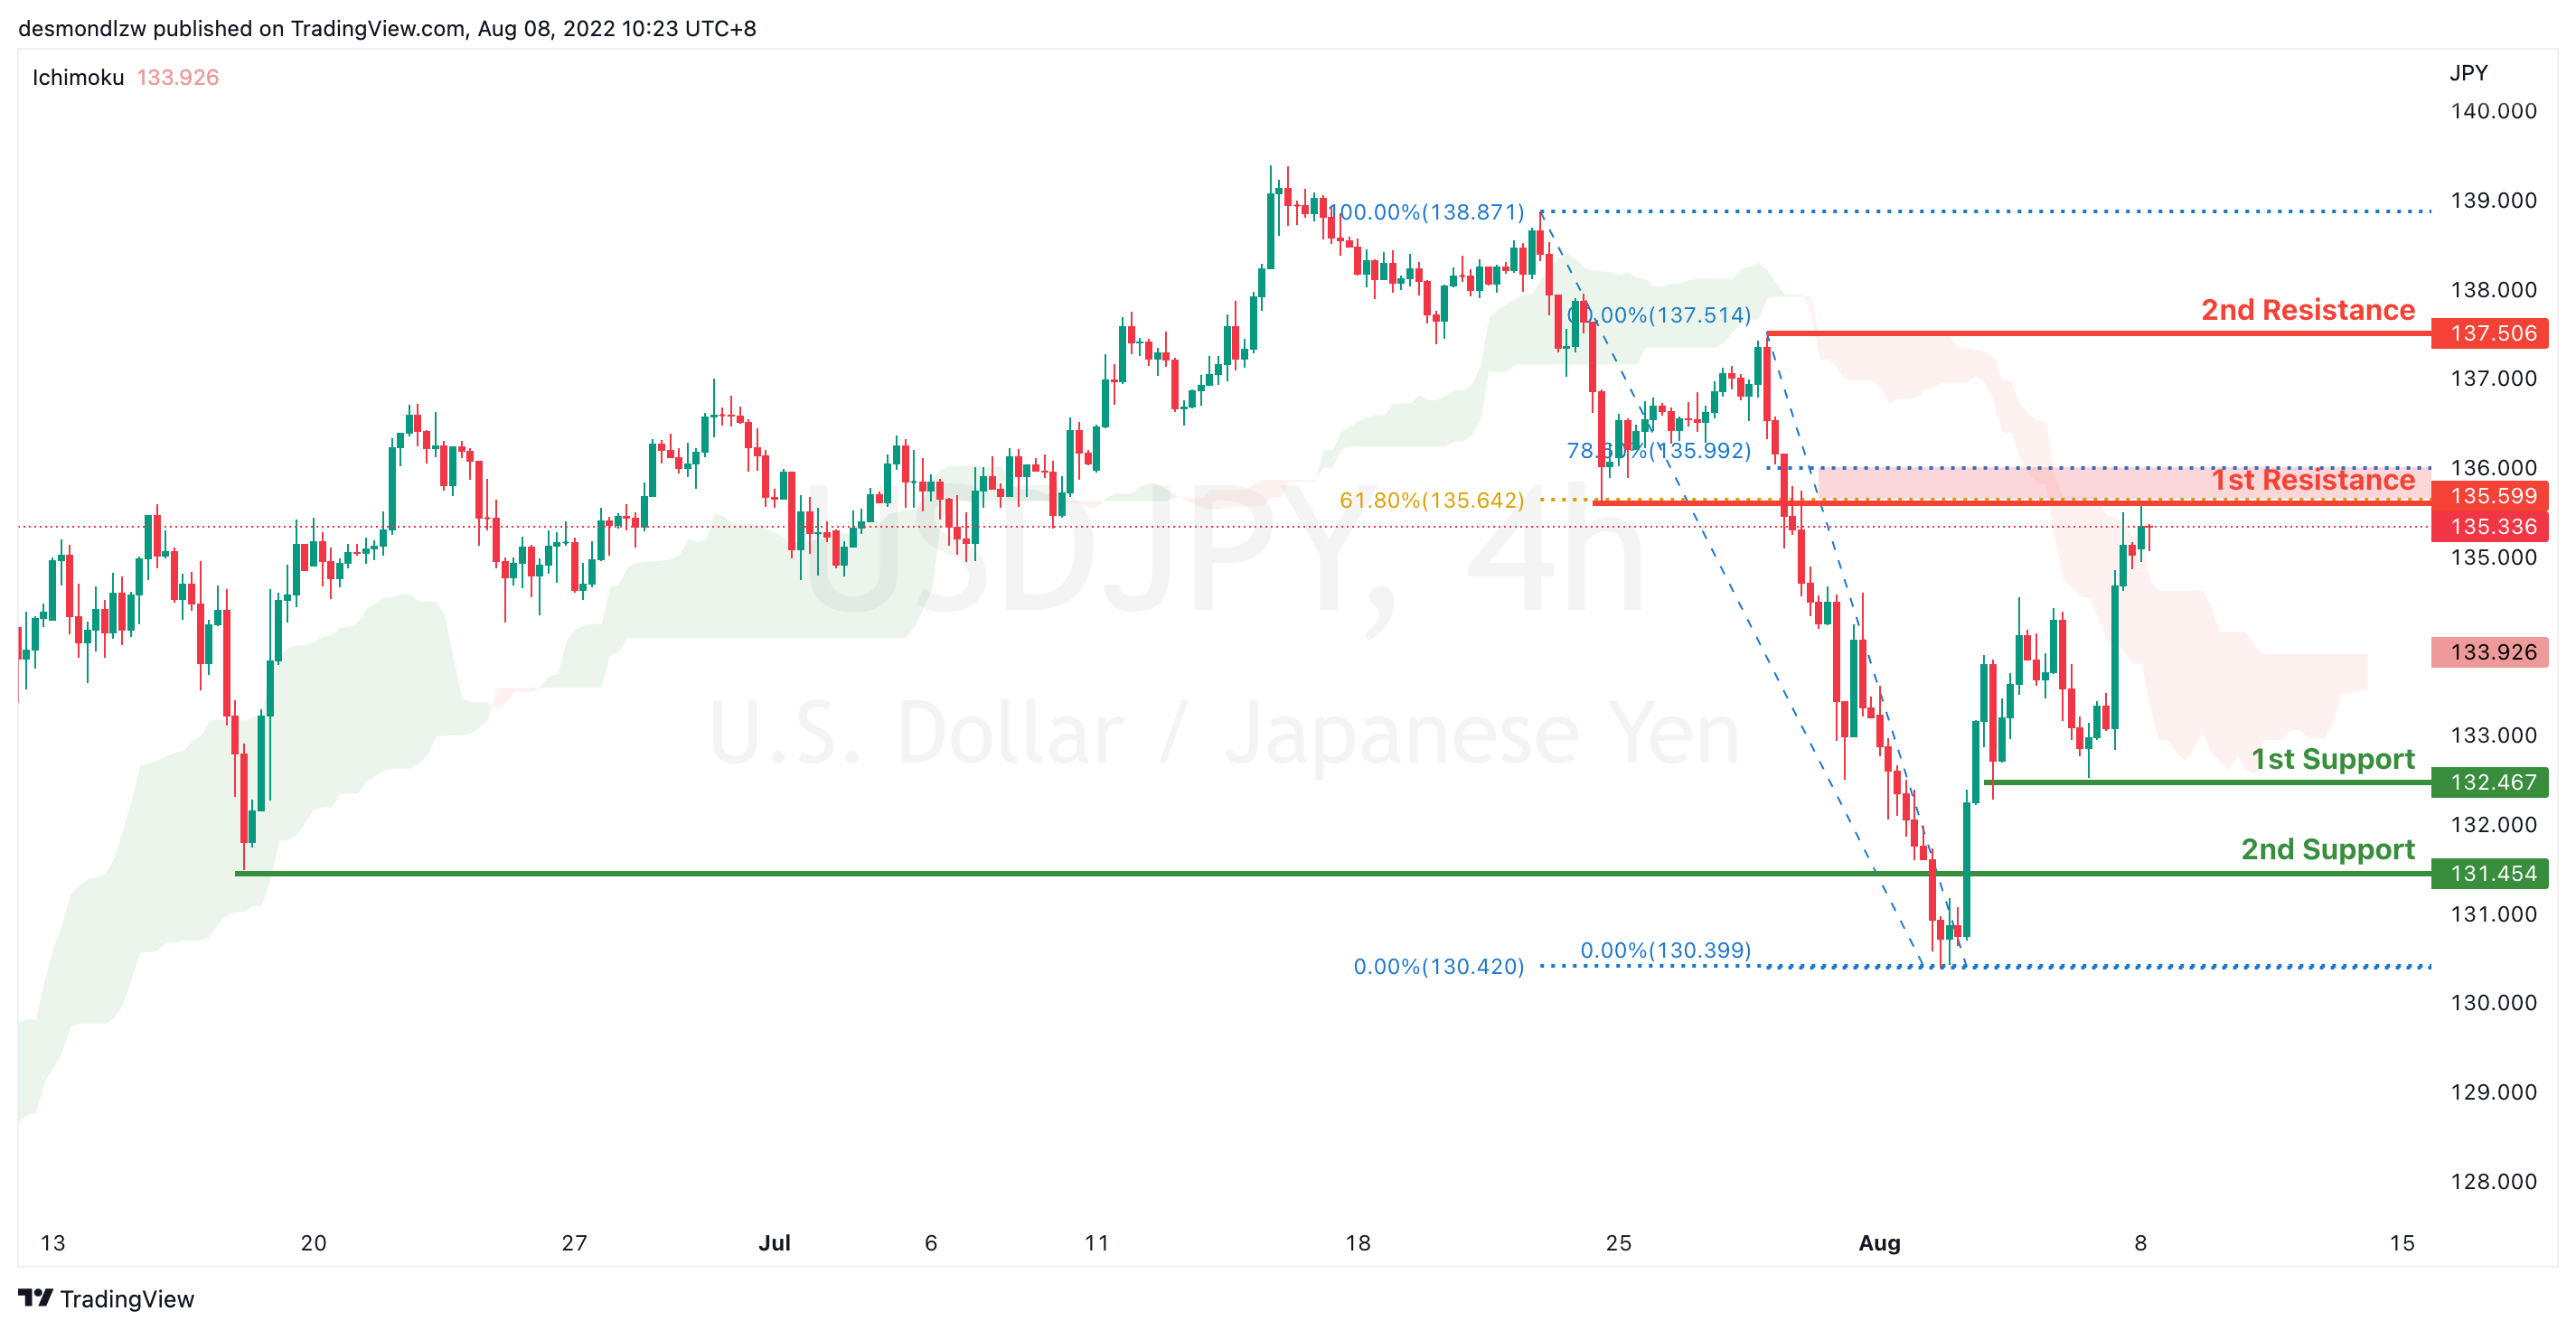
USD/JPY:
On the H4, price is bullish biased as it’s testing the first resistance at 135.599 which coincides with the 61.8% Fibonacci retracement and the previous swing low. If price breaks this level, it will move up to test at the second resistance which is the previous swing high at 137.506. Alternatively, price could pull back to test at the first support 132.467 which is the previous swing low
Areas of consideration:
- H4 time frame, 1st resistance at 137.506
- H4 time frame, 1st support at 132.467
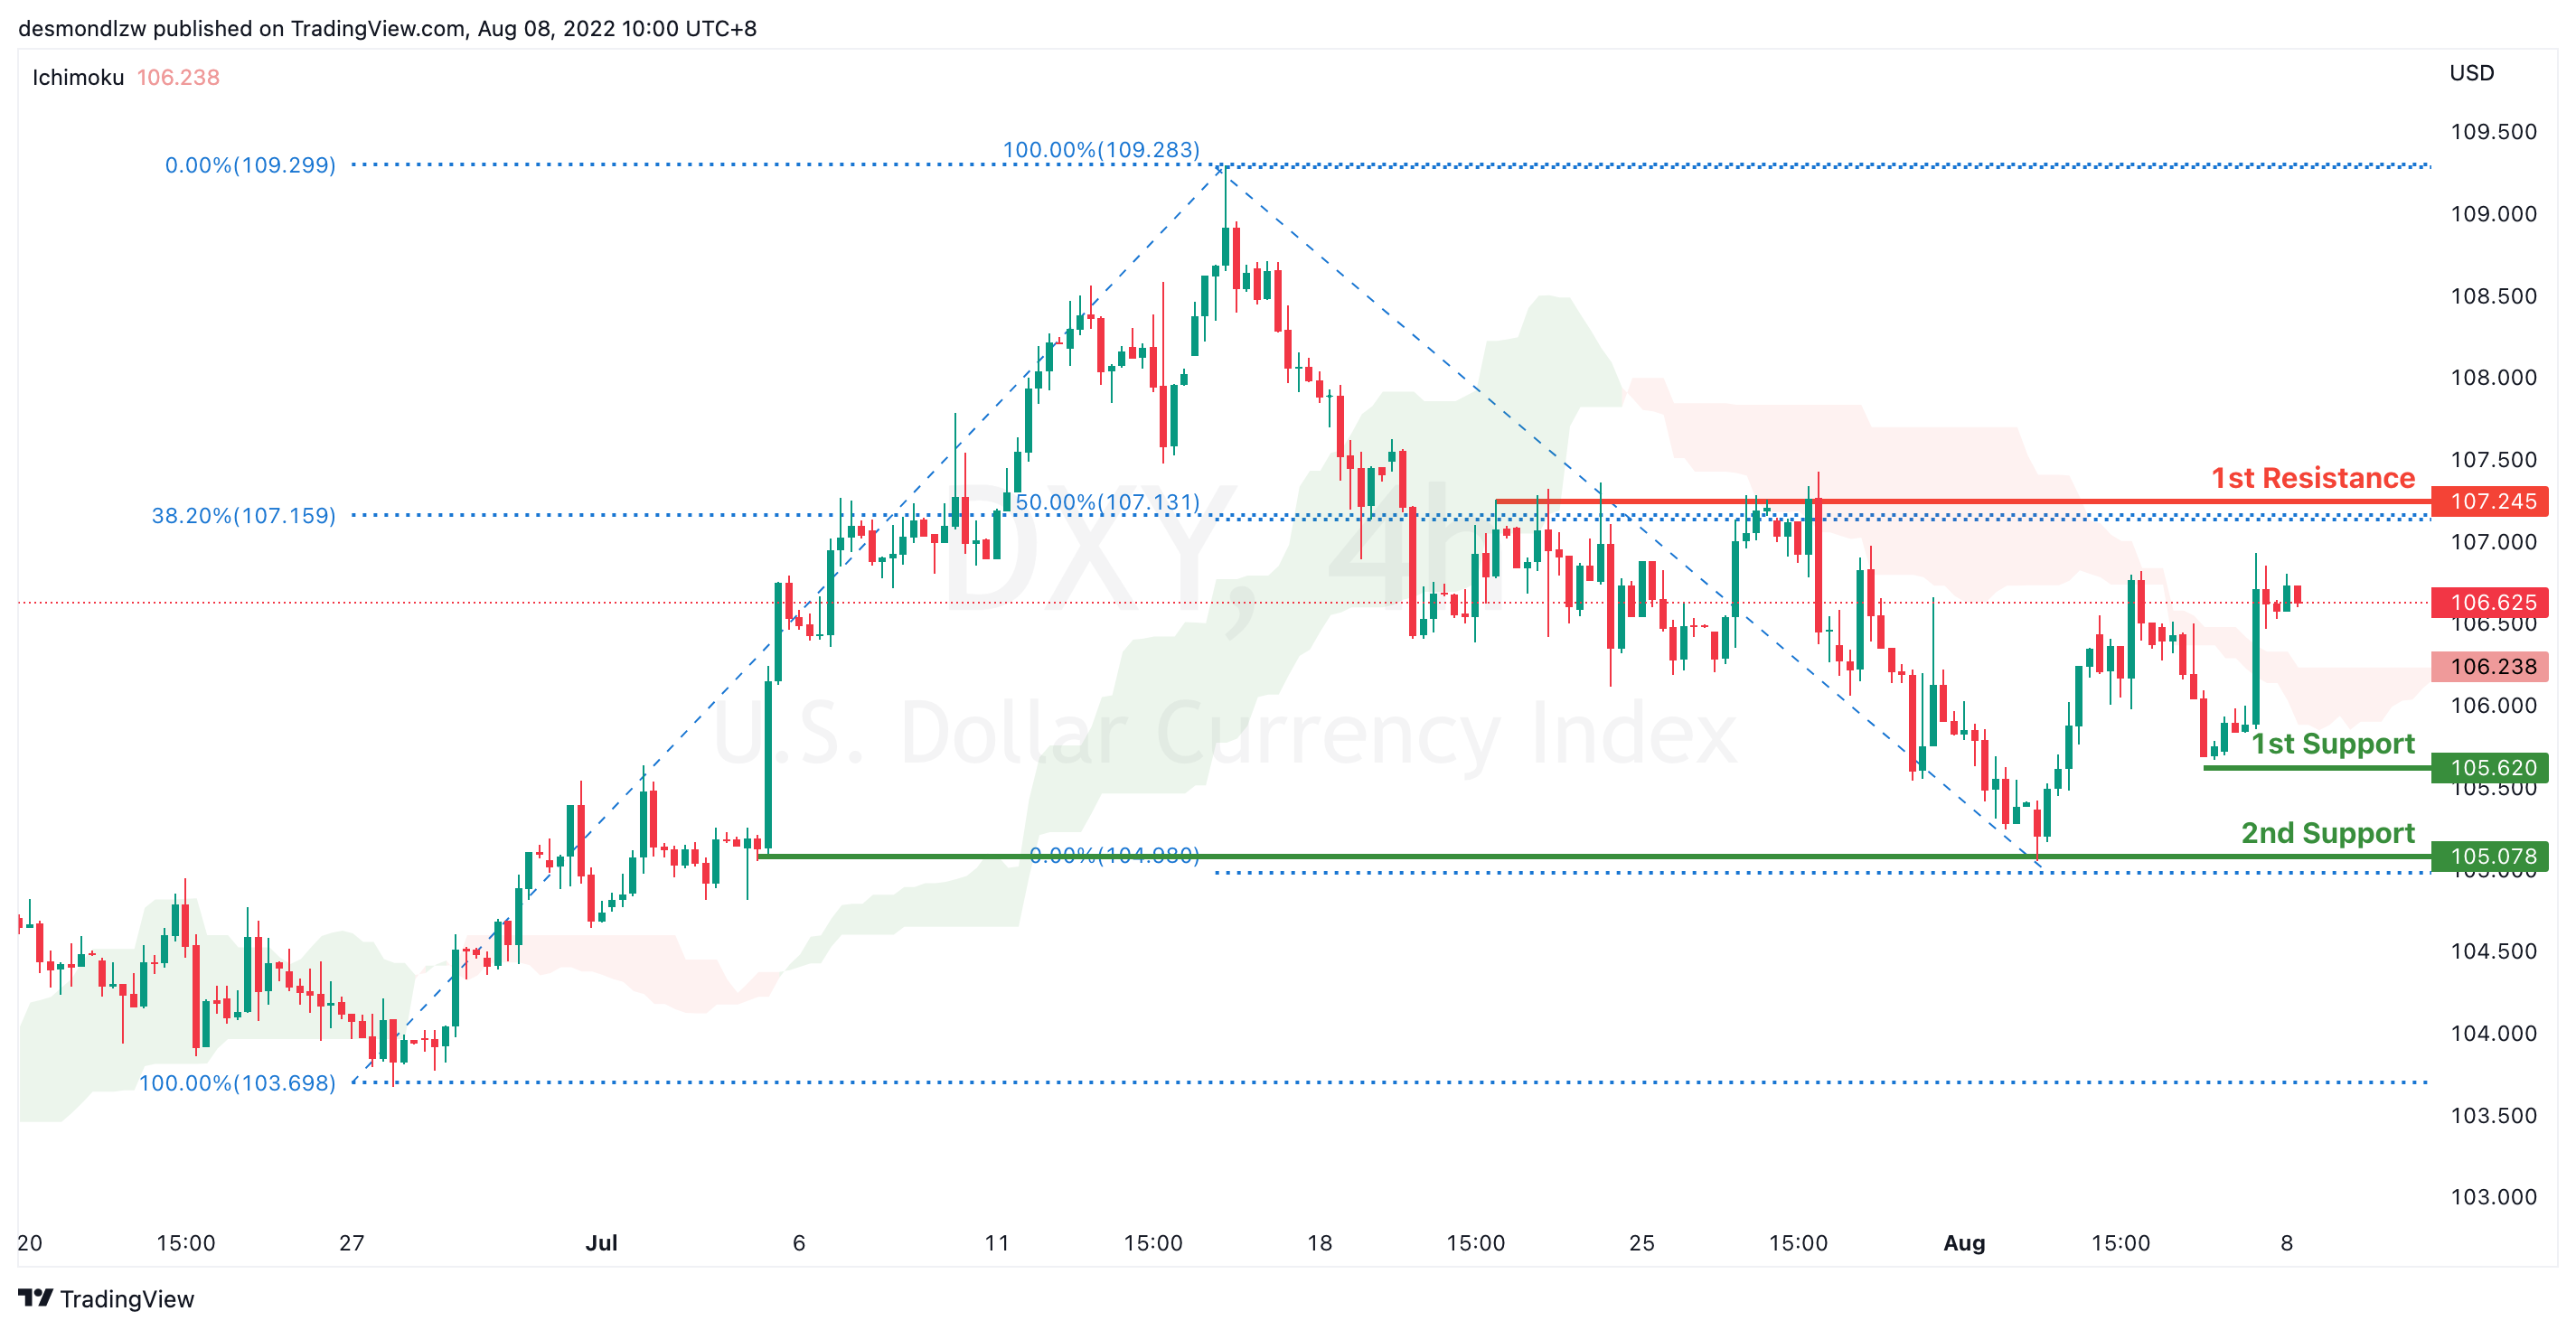
DXY:
On the H4, prices have broken the ascending trend into a bearish biased trend. Prices look like it’s pulling back to test at the first resistance 107.245 where the 38.2% Fibonacci retracement sits. If prices break the first resistance it will confirm a bullish momentum and prices will continue to move in an ascending trend. If prices movement continues in the descending trend, it will test at the first support 105.620 and then the second support at previous swing low 105.078
Areas of consideration:
- H4 time frame, 1st resistance at 107.245
- H4 time frame, 1st support at 105.620
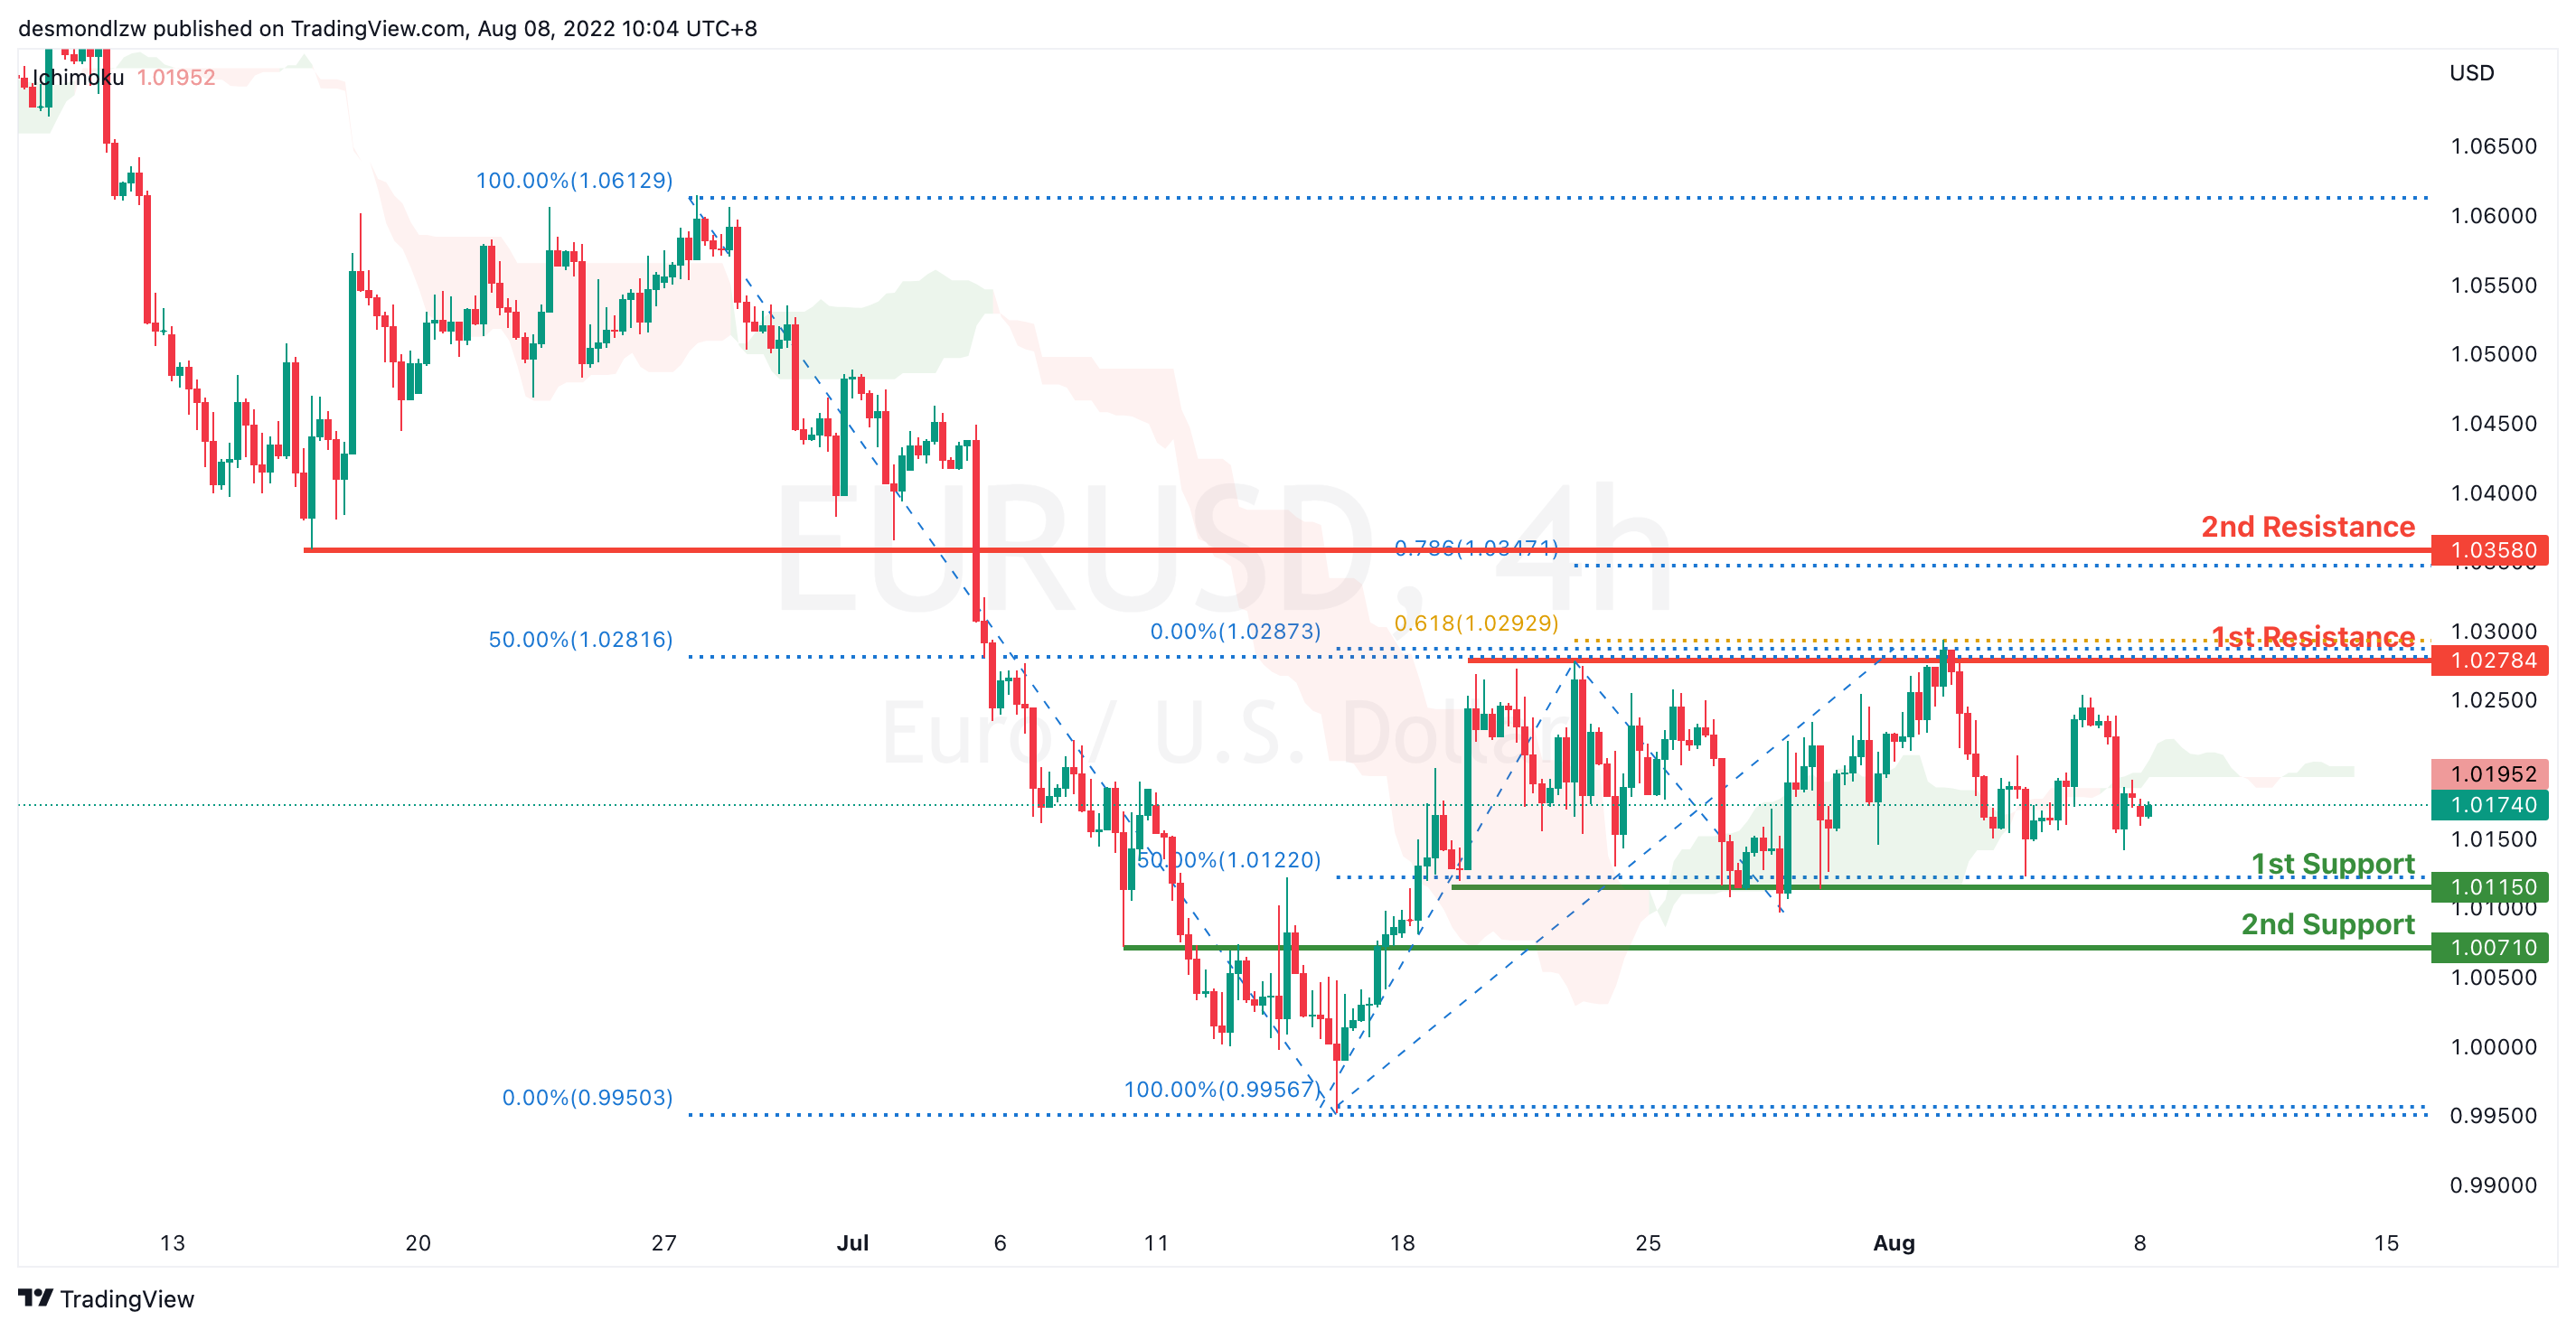
EUR/USD :
On the H4, prices have broken the bearish trend moving into a slightly bullish biased trend. Price is ranging and it seems like it’s going back to test the first support at 1.011. If prices breaks the first support, it will pull back further to test at 50% Fibonacci retracement. Alternatively, If price fails to break the first support, it will test the first resistance at 50% retracement and 61.8% fibonacci projection 1.027
Areas of consideration :
- H4 1st resistance at 1.027
- H4 1st support at 1.011
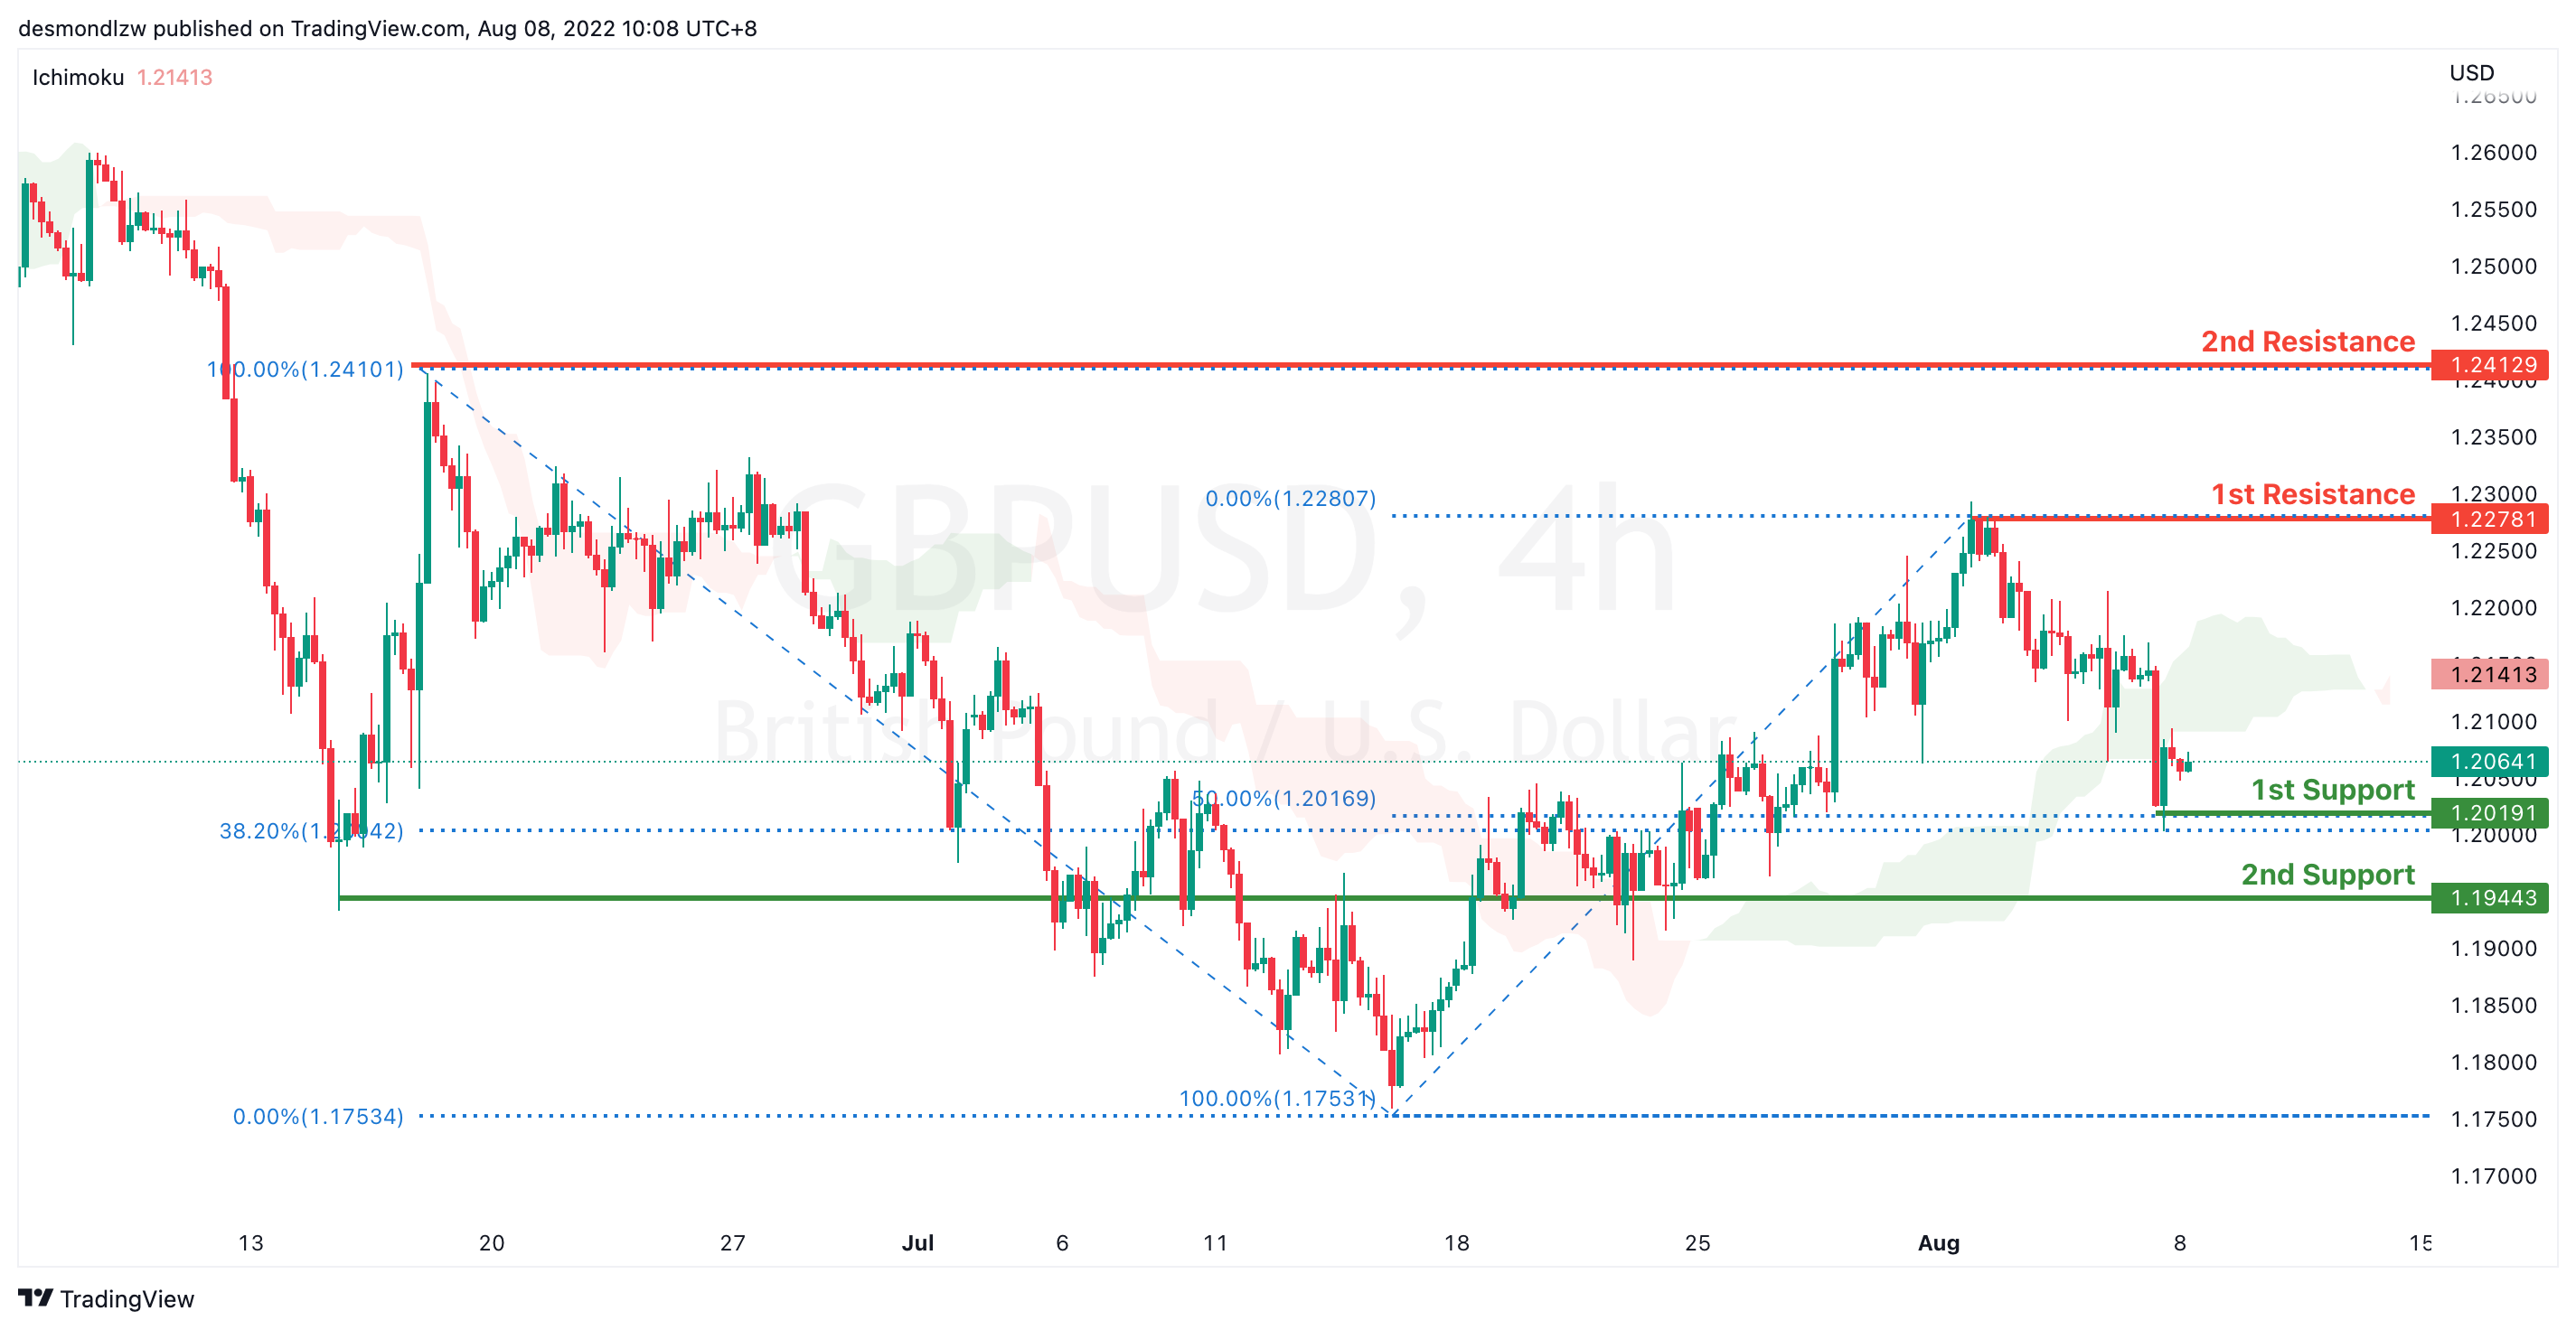
GBP/USD:
On the H4, with prices breaking the ascending channel we are now slightly bearish biased. Price is now testing the first support at 1.208 which coincides with 38.2% Fibonacci retracement. If price break supports and confirms downside trend, we would expect downside momentum to carry price to 2nd support at 1.194 61.8% Fibonacci retracement. Alternatively, price could bounce back to test at 78.6% Fibonacci retracement at 1.227
Areas of consideration:
- H4 1st resistance at 1.227
- H4 1st support at 1.2106
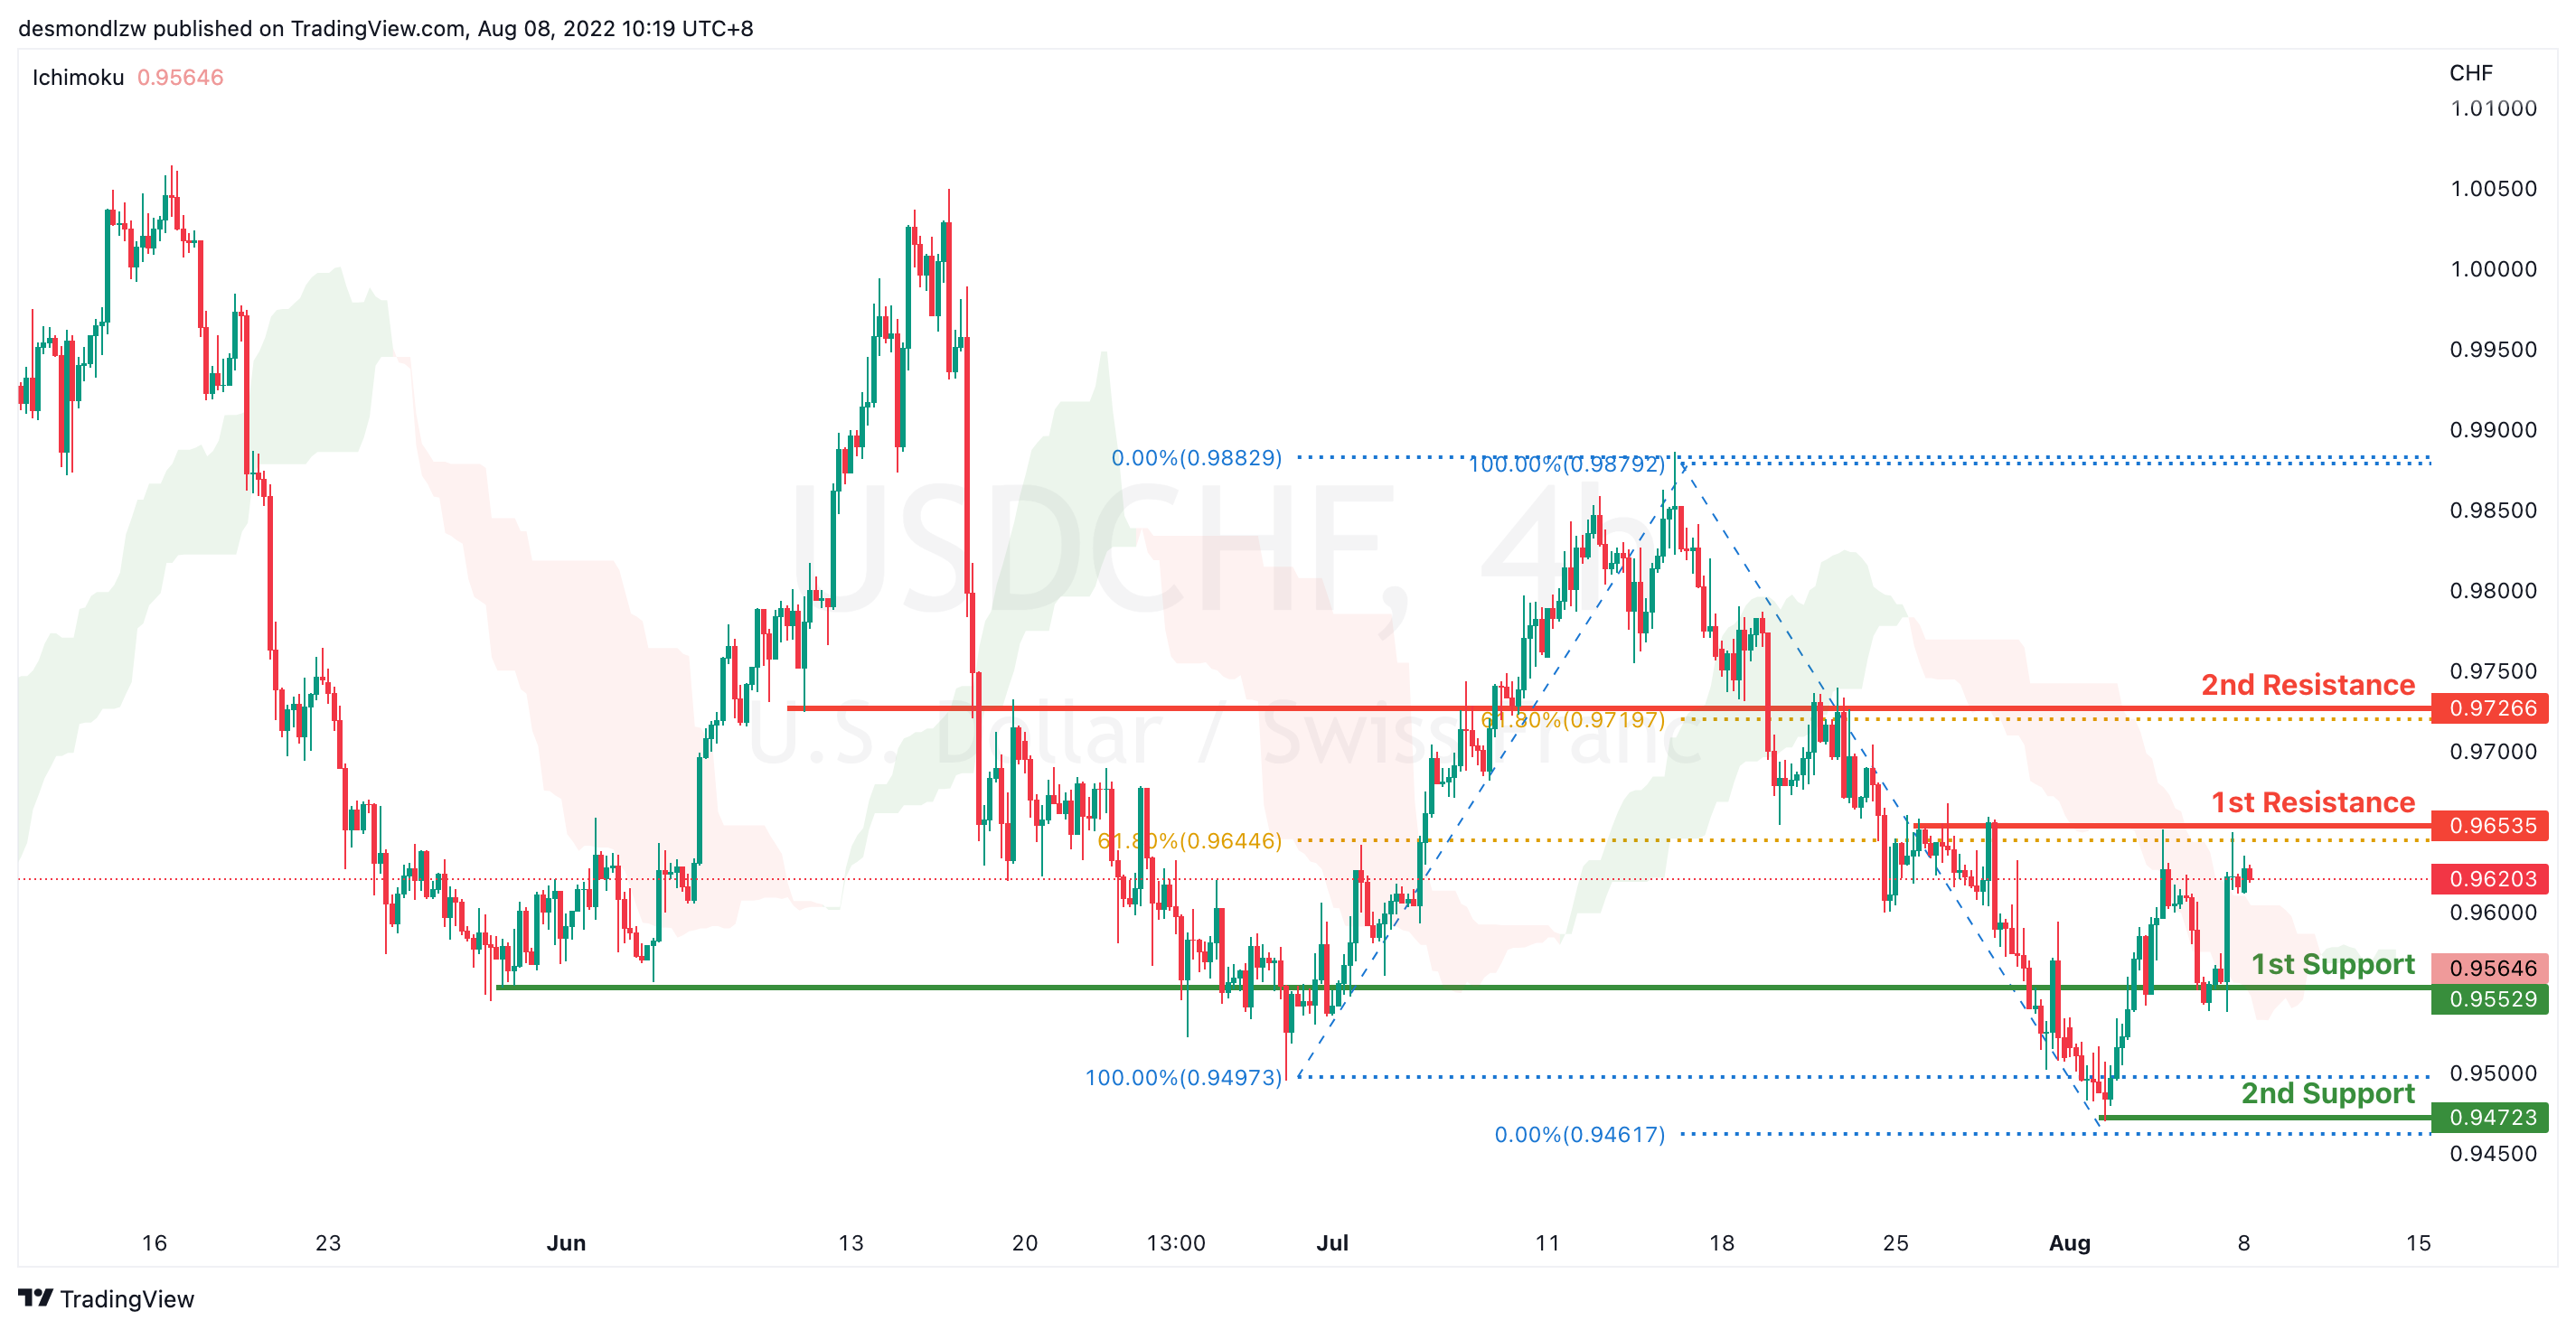
USD/CHF:
On the H4, prices have signalled a slightly bearish momentum. It has rejected the 1st resistance at 0.966 which is also the 50% Fibonacci retracement to test at the 1st support 0.955 23.6% fibonacci retracement. If prices break this key level, it will pull back further to test at the second support at 0.947. Alternatively price could bounce back to test at 1st resistance 0.965 subsequently the second resistance at 0.97266
Areas of consideration
- H4 1st resistance at 0.965
- H4 1st support at 0.955
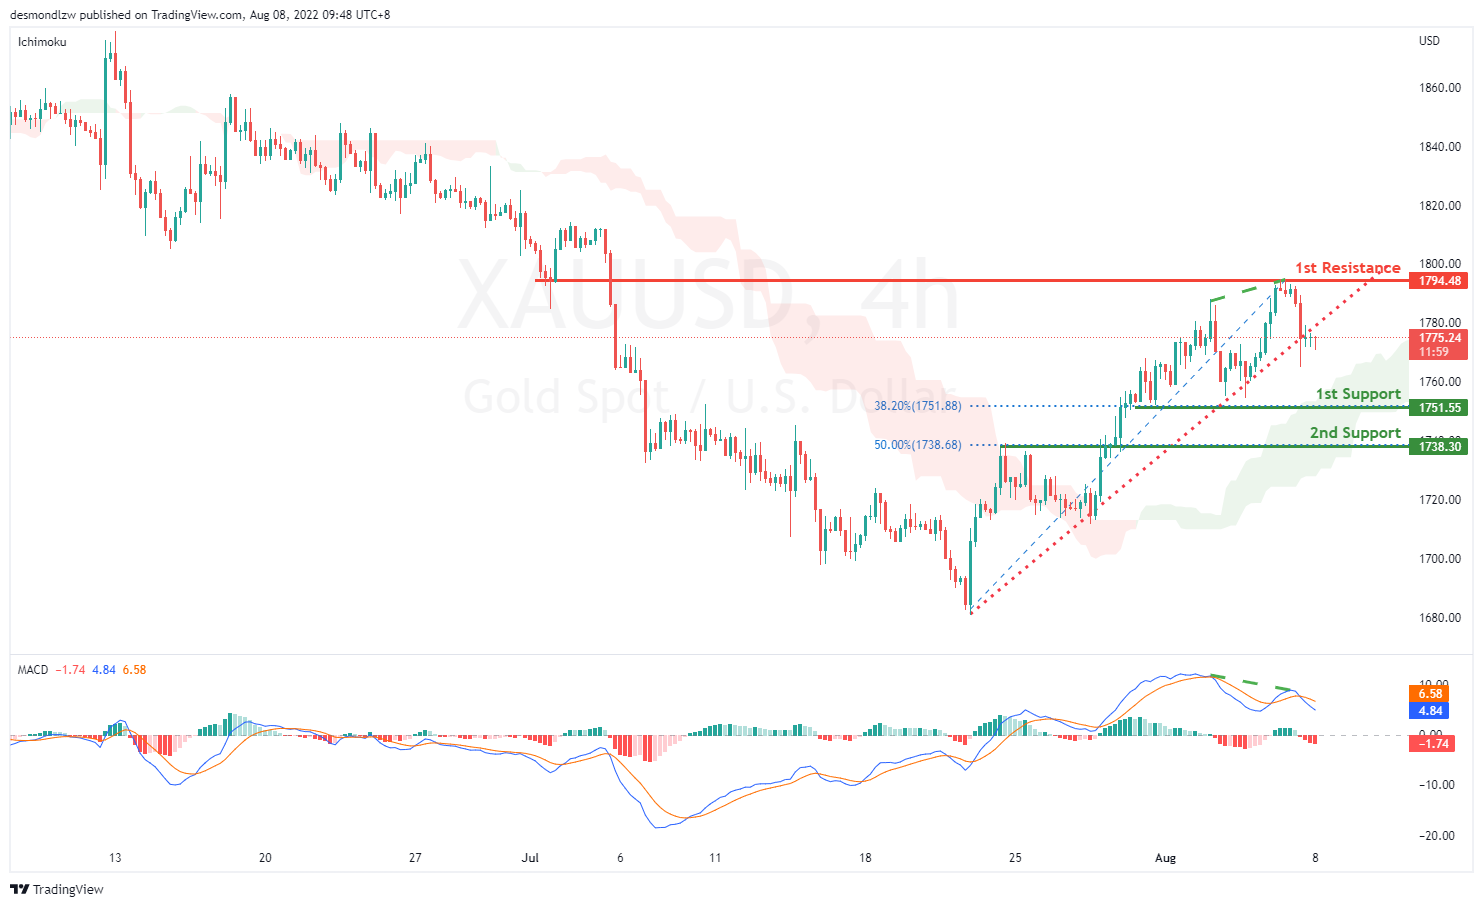
XAU/USD (GOLD):
On the H4, with prices breaking the ascending trendline, and the price and MACD is showing a bearish divergence, we have a bearish bias that the price may drop to the 1st support at 1751.55, which is in line with the 38.2% fibonacci retracement. If the price continues going down, it may drop to 2nd support at 1738.30, which is in line with 50% fibonacci retracement. Alternatively, prices may rise to 1st resistance at 1794.48,,which is in line with the swing high.
Areas of consideration:
- H4 time frame, 1st support at 1751.55
- H4 time frame, 2nd support at 1738.30
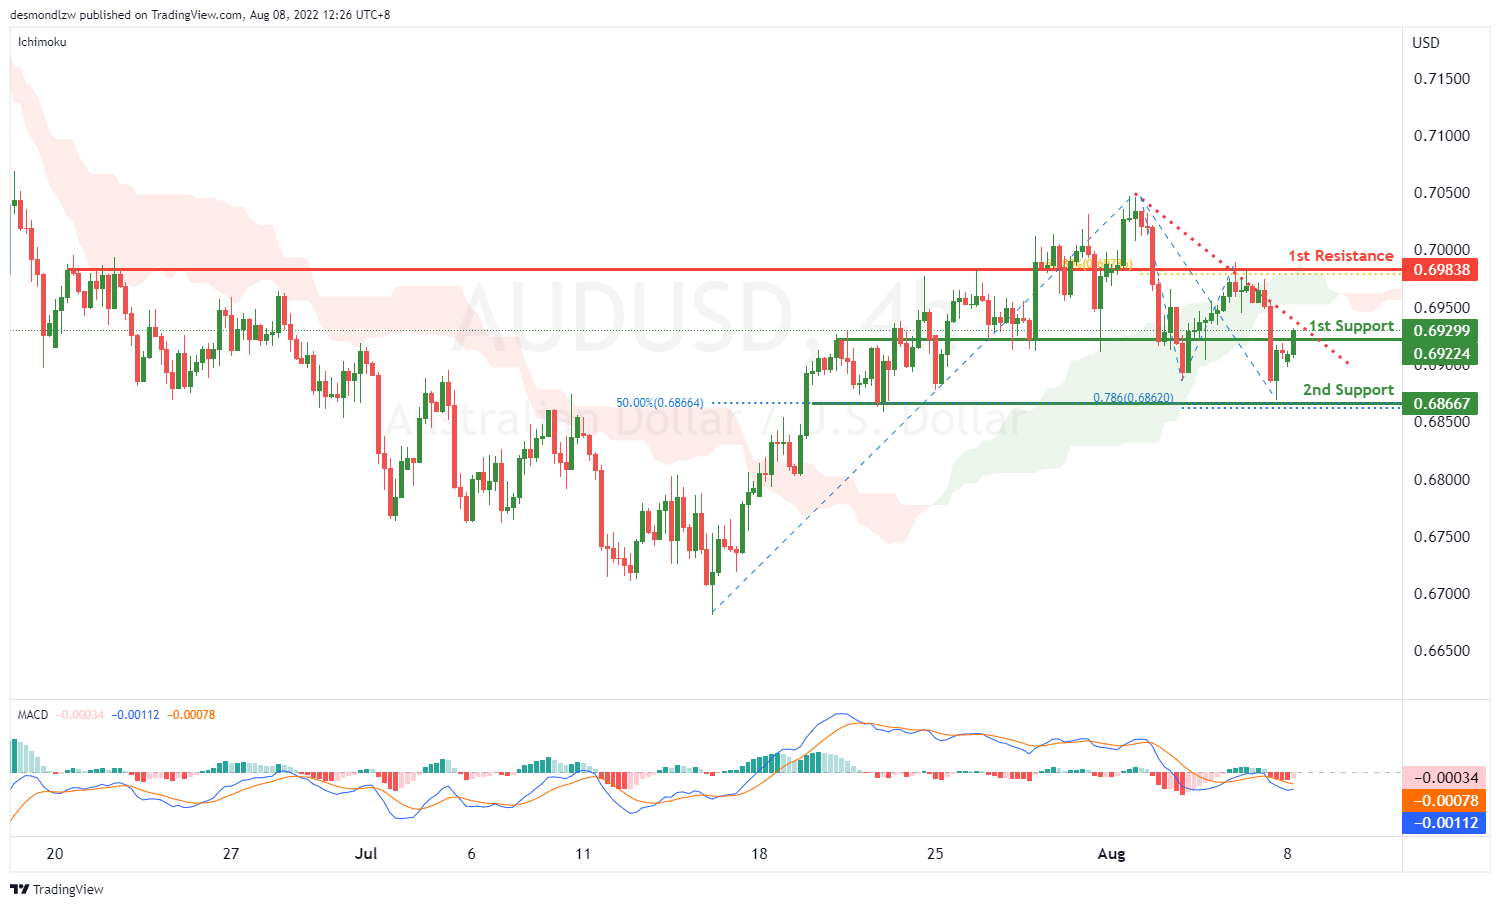
AUD/USD:
On the H4, with price going along the descending trendline, below the ichimoku cloud and the DIF line is breaking below the signal line in MACD, we have a bearish bias that price may drop from the 1st support at 0.69224, where the pullback support is to the 2nd support at 0.68667 where the 50% fibonacci retracement and 78.6% fibonacci projection are. Alternatively, price may rise to the 1st resistance at 0.69838 which is in line with 61.8% fibonacci retracement and swing highs.
Areas of consideration
- H4 1st support at 0.69224
- H4 2nd support at 0.68667
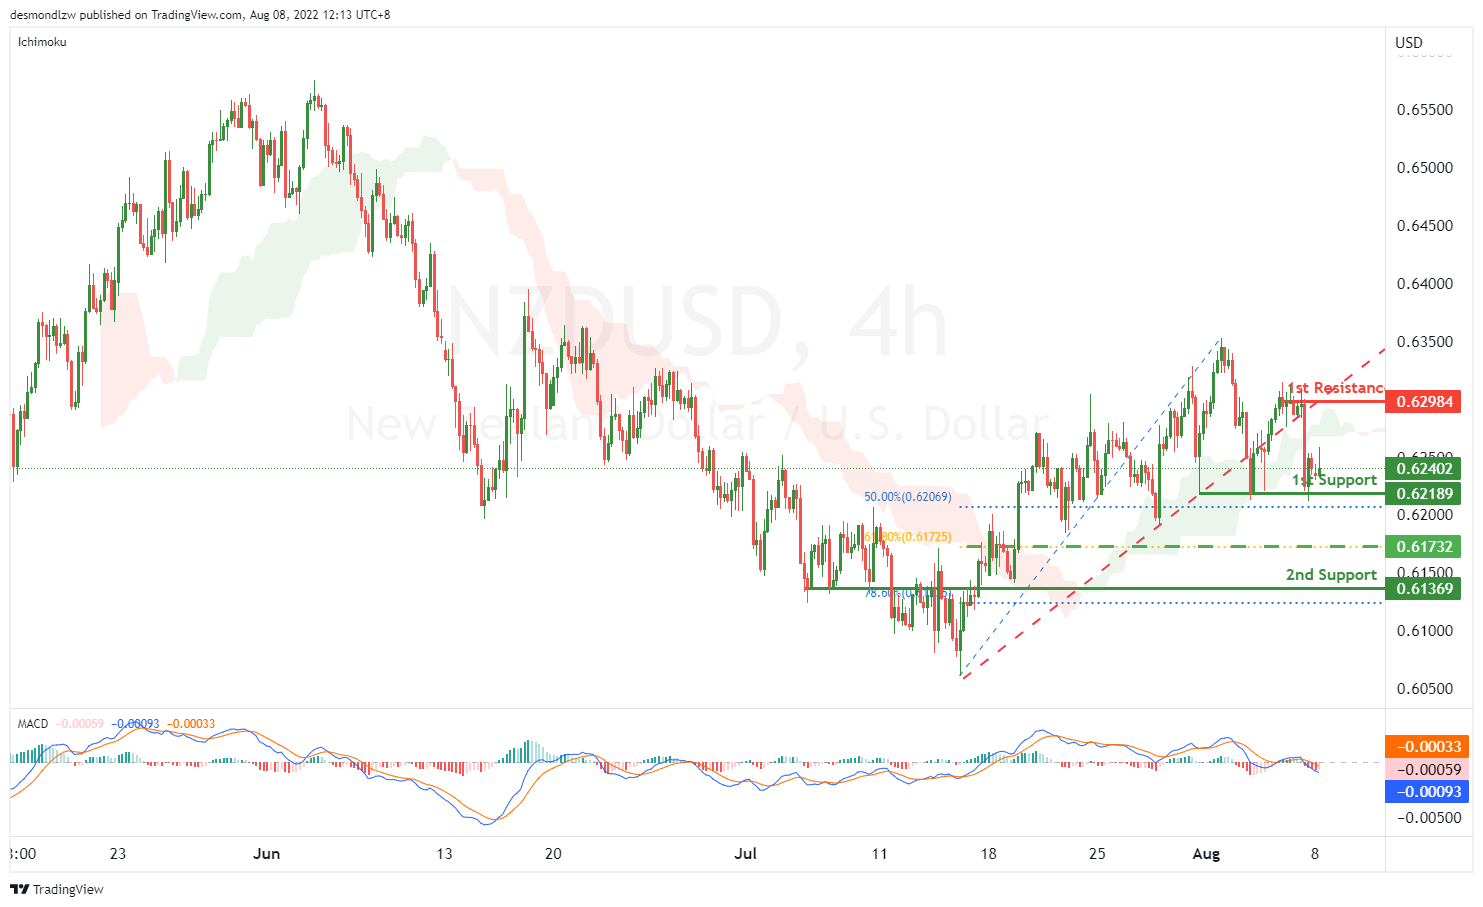
NZD/USD:
On the H4, with price breaking the ascending trendline, the DIF line is breaking the signal line, we have a bearish bias that price may rise from the 1st support at 0.62189 where overlap support and 50% fibonacci retracement to the 2nd support at 0.61369 where 78.6% fibonacci retracement is. Alternatively, price may reverse off the 1st support and rise to 1st resistance at 0.62984 where the swing high resistance is. Take note the price of 0.61732 could be our intermediate support, which is in line with 61.8% fibonacci retracement.
Areas of consideration:
- H4 time frame, 1st support at 0.62189
- H4 time frame, 2nd support at 0.61369
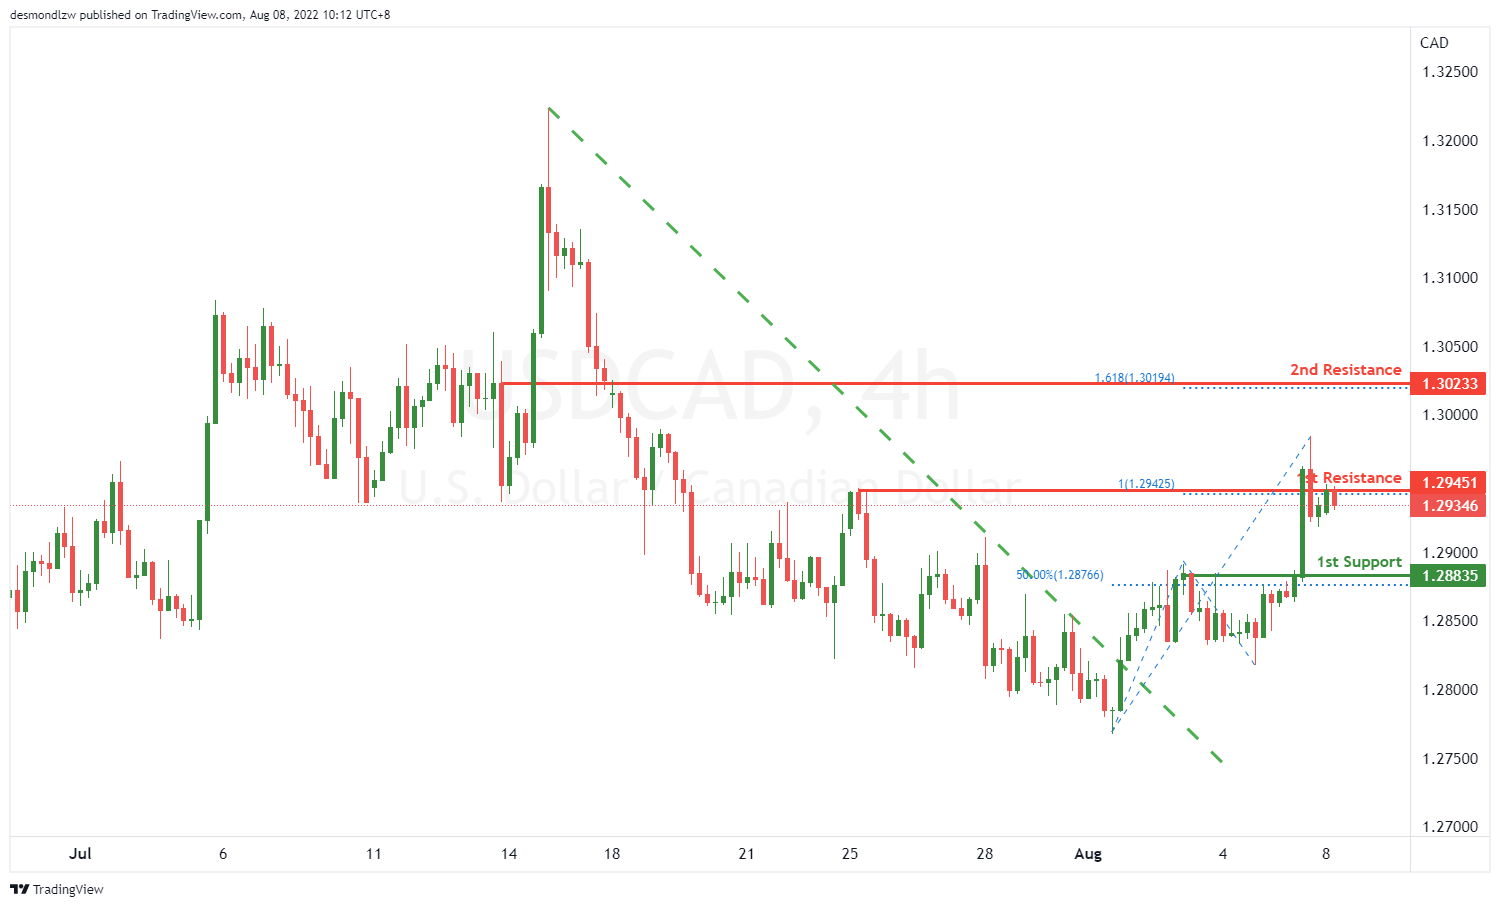
USD/CAD:
On the H4, with the price breaking the descending trendline and below ichimoku cloud, we have a bullish bias that the price may rise from our 1st resistance at 1.29451, which is in line with 100% fibonacci projection to our 2nd resistance at 1.30233, which is in line with the 161.8% fibonacci projection. Alternatively, the price may drop to the 1st support at 1.28835, which is in line with 50% fibonacci retracement and pullback support.
Areas of consideration:
- H4 time frame, 1st resistance at 1.29451
- H4 time frame, 2nd resistance at 1.30233
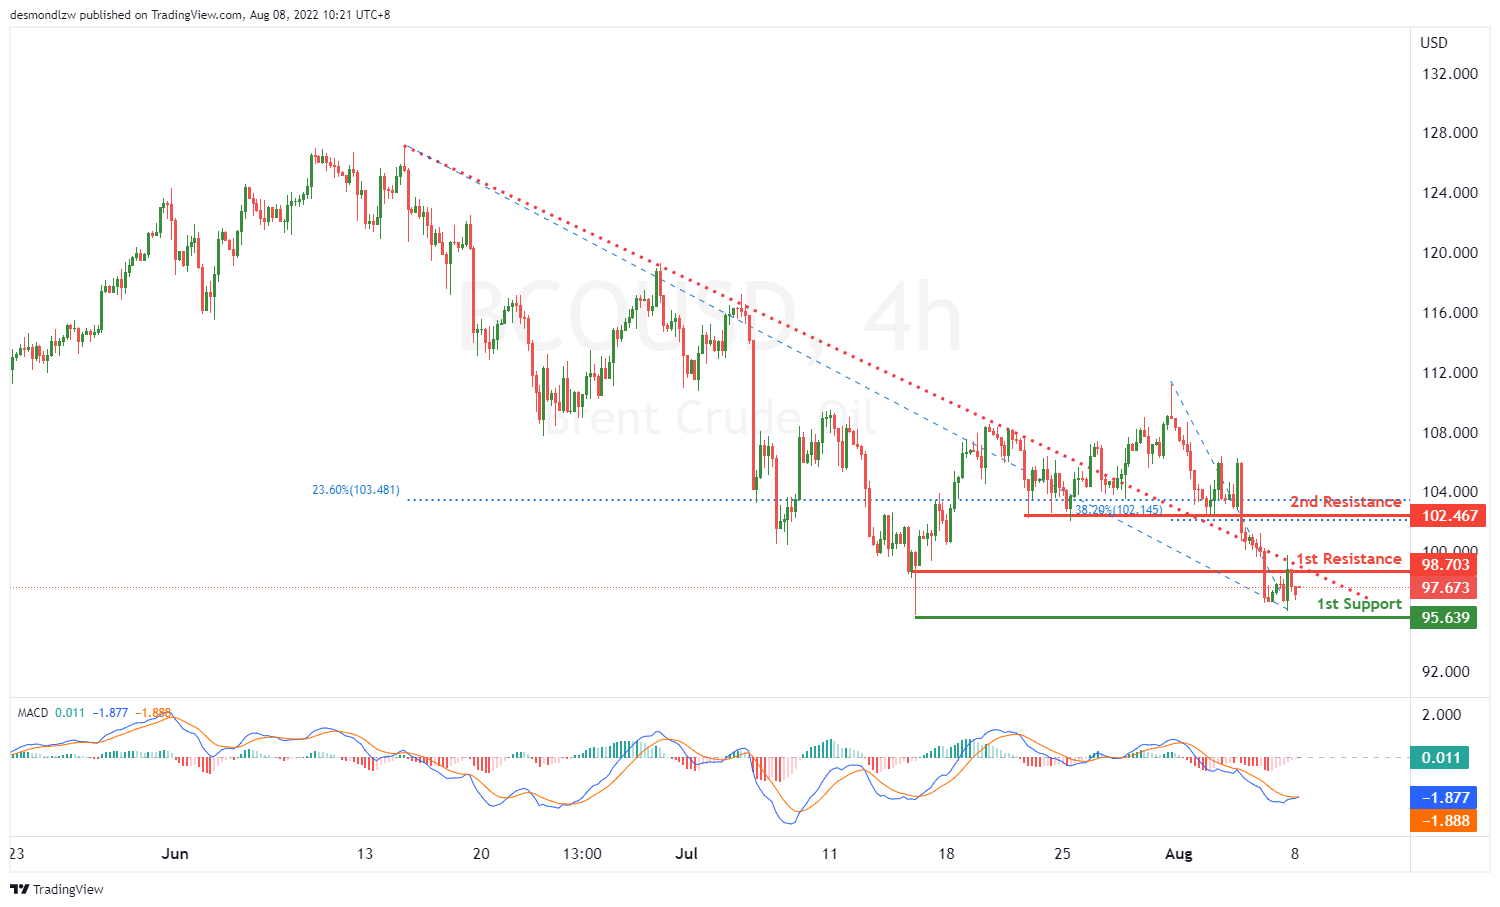
OIL:
On the H4, with price almost touching the descending trendline, and the histogram of MACD is decreasing under zero while the DIF is breaking the DEA, we have a bullish bias that the price may rise from our 1st resistance at 98.703, which is in line with the overlap resistance to the 2nd resistance at 102.467, which is in line with the 23.6% fibonacci retracement and 38.2% fibonacci retracement. Otherwise, the price may drop to our 1st support at 95.639, where the swing low support is.
Areas of consideration:
- H4 time frame, 1st resistance at 98.703
- H4 time frame, 2nd resistance at 102.467
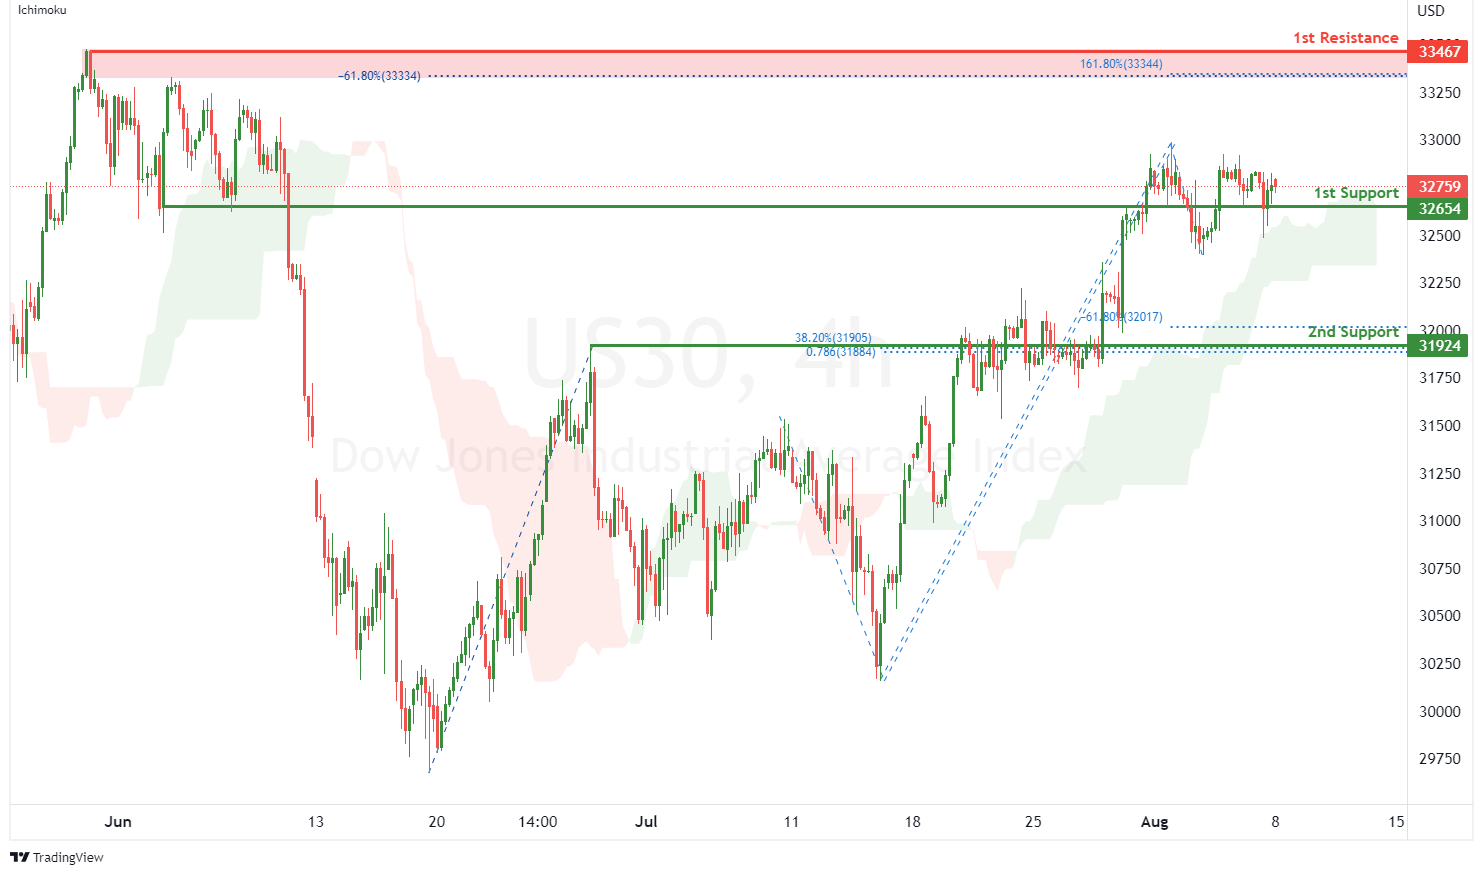
Dow Jones Industrial Average:
On the H4, with price moving above the ichimoku indicator, we have a bullish bias that price will rise from the 1st support at 32654 where the pullback support is to the 1st resistance at 33467 where the swing high resistance, 161.8% fibonacci extension and -61.8% fibonacci expansion are. Alternatively, price could break 1st support structure and drop to 2nd support at 31924 where the pullback support, -61.8% fibonacci expansion, 38.2% fibonacci retracement and 78.6% fibonacci projection are.
Areas of consideration:
- H4 time frame, 1st resistance of 33467
- H4 time frame, 1st support at 32654
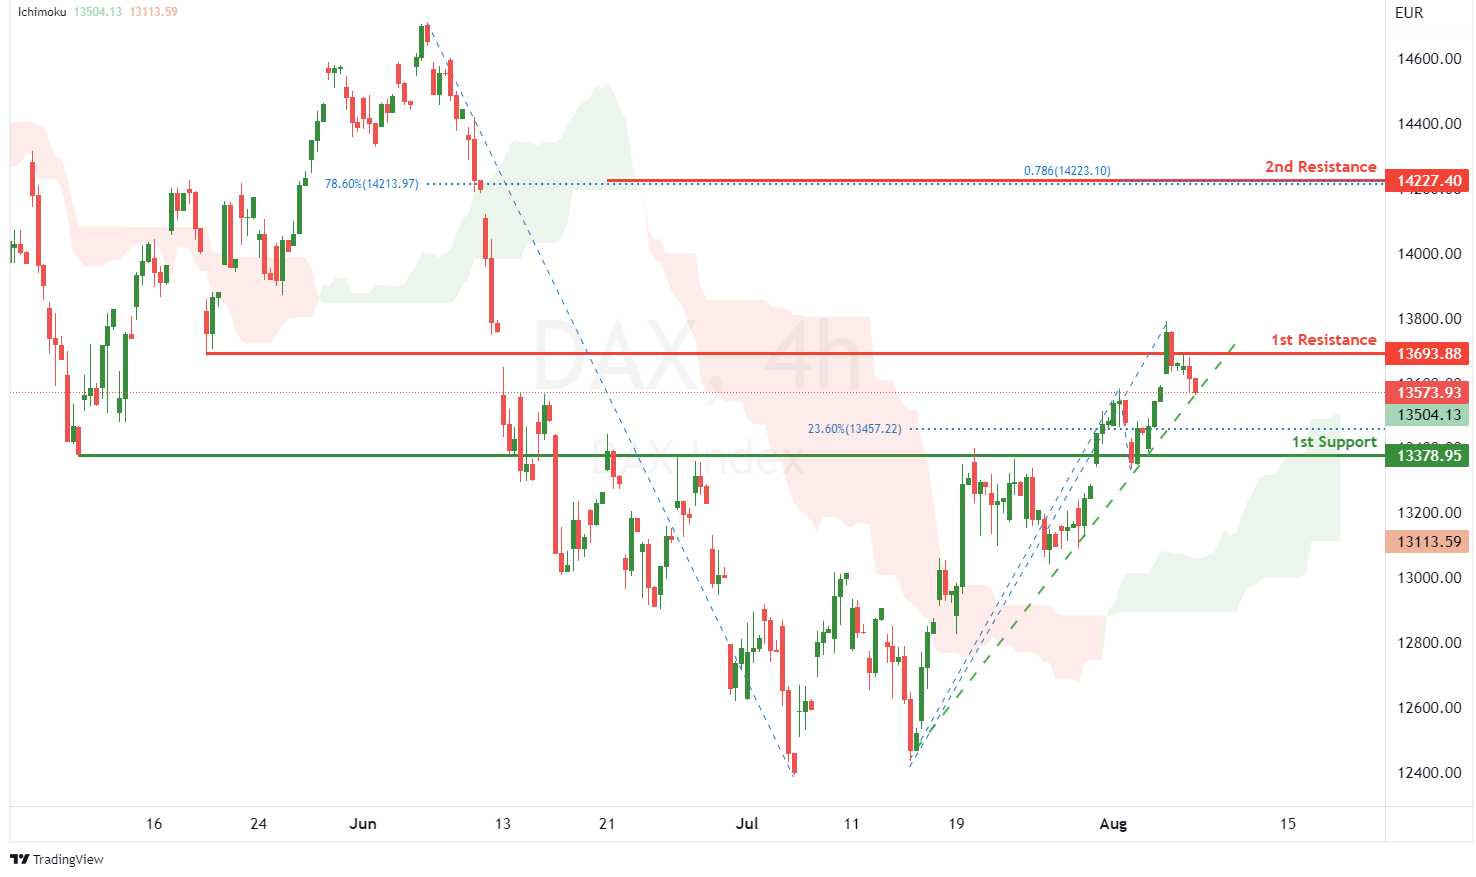
DAX:
On the H4, with price moving above the ichimoku indicator and along the ascending trendline, we have a bullish bias that price will rise to 1st resistance at 13693.88 where the pullback resistance is. Once there is upside confirmation of price breaking 1st resistance structure, we would expect bullish momentum to carry price to 2nd resistance at 14227.40 in line with 78.6% fibonacci projection and 78.6% fibonacci retracement. Alternatively, price could drop to 1st support at 13378.95 where the overlap support and 23.6% fibonacci retracement are.
Areas of consideration:
- H4 time frame, 1st resistance of 13693.88
- H4 time frame, 1st support at 13378.95
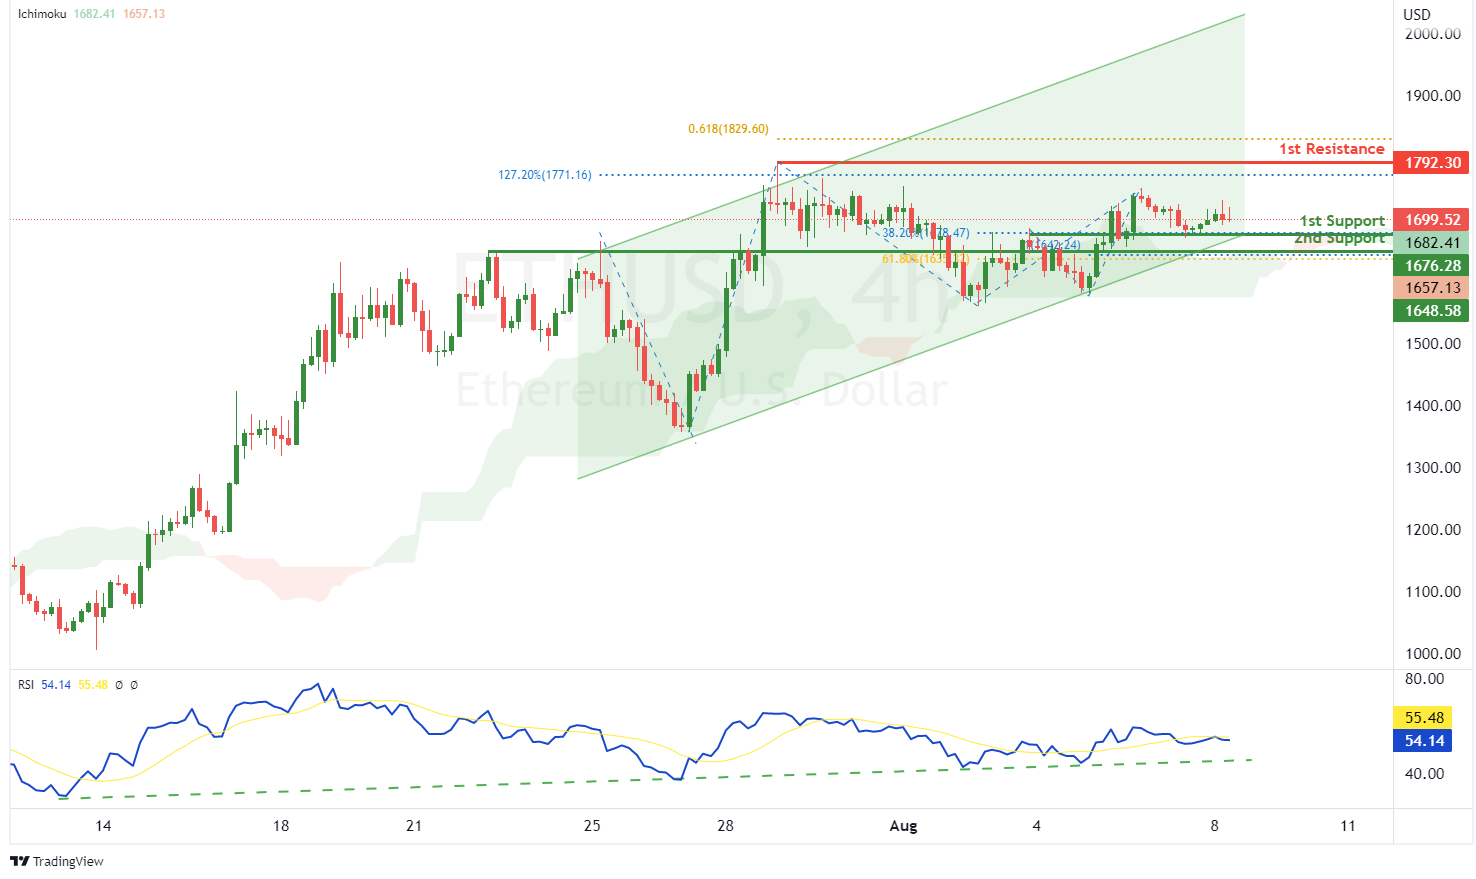
ETHUSD:
On the H4, with RSI moving along an ascending trendline and price moving within an ascending channel as well as above the ichimoku indicator, we have a bullish bias that price will rise from 1st support at 1676.28 where the pullback support and 38.2% fibonacci retracement are to the 1st resistance at 1792.30 where the swing high resistance, 127.2% fibonacci extension and 61.8% fibonacci projection are. Alternatively, price could break 1st support and drop to 2nd support at 1648.58 where the overlap support, 61.8% fibonacci retracement and 100% fibonacci projection are.
Areas of consideration:
- H4 time frame, 1st resistance of 1792.30
- H4 time frame, 1st support at 1676.28
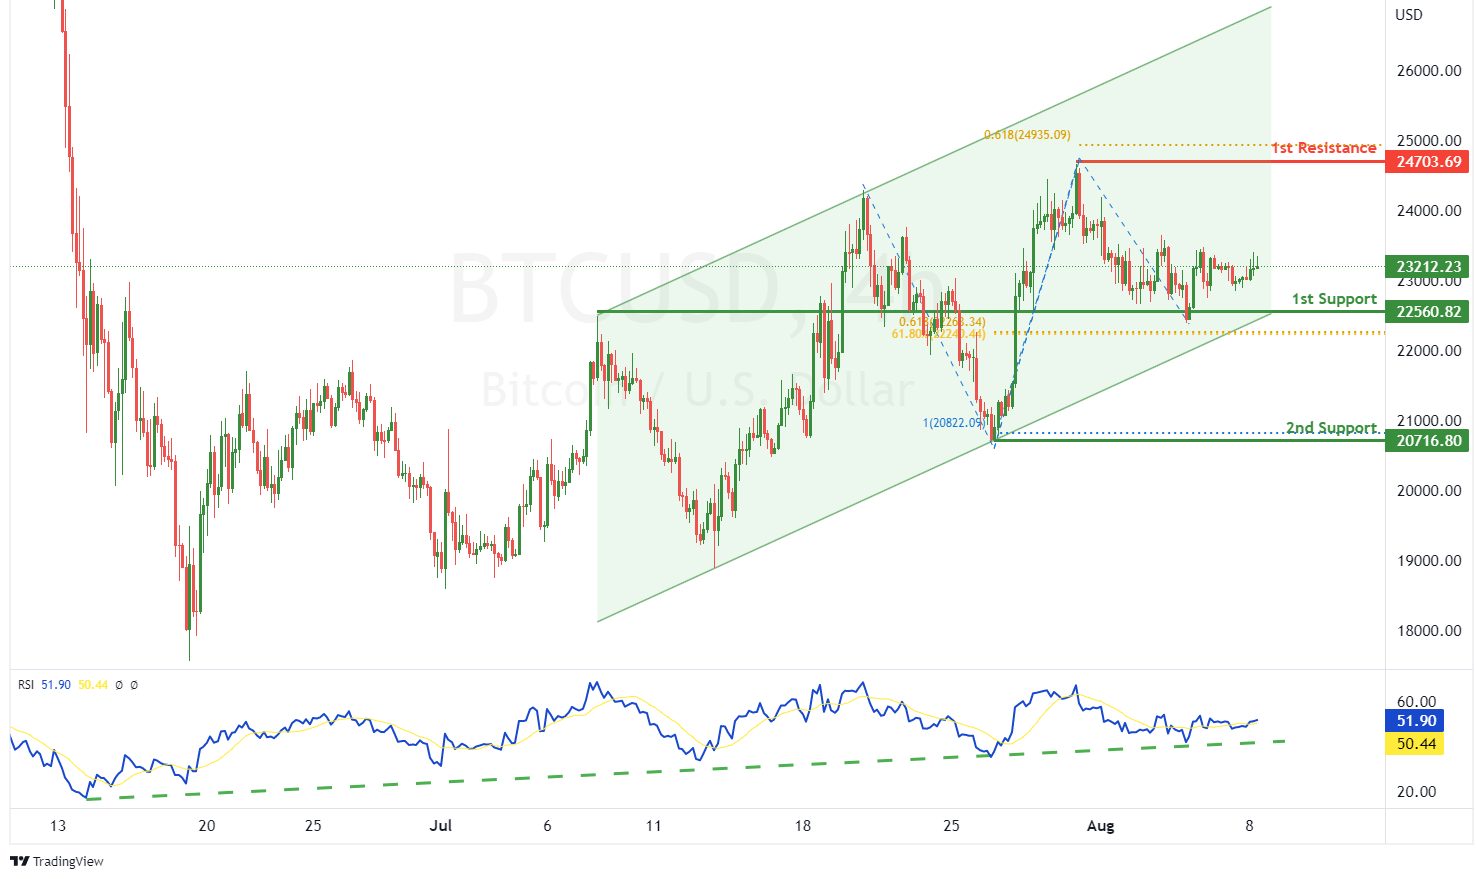
BTCUSD:
On the H4, with price moving within a bullish channel and RSI moving along an ascending trendline, we have a bullish bias that price will rise from our 1st support at 22560.82 where the pullback support, 61.8% fibonacci retracement and 61.8% fibonacci projection are to the 1st resistance at 24703.69 where the swing high resistance and 61.8% fibonacci projection are. Alternatively, price could break 1st support structure and drop to 2nd support at 20716.80 where the swing low support and 100% fibonacci projection are.
Areas of consideration:
- H4 time frame, 1st resistance of 24703.69
- H4 time frame, 1st support at 22560.82
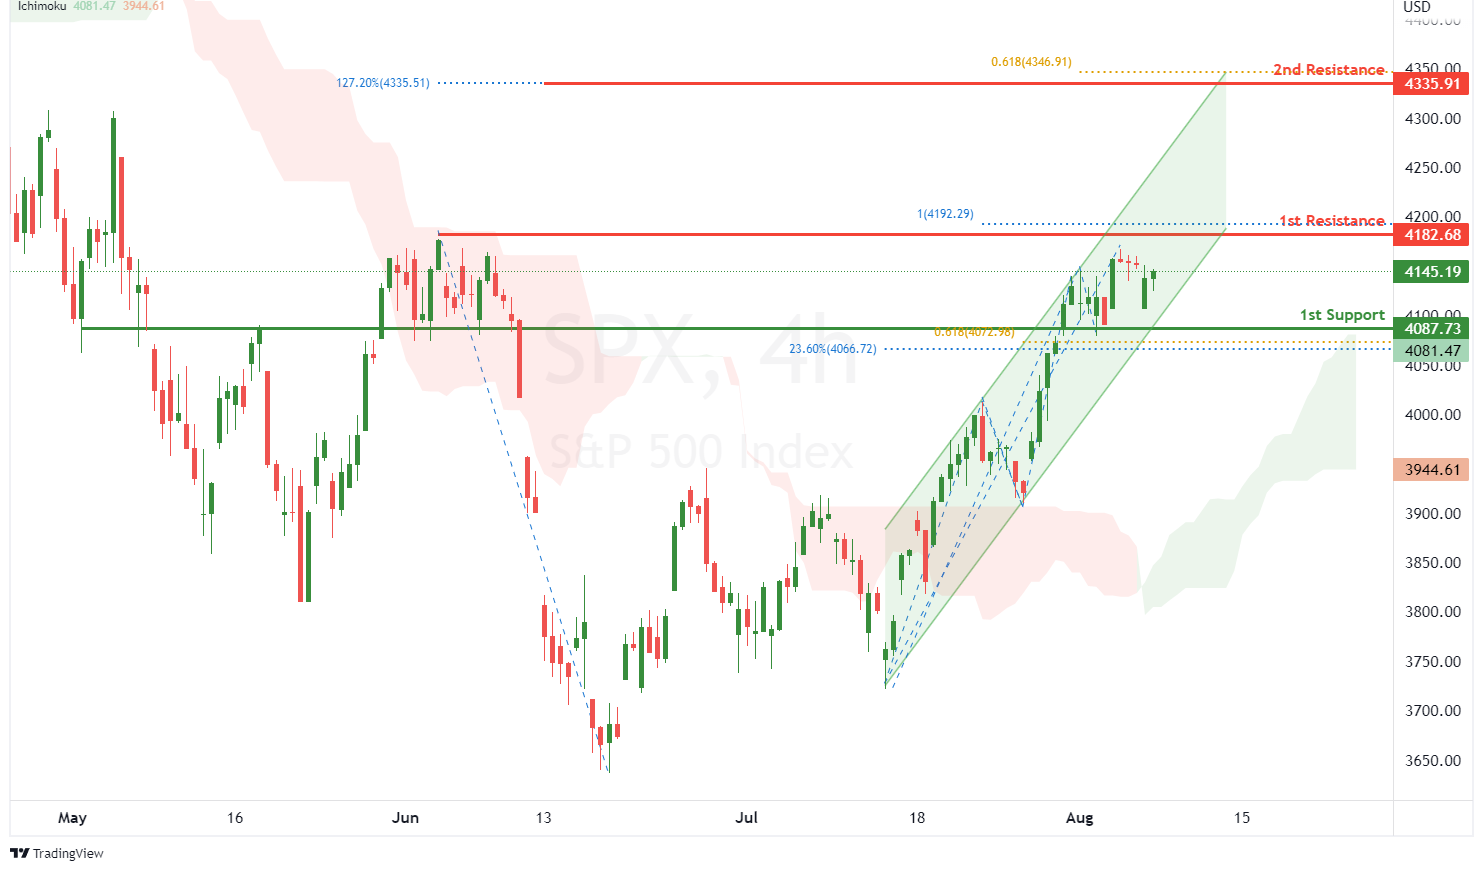
S&P 500:
On the H4, with price moving above the ichimoku indicator and within an ascending channel, we have a bullish bias that price will rise to our 1st resistance at 4182.68 where the swing high resistance and 100% fibonacci projection are. Once there is upside confirmation that price has broken the 1st resistance structure, we would expect bullish momentum to carry price to 2nd resistance at 4335.913 where the 127.2% fibonacci extension and 61.8% fibonacci projection are. Alternatively, price could drop to 1st support at 4087.73 where the overlap support, 23.6% fibonacci retracement and 61.8% fibonacci projection are.
Areas of consideration:
- H4 time frame, 1st resistance of 4182.68
- H4 time frame, 1st support at 4087.73


