
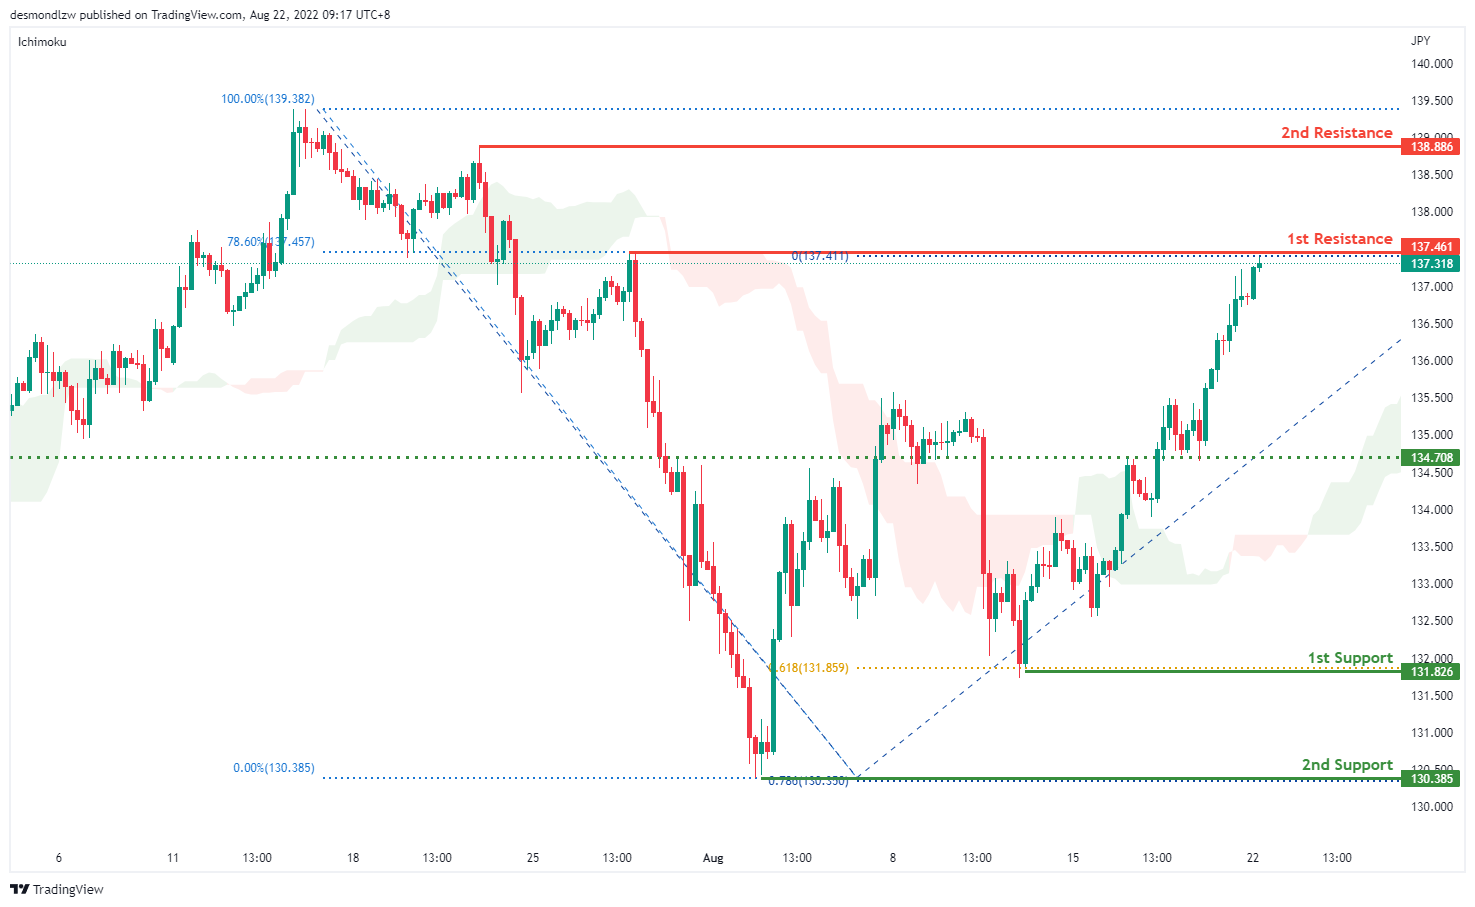
USD/JPY:
On the H4 chart, price has confirmed a bullish momentum breaking the previous high and moving toward the first resistance at 137.461 where the 78.6% fibonacci retracement and previous swing high sits. If bullish momentum continues, it will bring the price to 138.886. Alternatively if price pulls back, it should test the intermediate support at 134.708 and the first support at 131.826 where the 61.8% projection sits and then the second support at 131.601 where the 100% projection sits
Areas of consideration:
H4 time frame, 1st resistance at 137.318
H4 time frame, 1st support at 131.826
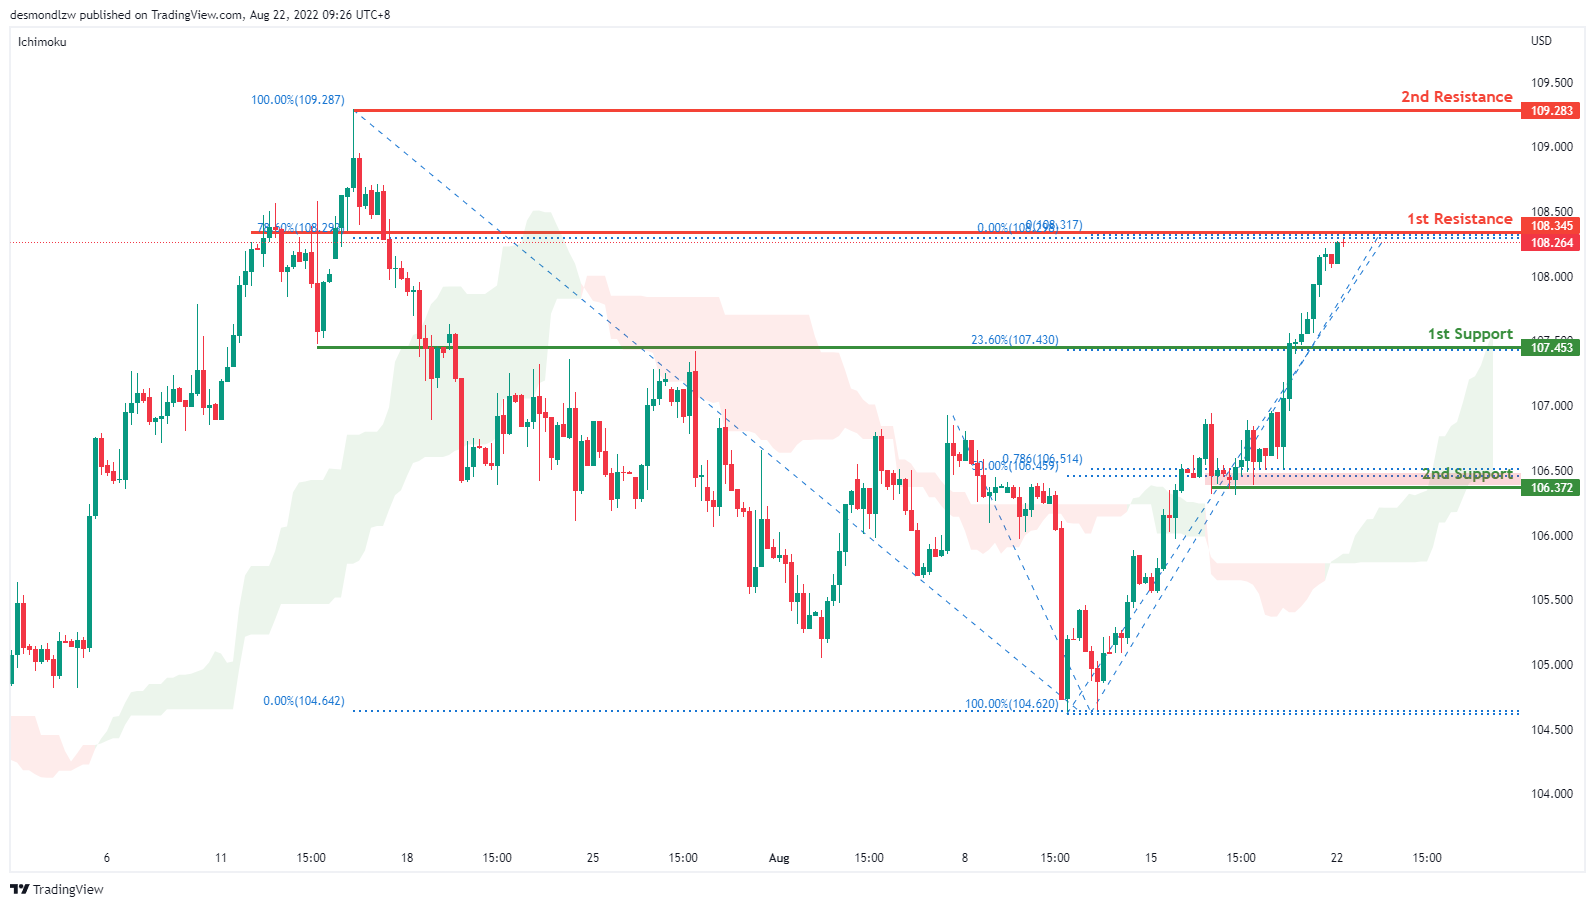
DXY:
On the H4, prices seem to be moving in an ascending trend and is in a bullish momentum. Price is testing around the first resistance at 108.345 where the 78.6% Fibonacci retracement and the previous swing high sits. If price continues with bullish momentum, it will test the second resistance at 109.283. If fails to break the first resistance, it will pull back to test the first support at 107.453 where the 23.6% retracement and swing low sits and subsequently the second support at 106.372 where the 50% retracement and 78.6% projection sits
Areas of consideration:
H4 time frame, 1st resistance at 108.345
H4 time frame, 1st support at 107.453
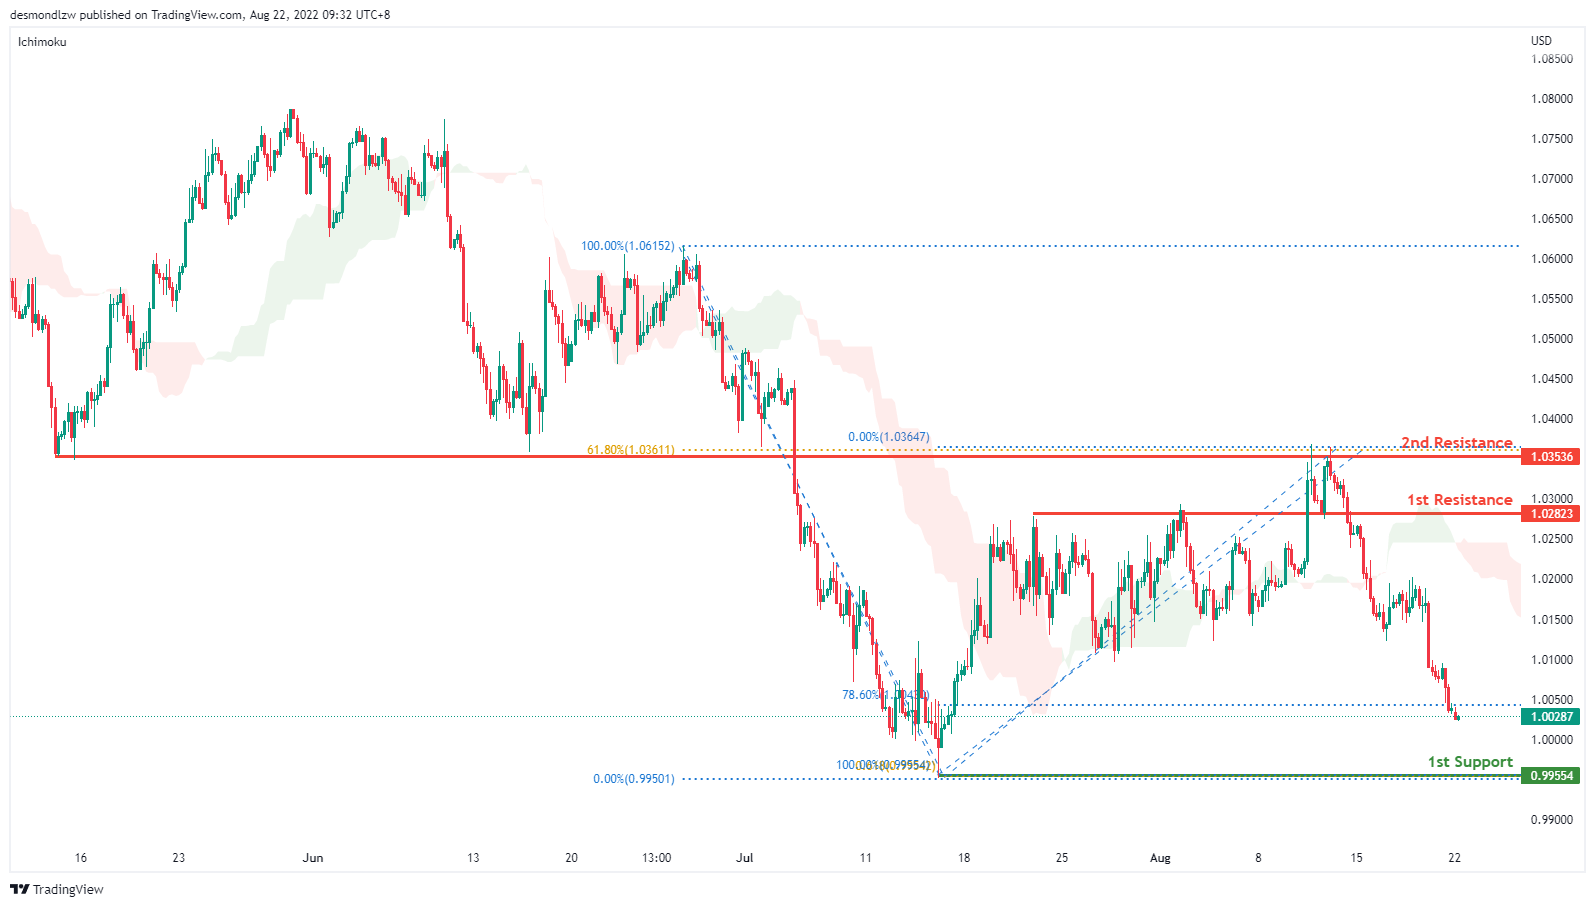
EUR/USD :
On the H4, prices have broken the ascending trend and are below the ichimoku indicator, we are bearish bias. Prices are descending toward the first support at 0.9955 where the 61.8% projection sits. Alternatively, prices could pull back to test the first resistance at 1.0282 where the previous swing high sits and subsequently the second resistance at 1.0353 where the 61.8% retracement and swing high sits
Areas of consideration :
H4 1st resistance at 1.0282
H4 1st support at 0.9955
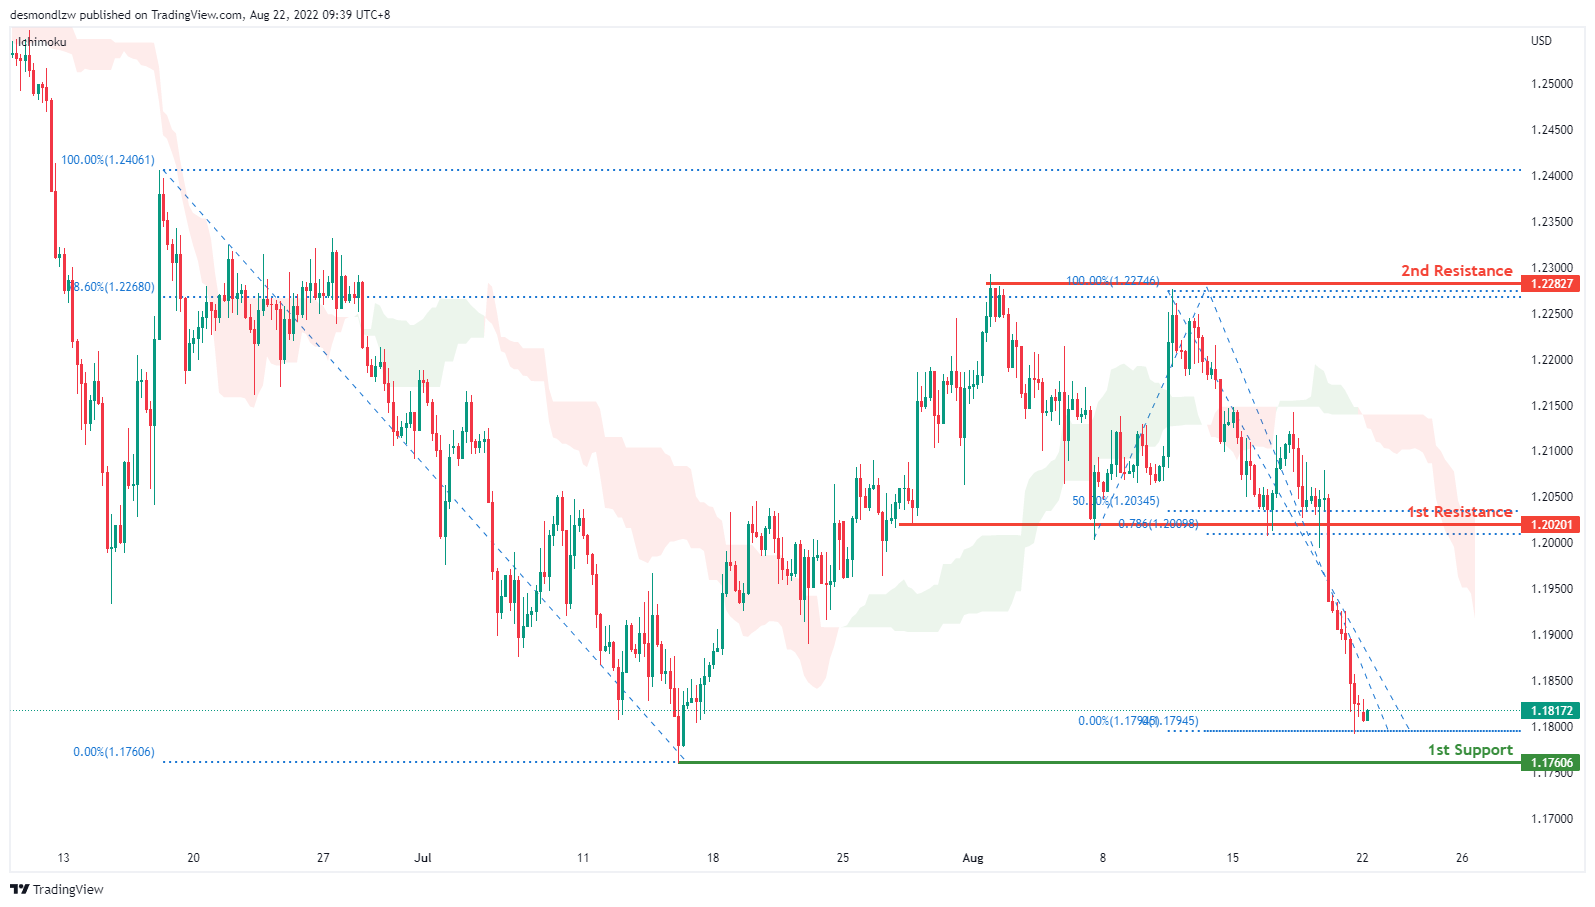
GBP/USD:
On the H4, prices seem to be in a bearish momentum. It is currently moving toward the first support at 1.1760 where the swing low sits. Alternatively, price can pull back to test the first resistance at 1.2020 where the 50% retracement and 78.6% projection sits. Subsequently testing the second resistance at 1.2282 where 78.6% retracement and the swing high sits
Areas of consideration:
H4 1st resistance at 1.2020
H4 1st support at 1.1760
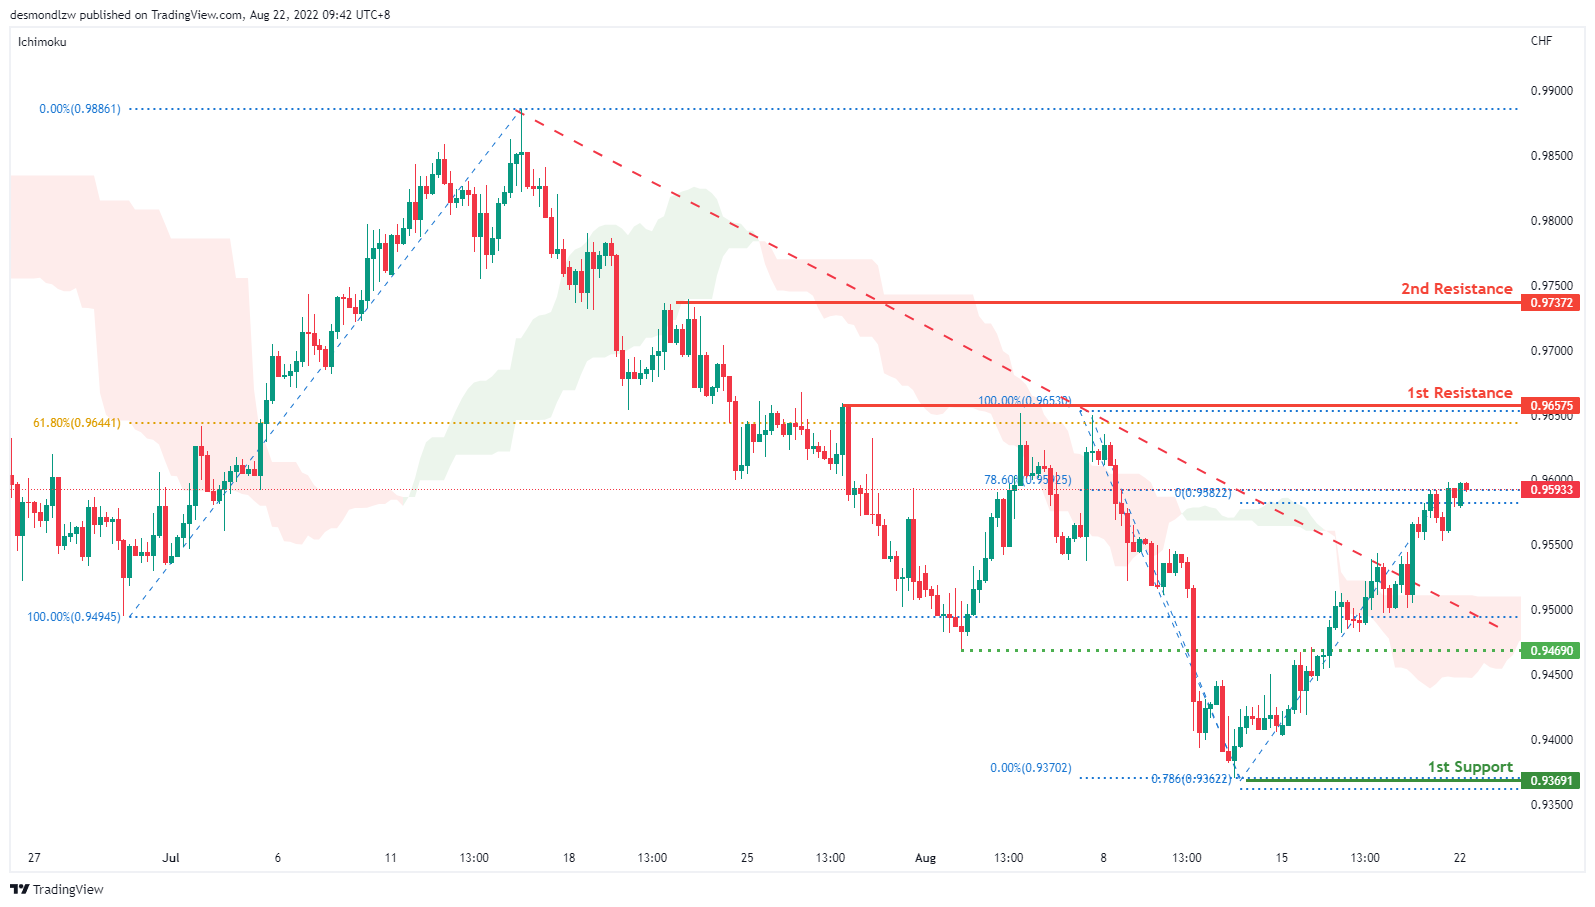
USD/CHF:
On the H4, with prices moving above the ichimoku cloud and breaking the descending trend, we are bullish bias. Price seems like it’s rising toward the first resistance at 0.9657 where the 61.8% fibonacci retracement sits. If price continues with the bullish momentum it will test the second resistance at 0.9737. Alternatively, prices could test the intermediate support at 0.9469 where the swing low sits and then the first support at 0.9369 where the 78.6% fibonacci retracement sits
Areas of consideration
H4 1st support at 0.9369
H4 1st resistance at 0.9657
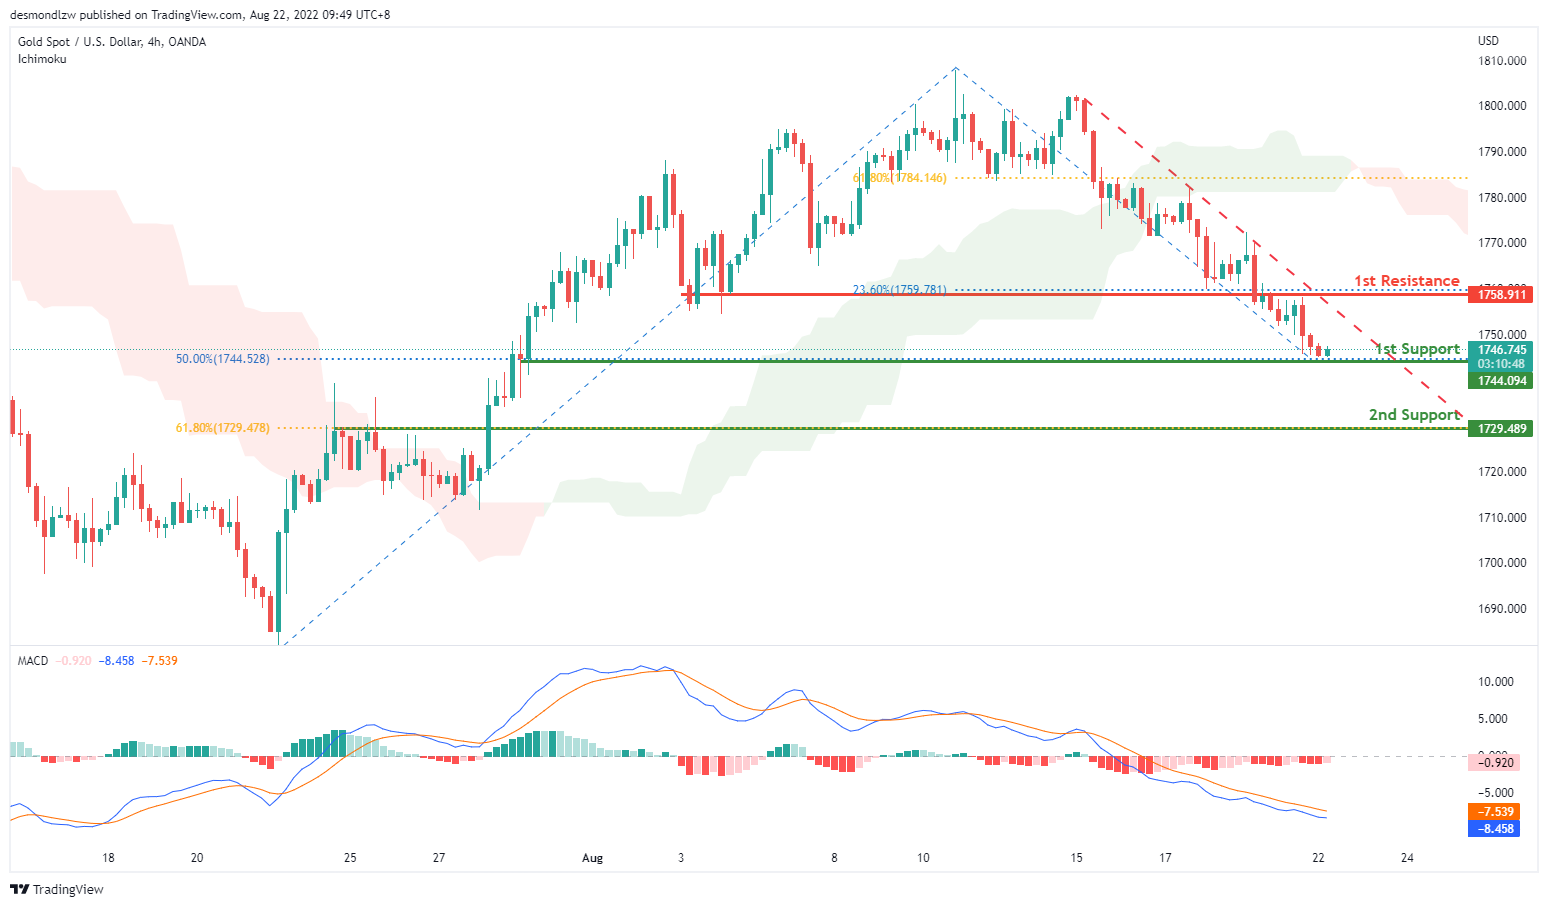
XAU/USD (GOLD):
On the H4, with prices moving within the descending trendline, below ichimoku cloud and MACD indicators are below zero, we have a bearish bias that the price may drop from the 1st support at 1744.094, which is in line with the 50% fibonacci retracement to the 2nd support at 1729.489, where the 61.8% fibonacci retracement and pullback resistance are. Alternatively, the price may rise to the 1st resistance at 1758.911, where the 23.6% fibonacci retracement is.
Areas of consideration:
H4 time frame, 1st support at 1744.094
H4 time frame, 2nd support at 1729.489
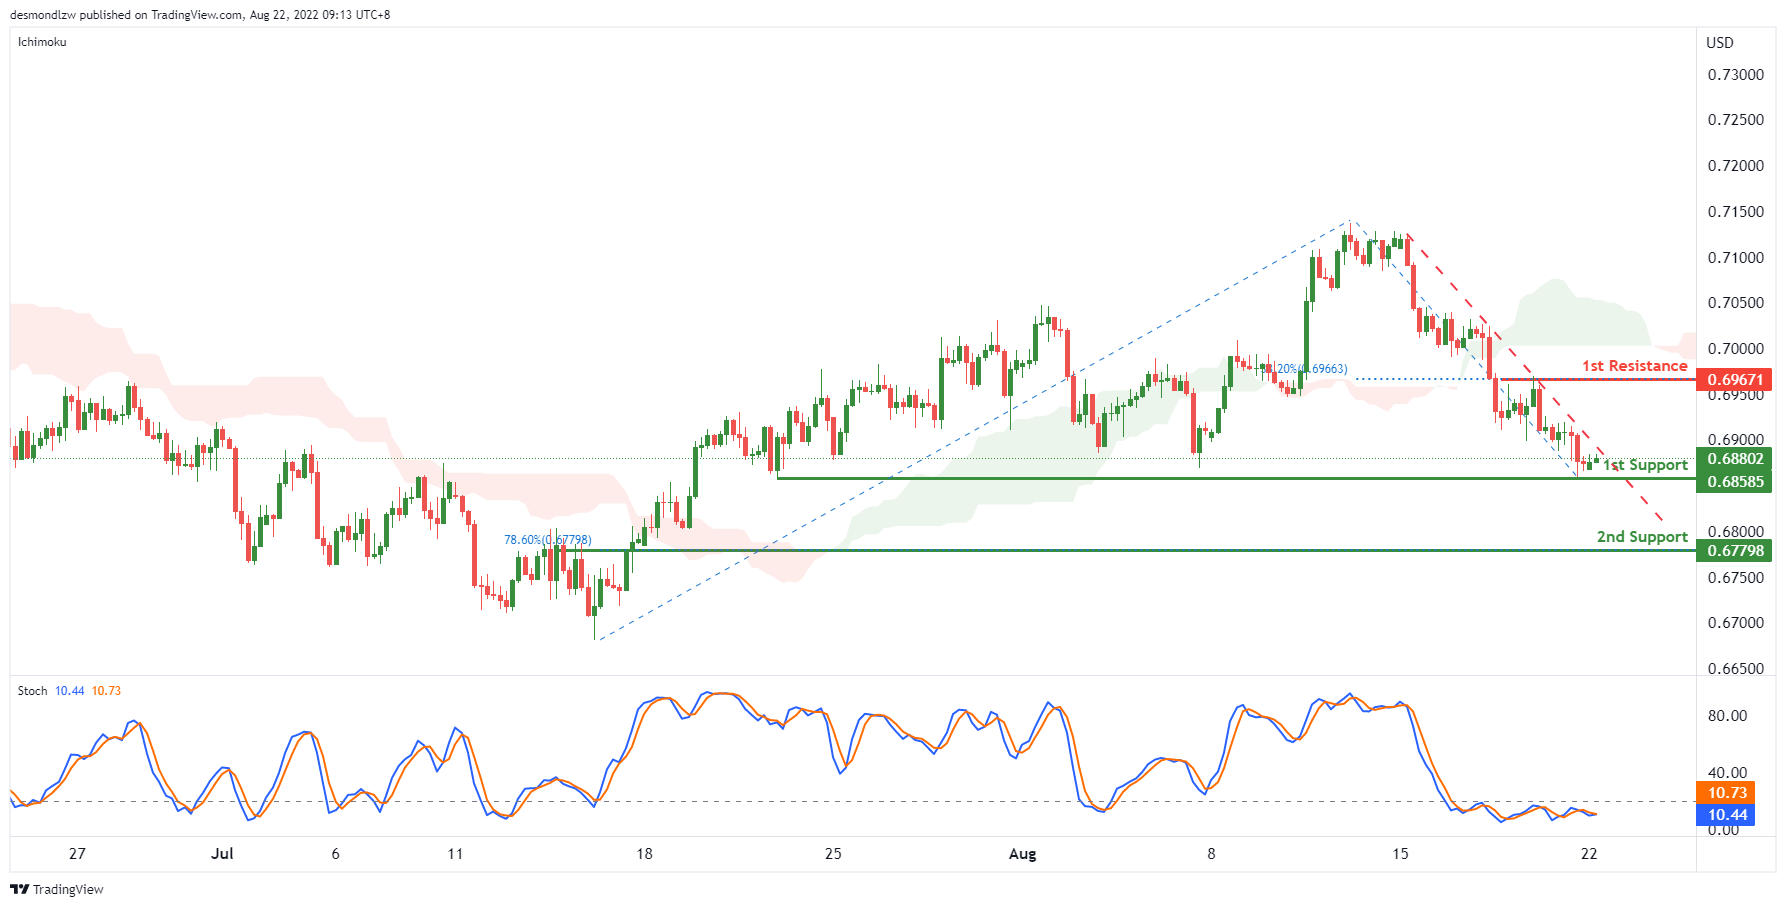
AUD/USD:
On the H4, with the price is going within the descending trendline and the stoch indicators are below 20 accompany with the %K crossing below %D for 2 times, we have a bearish bias that the price may drop to the 1st support at 0.68585, which is in line with the previous swing low. If the price breaks the 1st support, we can expect it to drop to the 2nd support at 0.67798, where the 78.6% fibonacci retracement is. Alternatively, the price may break the descending trendline and rise to the 1st resistance at 0.69671, where the swing high and 38.2% fibonacci retracement are.
Areas of consideration
H4 1st support at 0.68585
H4 2nd support at 0.67798
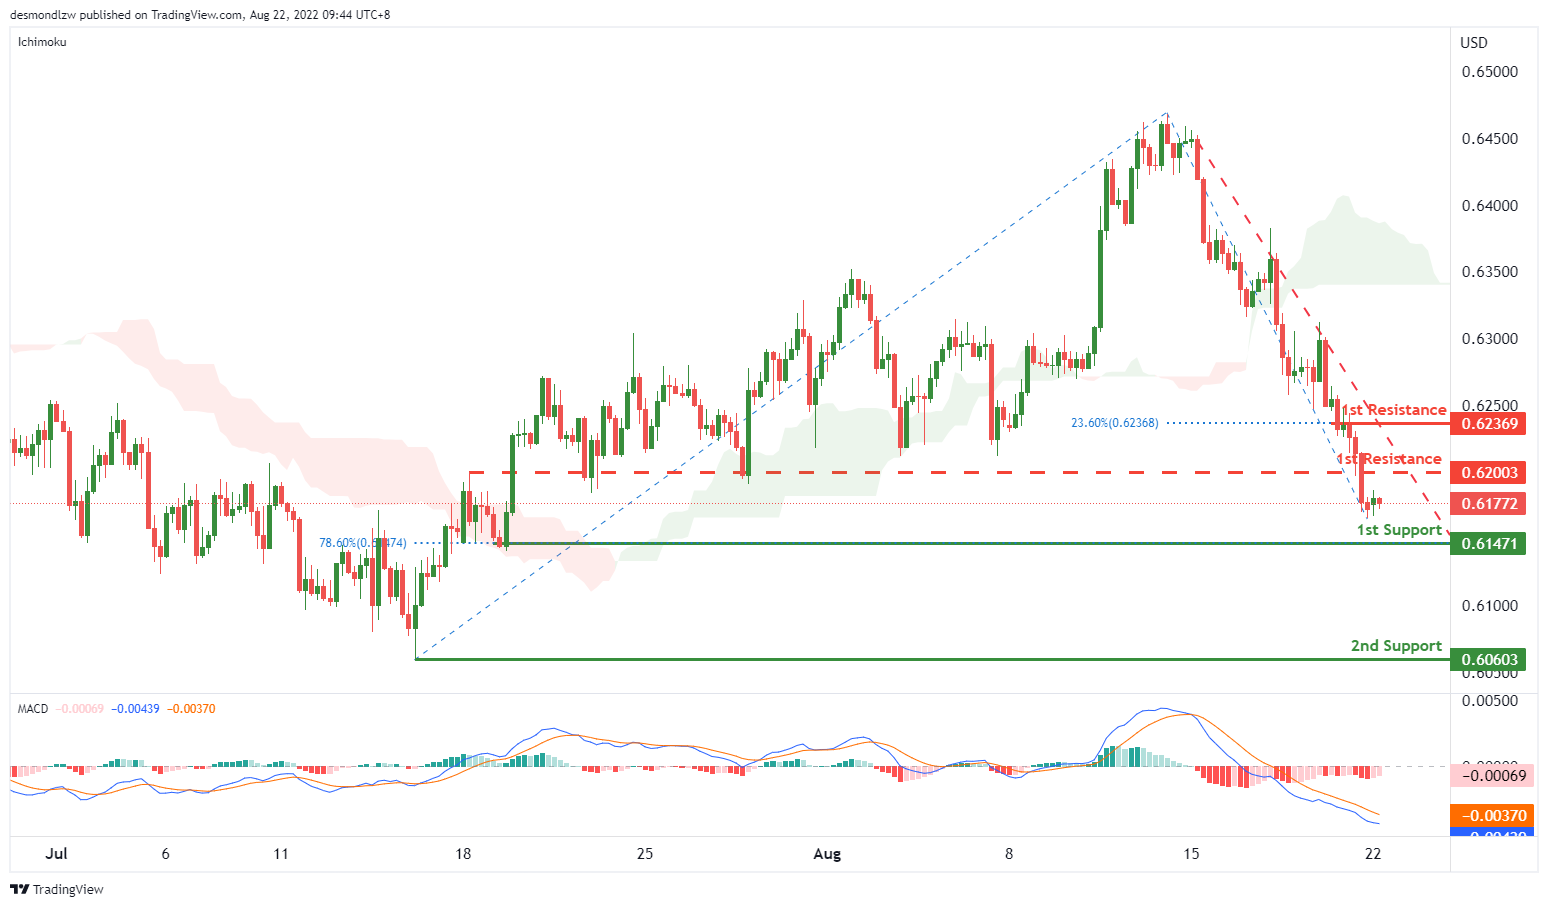
NZD/USD:
On the H4, with the price moving within the descending trendline, below ichimoku cloud and MACD indicators are below zero, we have a bearish bias that the price may drop to the 1st support at 0.61471, which is in line with the 78.6% fibonacci retracement and pervious swing low, if the price continue dropping, the price may drop to the 2nd support at 0.60603, which is in line with the swing low. Alternatively, the price may rise to the 1st resistance at 0.62369, where the 23.6% fibonacci retracement is. Take note the price of 0.62003 could be the intermediate resistance, which is the overlap resistance.
Areas of consideration:
H4 time frame, 1st support at 0.61471
H4 time frame, 2nd support at 0.60603
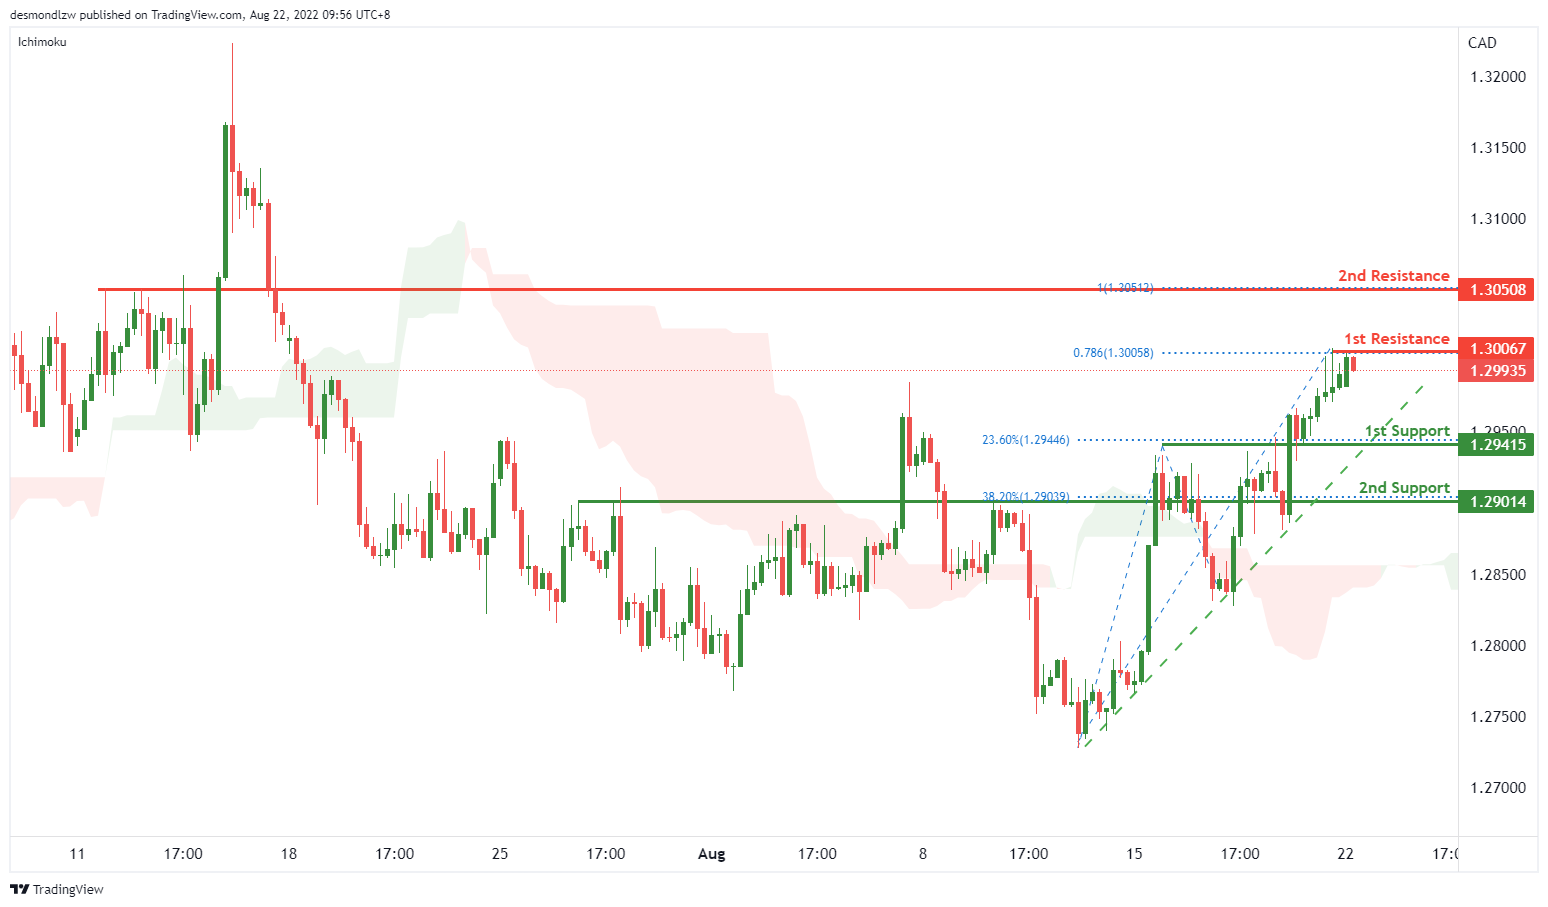
USD/CAD:
On the H4, with the price above the ichimoku cloud and moving within the ascending trendline, we have a bullish bias that the price may rise from the 1st resistance at 1.30067, which is the 78.6% fibonacci projection to the 2nd resistance at 1.30508, which is in line with the previous swing highs and 100% fibonacci projection. Alternatively, the price may drop to the 1st support at 1.29415, where the 23.6% fibonacci retracement is. If the price break this level, we can expect it to drop to 2nd support at 1.29014, where the 38.2% fibonacci retracement is.
Areas of consideration:
H4 time frame, 1st resistance at 1.30067
H4 time frame, 2nd resistance at 1.30508
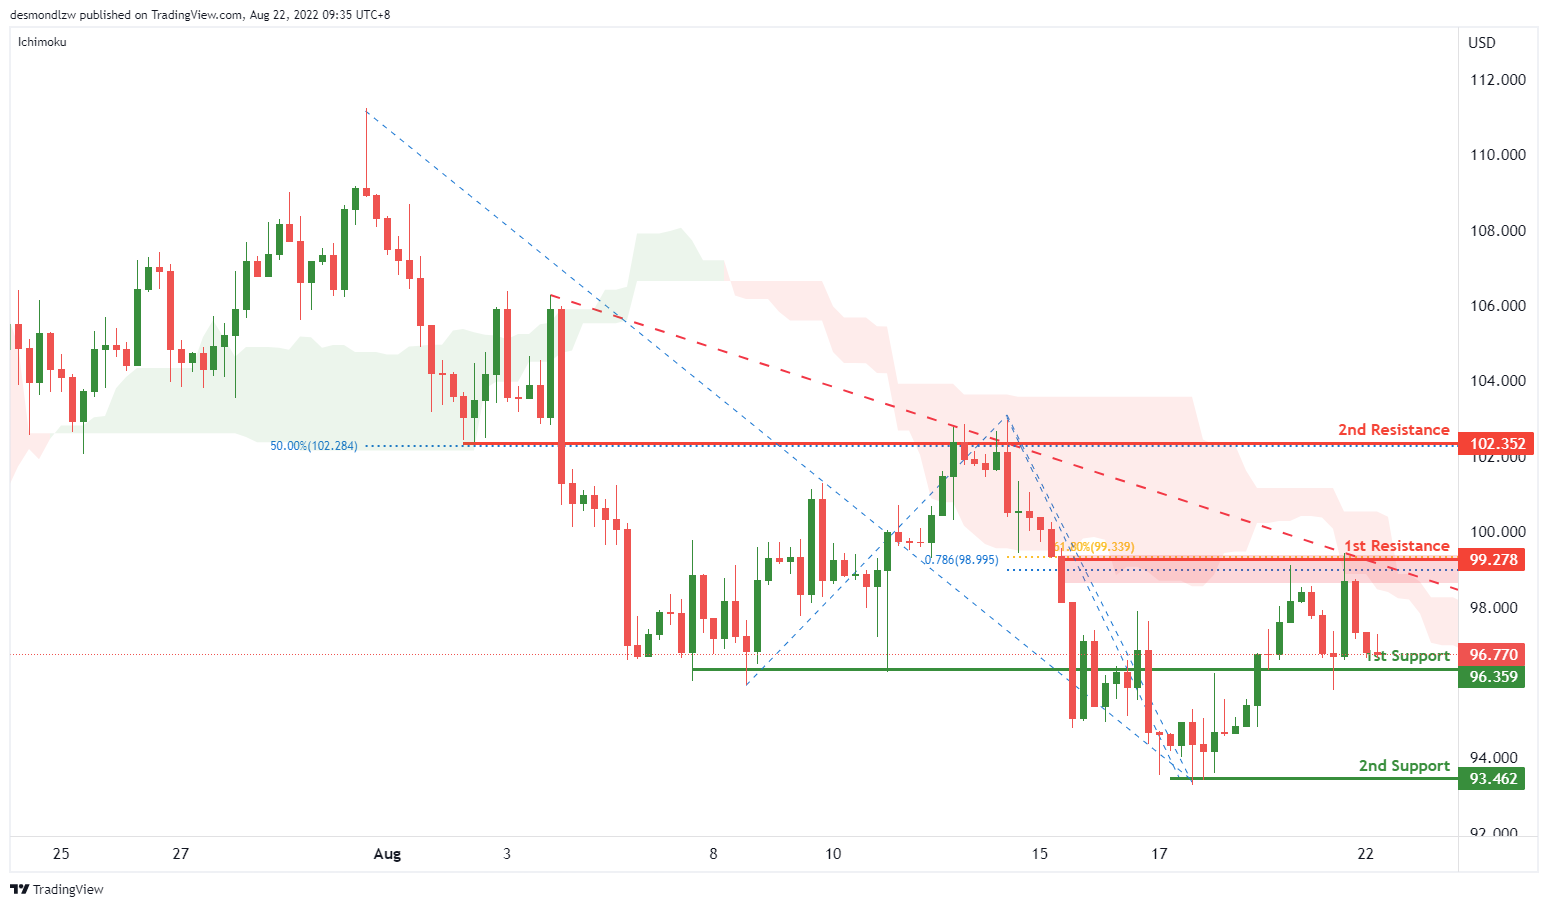
OIL:
On the H4, with price moving within the descending trendline, below ichimoku cloud, we have a bearish bias that the price may drop to our 1st support at 96.359, which is in line with the previous swing low, if the price break the 1st support, the price may drop to the 2nd support at 93.462, which is in line with the swing low. Otherwise, the price may rise to the 1st resistance, where the 78.6% fibonacci projection, 61.8% fibonacci retracement and swing high. If the price break this level, it could rise to the 2nd resistance, which is in line with the 50% fibonacci retracement.
Areas of consideration:
H4 time frame, 1st support at 96.359
H4 time frame, 2nd support at 93.462
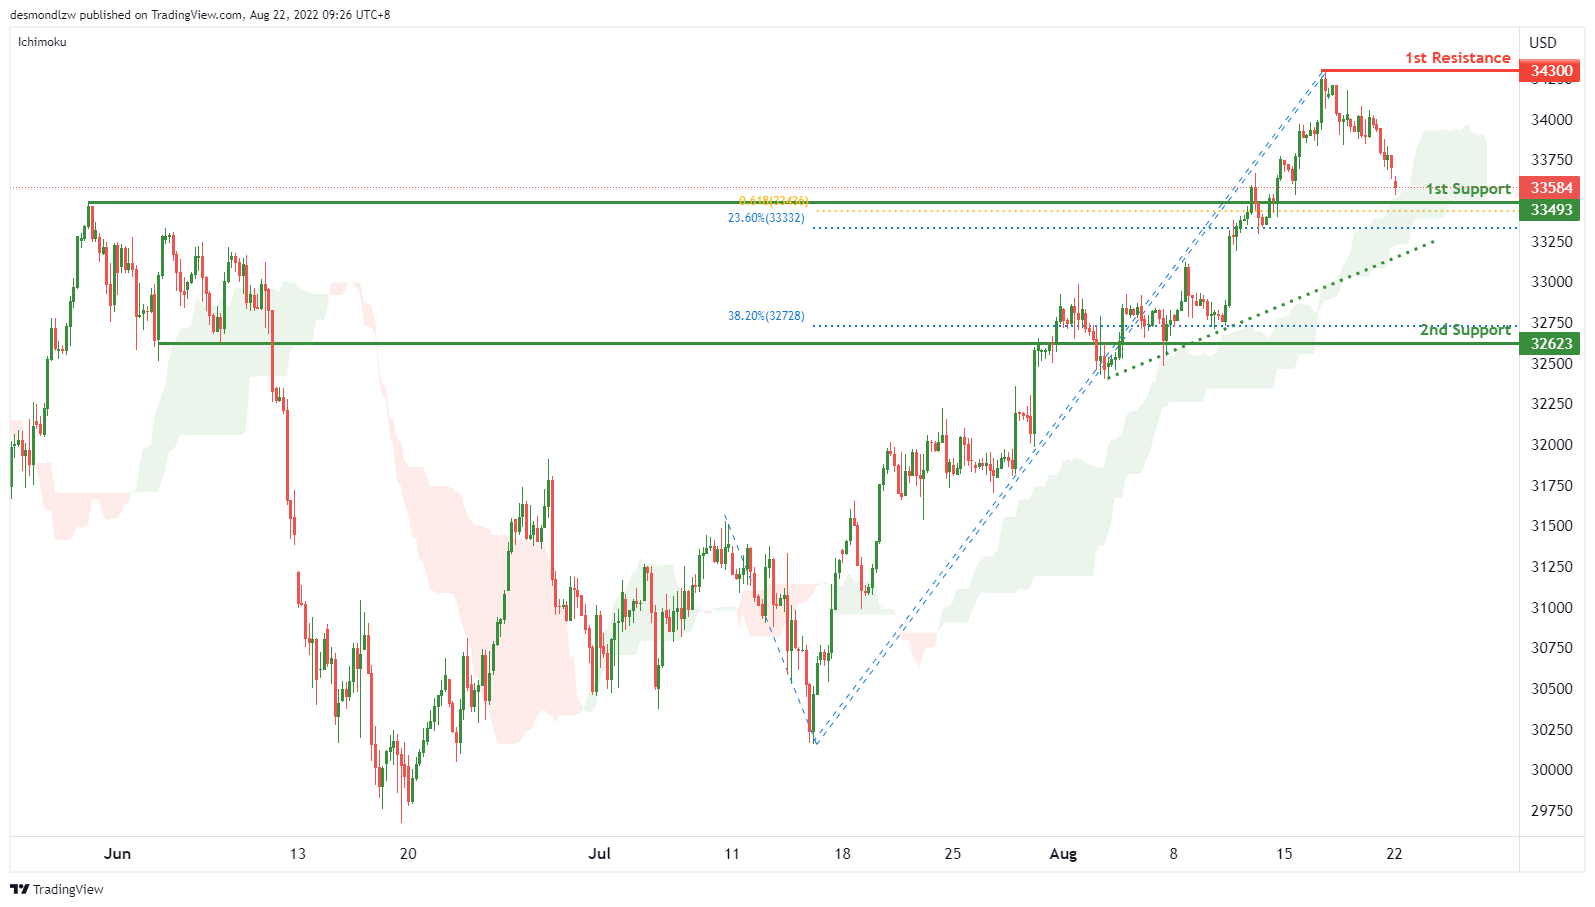
Dow Jones Industrial Average:
On the H4, with price moving above the ichimoku indicator and along an ascending trendline, we have a bullish bias that price will rise from 1st support at 33493 where the 23.6% fibonacci retracement, 61.8% fibonacci projection and pullback support to 1st resistance at 34300 where the swing high resistance is. Alternatively, price could break 1st support structure and drop to 2nd support at 32623 where the pullback support and 38.2% fibonacci retracement are.
Areas of consideration:
H4 time frame, 1st resistance of 34300
H4 time frame, 1st support at 33493
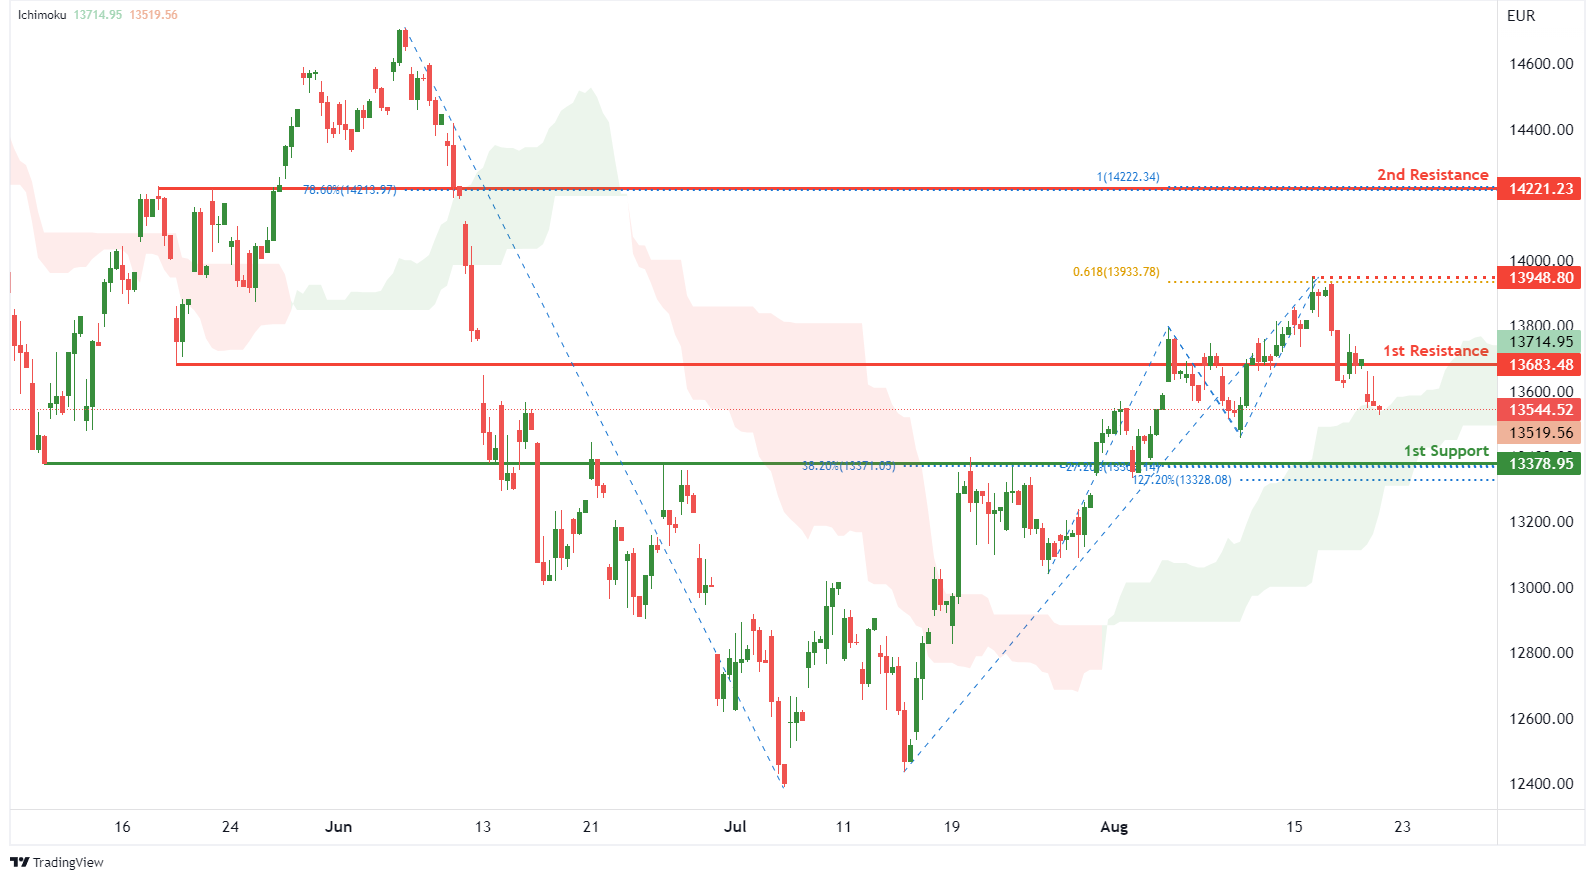
DAX:
On the H4, with price moving above the ichimoku indicator, we have a bullish bias that price will rise to the 1st resistance at 13683.48 where the pullback support is. Once there is upside confirmation that price has broken 1st resistance structure, we would expect bullish momentum to carry price to the 2nd resistance at 14221.23 in line with 100% fibonacci projection and 78.6% fibonacci retracement. Take note of intermediate resistance at 13948.80 where the swing high resistance and 61.8% fibonacci projection are. Alternatively, price could drop to 1st support at 13378.95 where the overlap support, -27.2% fibonacci expansion, 127.2% fibonacci extension and 38.2% fibonacci retracement are
Areas of consideration:
H4 time frame, 1st resistance of 14221.23
H4 time frame, 1st support at 13378.95
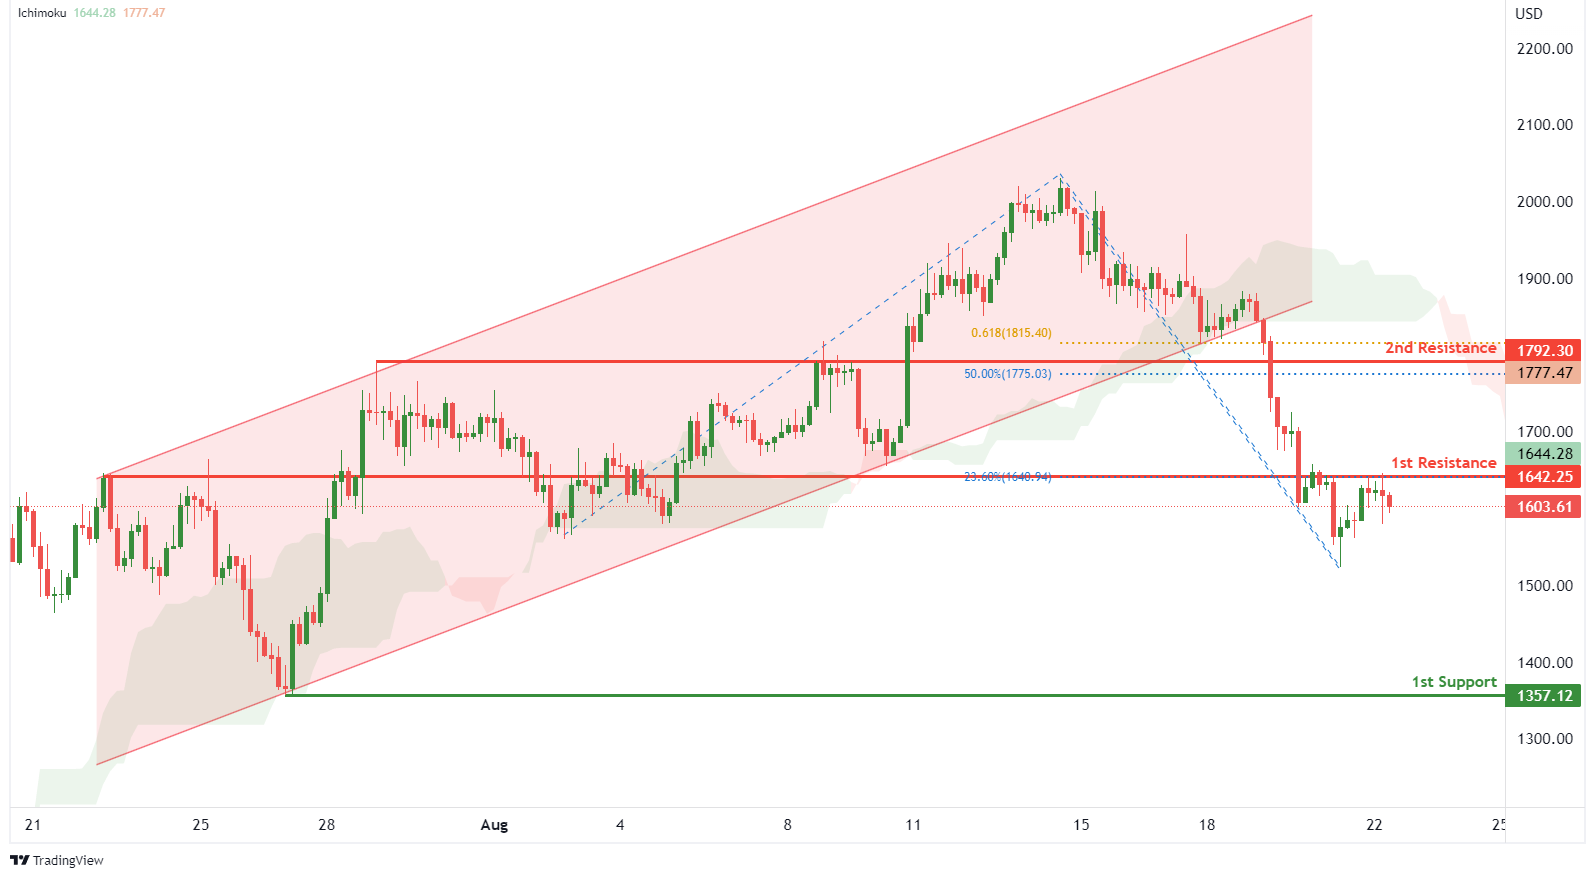
ETHUSD:
On the H4, with price breaking out of an ascending channel and moving below the ichimoku indicator, we have a bearish bias that price will drop from the 1st resistance at 1642.25 where the pullback support and 23.6% fibonacci retracement are to the 1st support at 1357.12 where the swing low support is. Alternatively, price could break 1st resistance and rise to 2nd resistance at 1792.30 where the overlap resistance, 50% fibonacci retracement and 61.8% fibonacci projection are.
Areas of consideration:
H4 time frame, 1st resistance of 1642.25
H4 time frame, 1st support at 1357.12
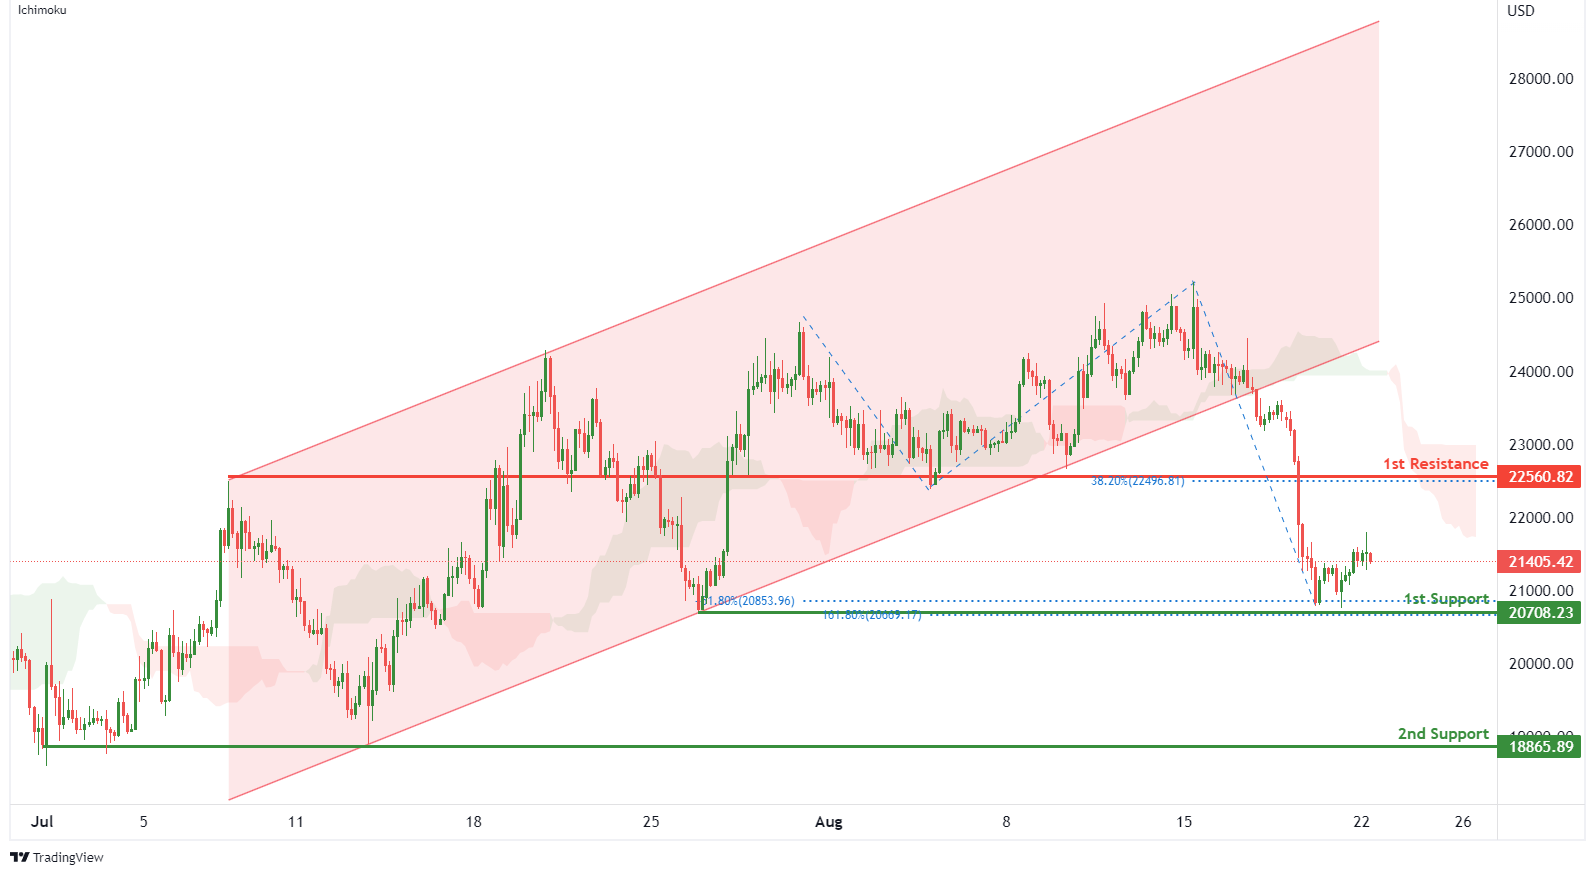
BTCUSD:
On the H4, with price breaking out of a bullish channel and moving below the ichimoku indicator, we have a bearish bias that price will drop to 1st support at 20708.23 where the -61.8% fibonacci expansion, 161.8% fibonacci extension and swing low support are. Once we have downside confirmation of price breaking 1st support structure,we would expect bearish momentum to carry price to 2nd support at 18865.89 where the swing low support is. Alternatively, price could rise to 1st resistance at 22560.82 where the pullback resistance and 38.2% fibonacci retracement are.
Areas of consideration:
H4 time frame, 1st resistance of 22560.82
H4 time frame, 1st support at 20708.23
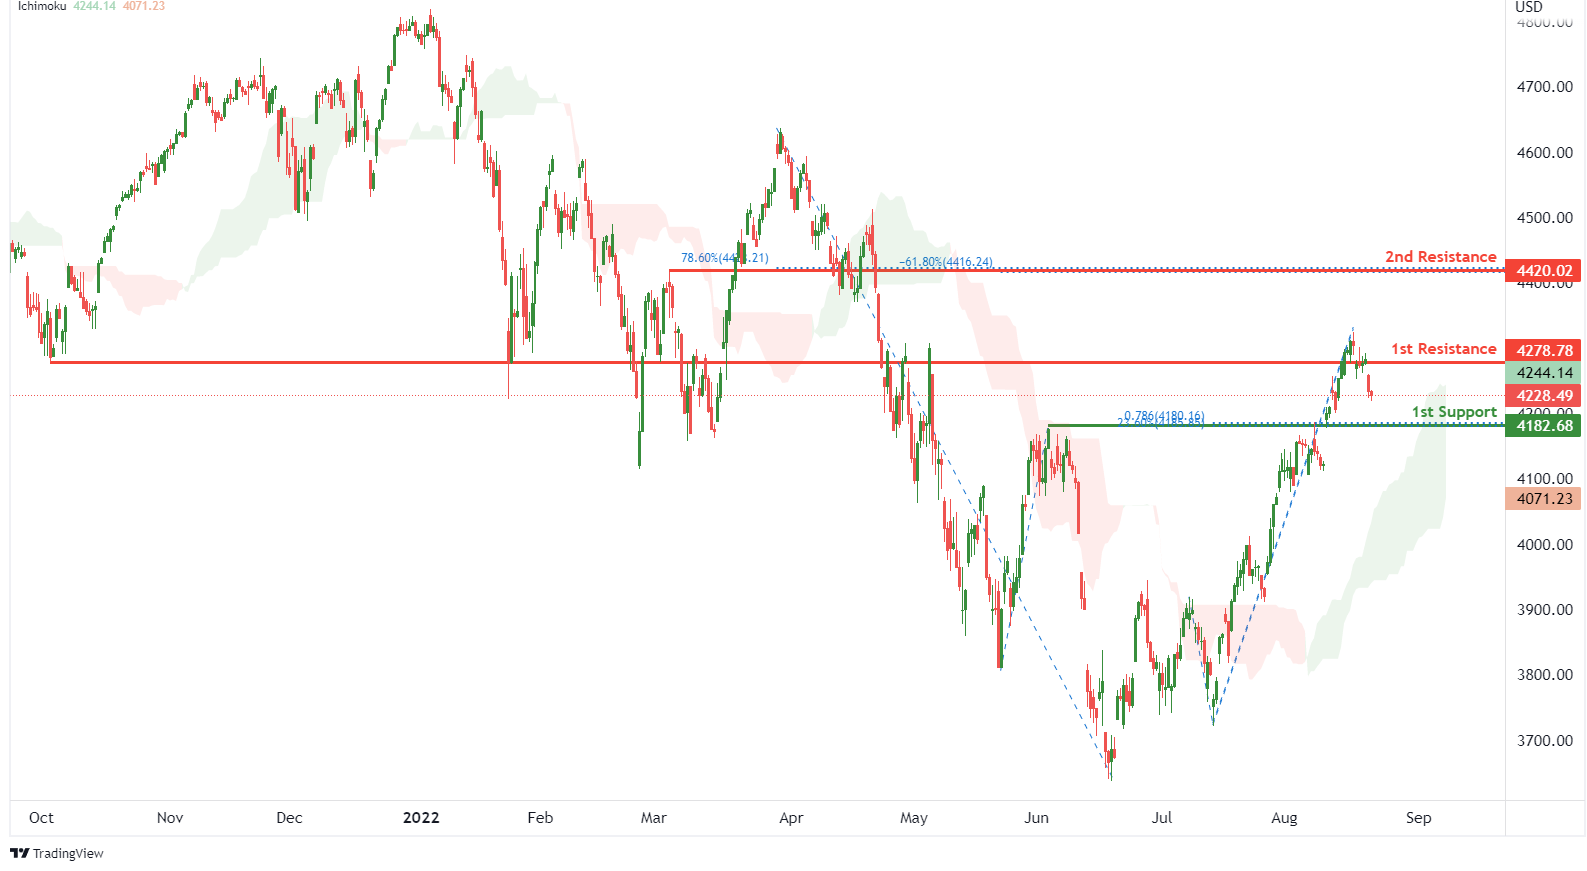
S&P 500:
On the H4, with prices moving above the ichimoku indicator, we have a bullish bias that the price will rise to 1st resistance at 4278.78 where the overlap resistance is. Once there is upside confirmation of price breaking 1st resistance structure, we would expect bullish momentum to carry price to 2nd resistance at 4420.02 where the pullback resistance, 78.6% fibonacci retracement and -61.8% fibonacci expansion are. Alternatively, price could drop to 1st support at 4182.68 where the pullback support, 78.6% fibonacci projection and 23.6% fibonacci retracement are.
Areas of consideration:
H4 time frame, 1st resistance of 4278.78
H4 time frame, 1st support at 4182.68


