
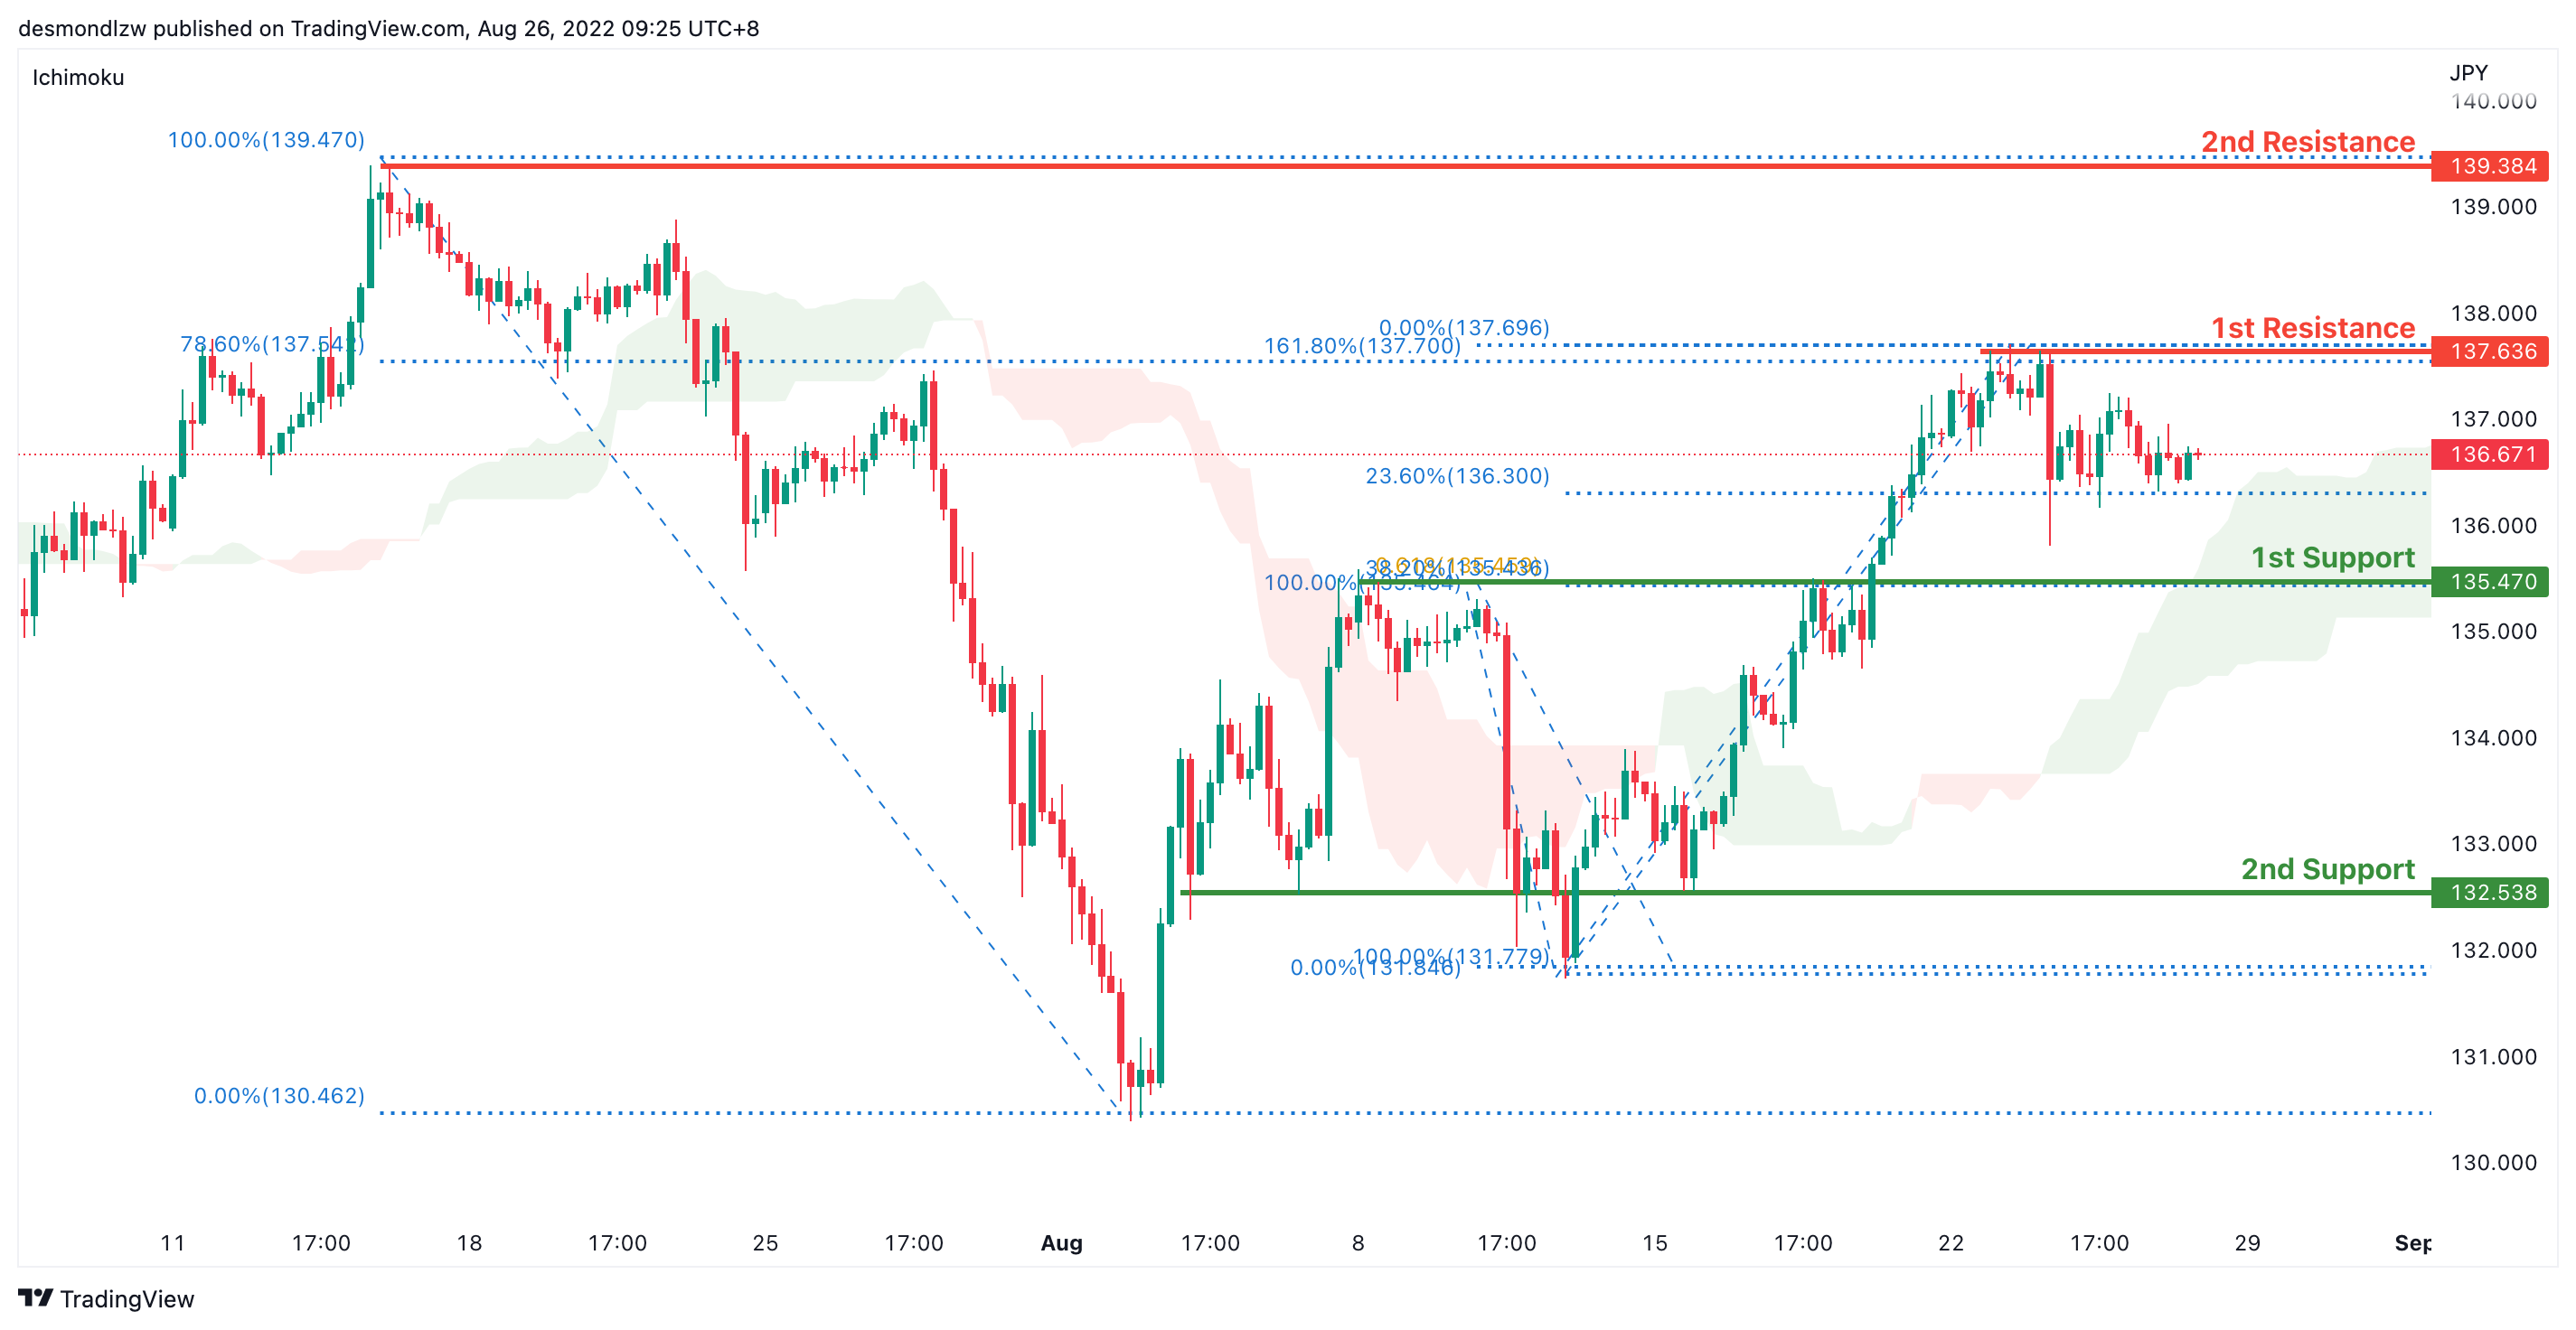
USD/JPY:
On the H4 chart, price has confirmed a bullish momentum breaking the previous high. We are bullish bias- Price is testing the 23.6% retracement levels now at 136.671 and is failing to break level. We are looking at price testing the first resistance at 137.636 where the 78.6% fibonacci retracement and 161.8% extension sits. It has pulled back slightly but if bullish momentum continues, it will bring the price to 139.397 where the swing high sits. Alternatively if price pulls back, it should test the first support at 135.470 where the 61.8% projection sits and the second support at 132.538 where the swing low sits
Areas of consideration:
- H4 time frame, 1st resistance at 137.636
- H4 time frame, 1st support at 135.470
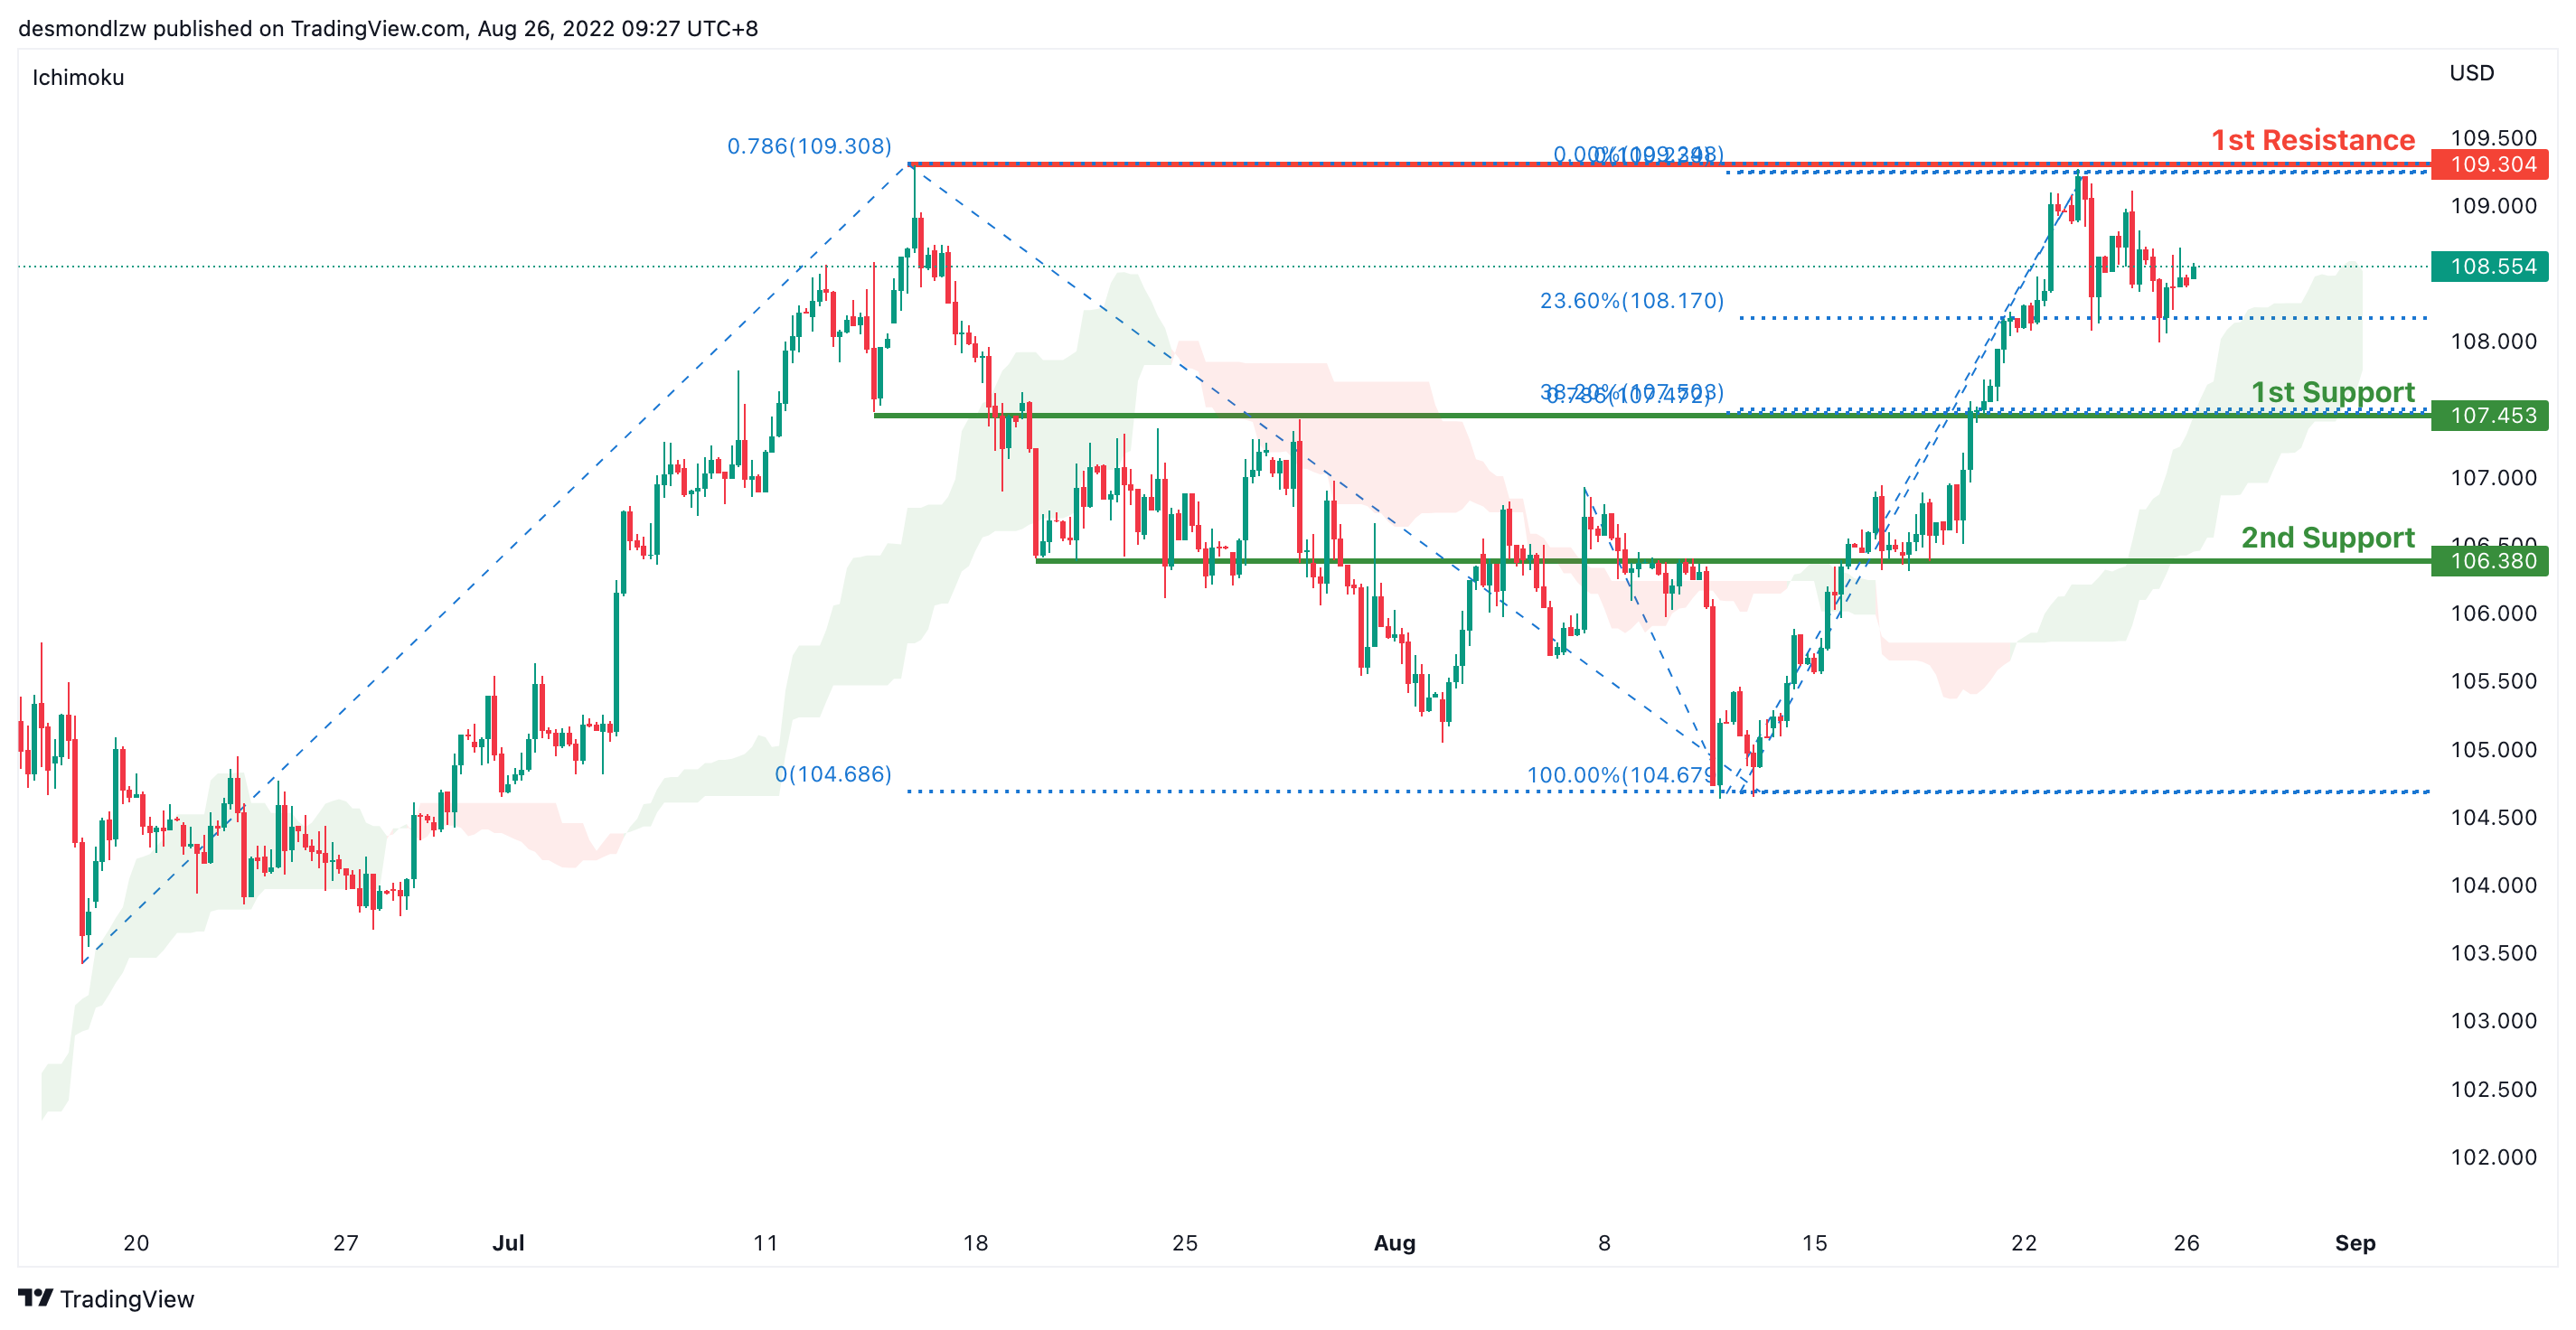
DXY:
On the H4, prices are still moving in an ascending trend and is in a bullish momentum. Price has tested first resistance at 109.304 where the 78.6% Fibonacci projection and the previous swing high sits and has pulled back slightly to the 23.6% retracement levels. If price fails to break the first resistance, it should pull back to test the first support at 107.453 where the 38.2% retracement and 78.6% projection sits and subsequently the second support at 106.380 where the 61.8% retracement sits
Areas of consideration:
- H4 time frame, 1st resistance at 109.304
- H4 time frame, 1st support at 107.453
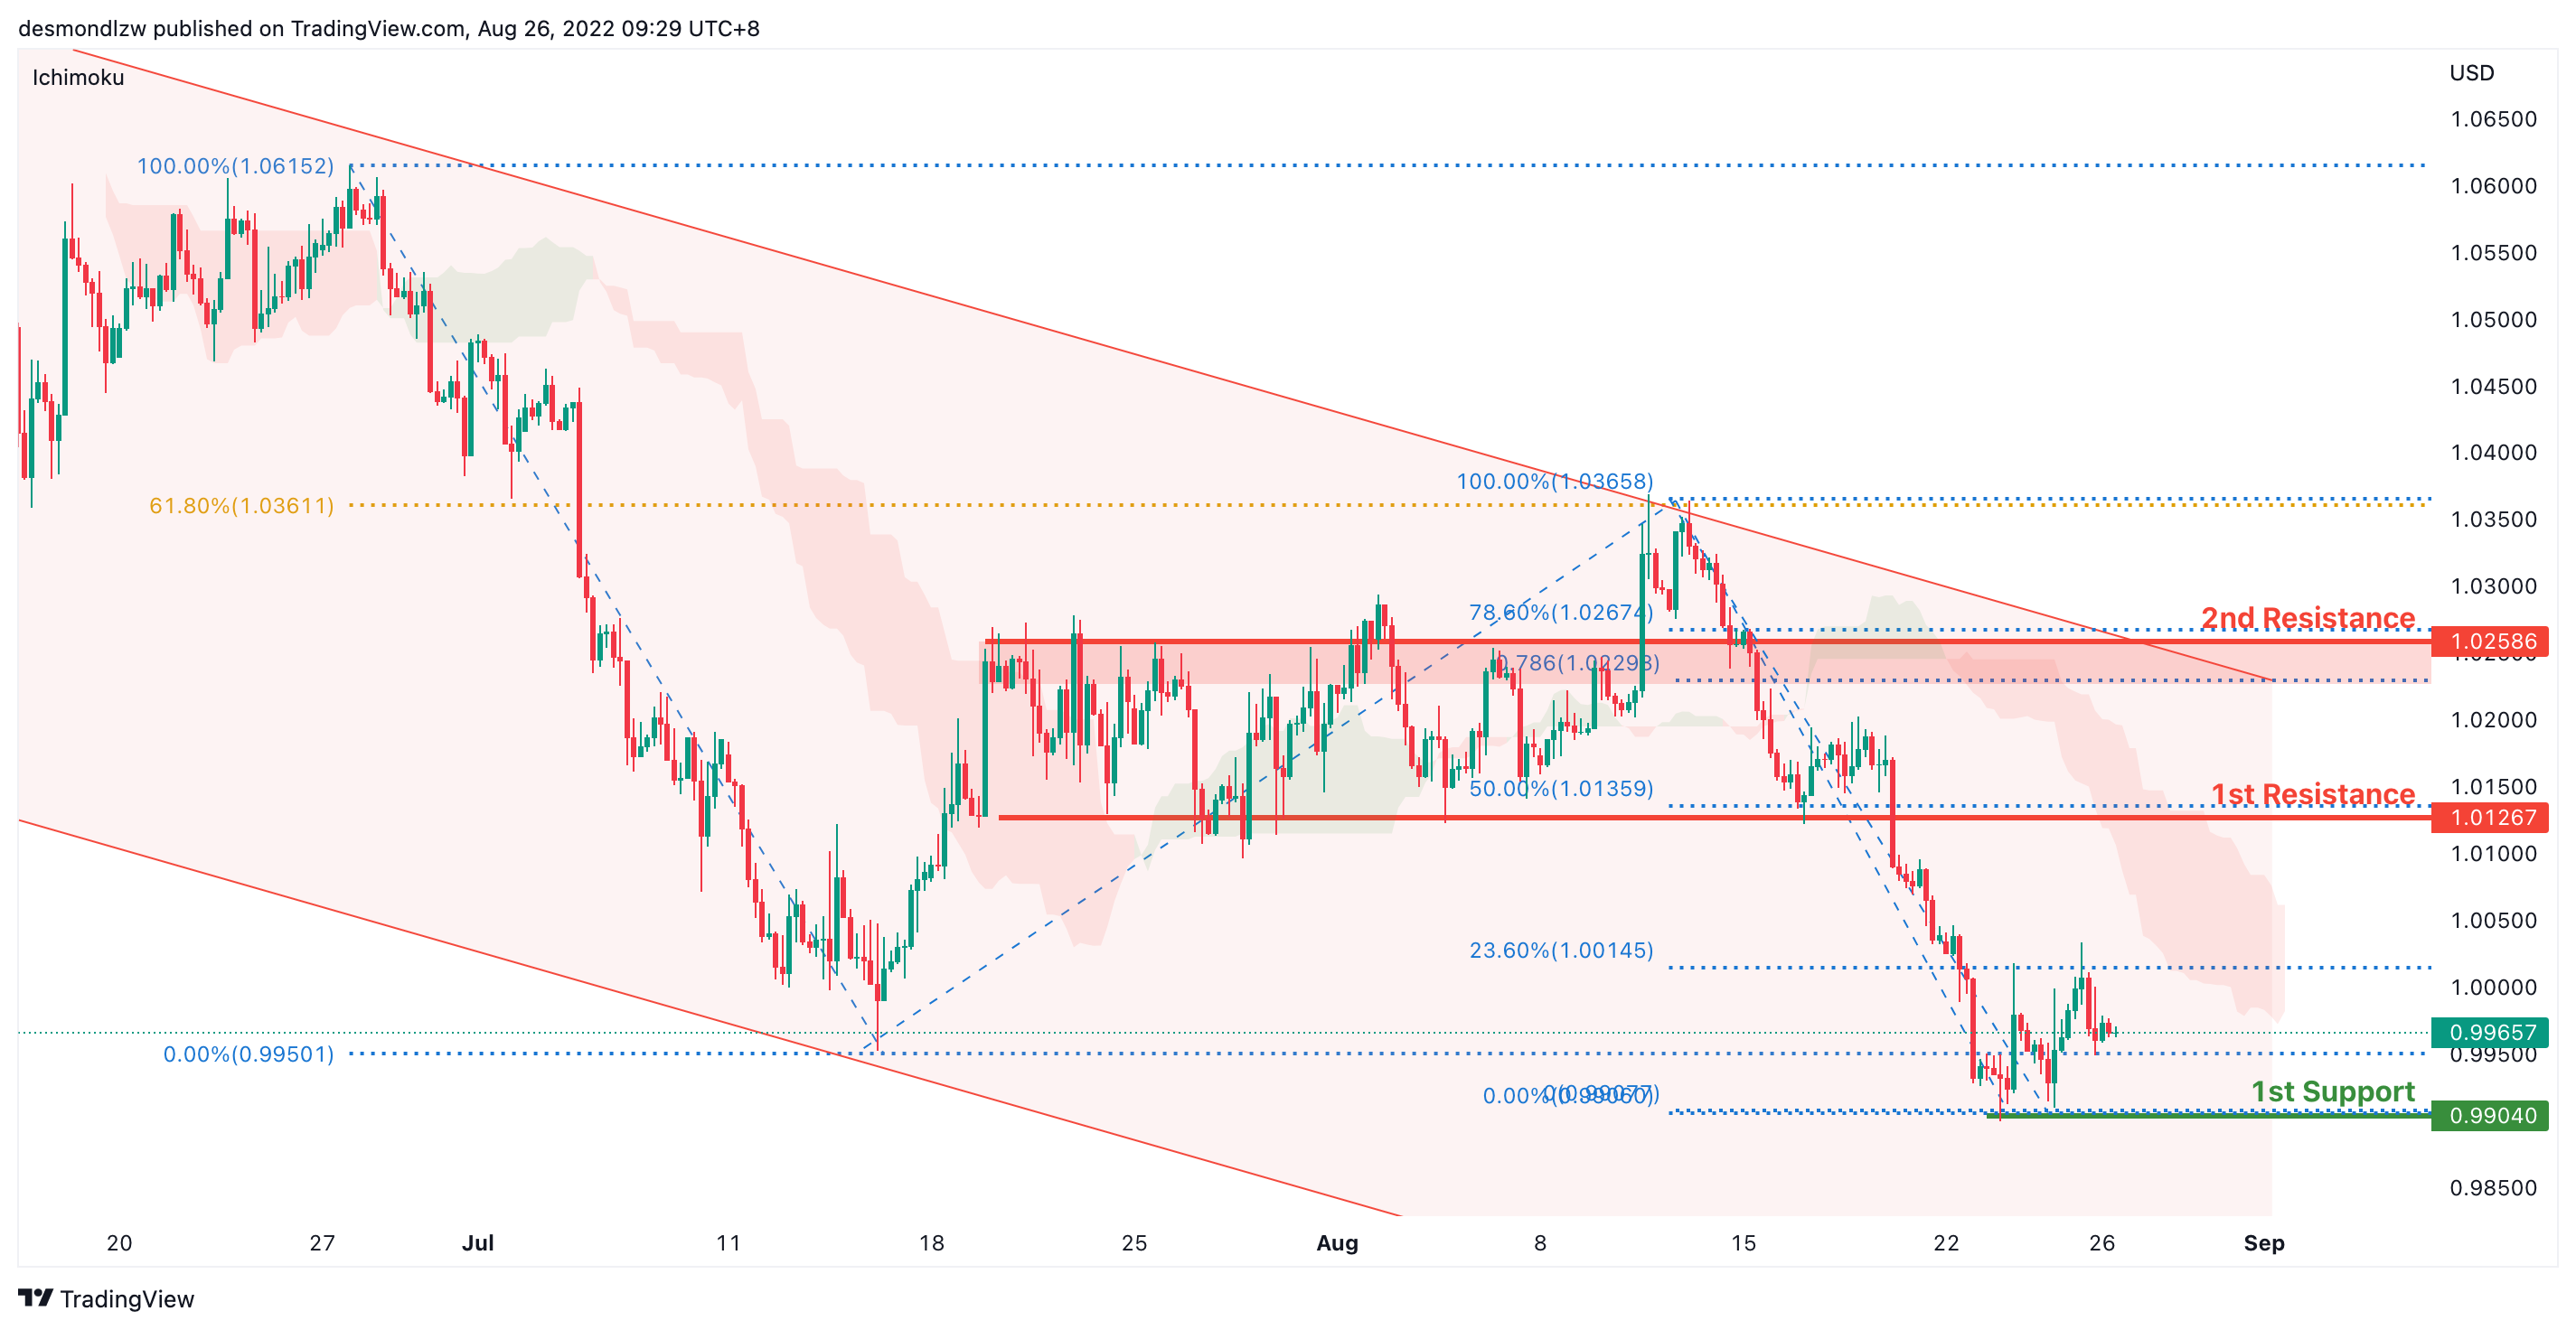
EUR/USD :
On the H4, prices are still in a descending trend and are below the ichimoku indicator, we are bearish bias. Prices have tested the first support at 0.9904 where the 61.8% projection sits. If it fails to break the first support, prices could pull back to test the first resistance at 1.0126 where the previous swing low and 50% retracement sits and subsequently the second resistance at 1.0258 where the 78.6% retracement and swing high sits
Areas of consideration :
- H4 1st resistance at 1.0126
- H4 1st support at 0.9904
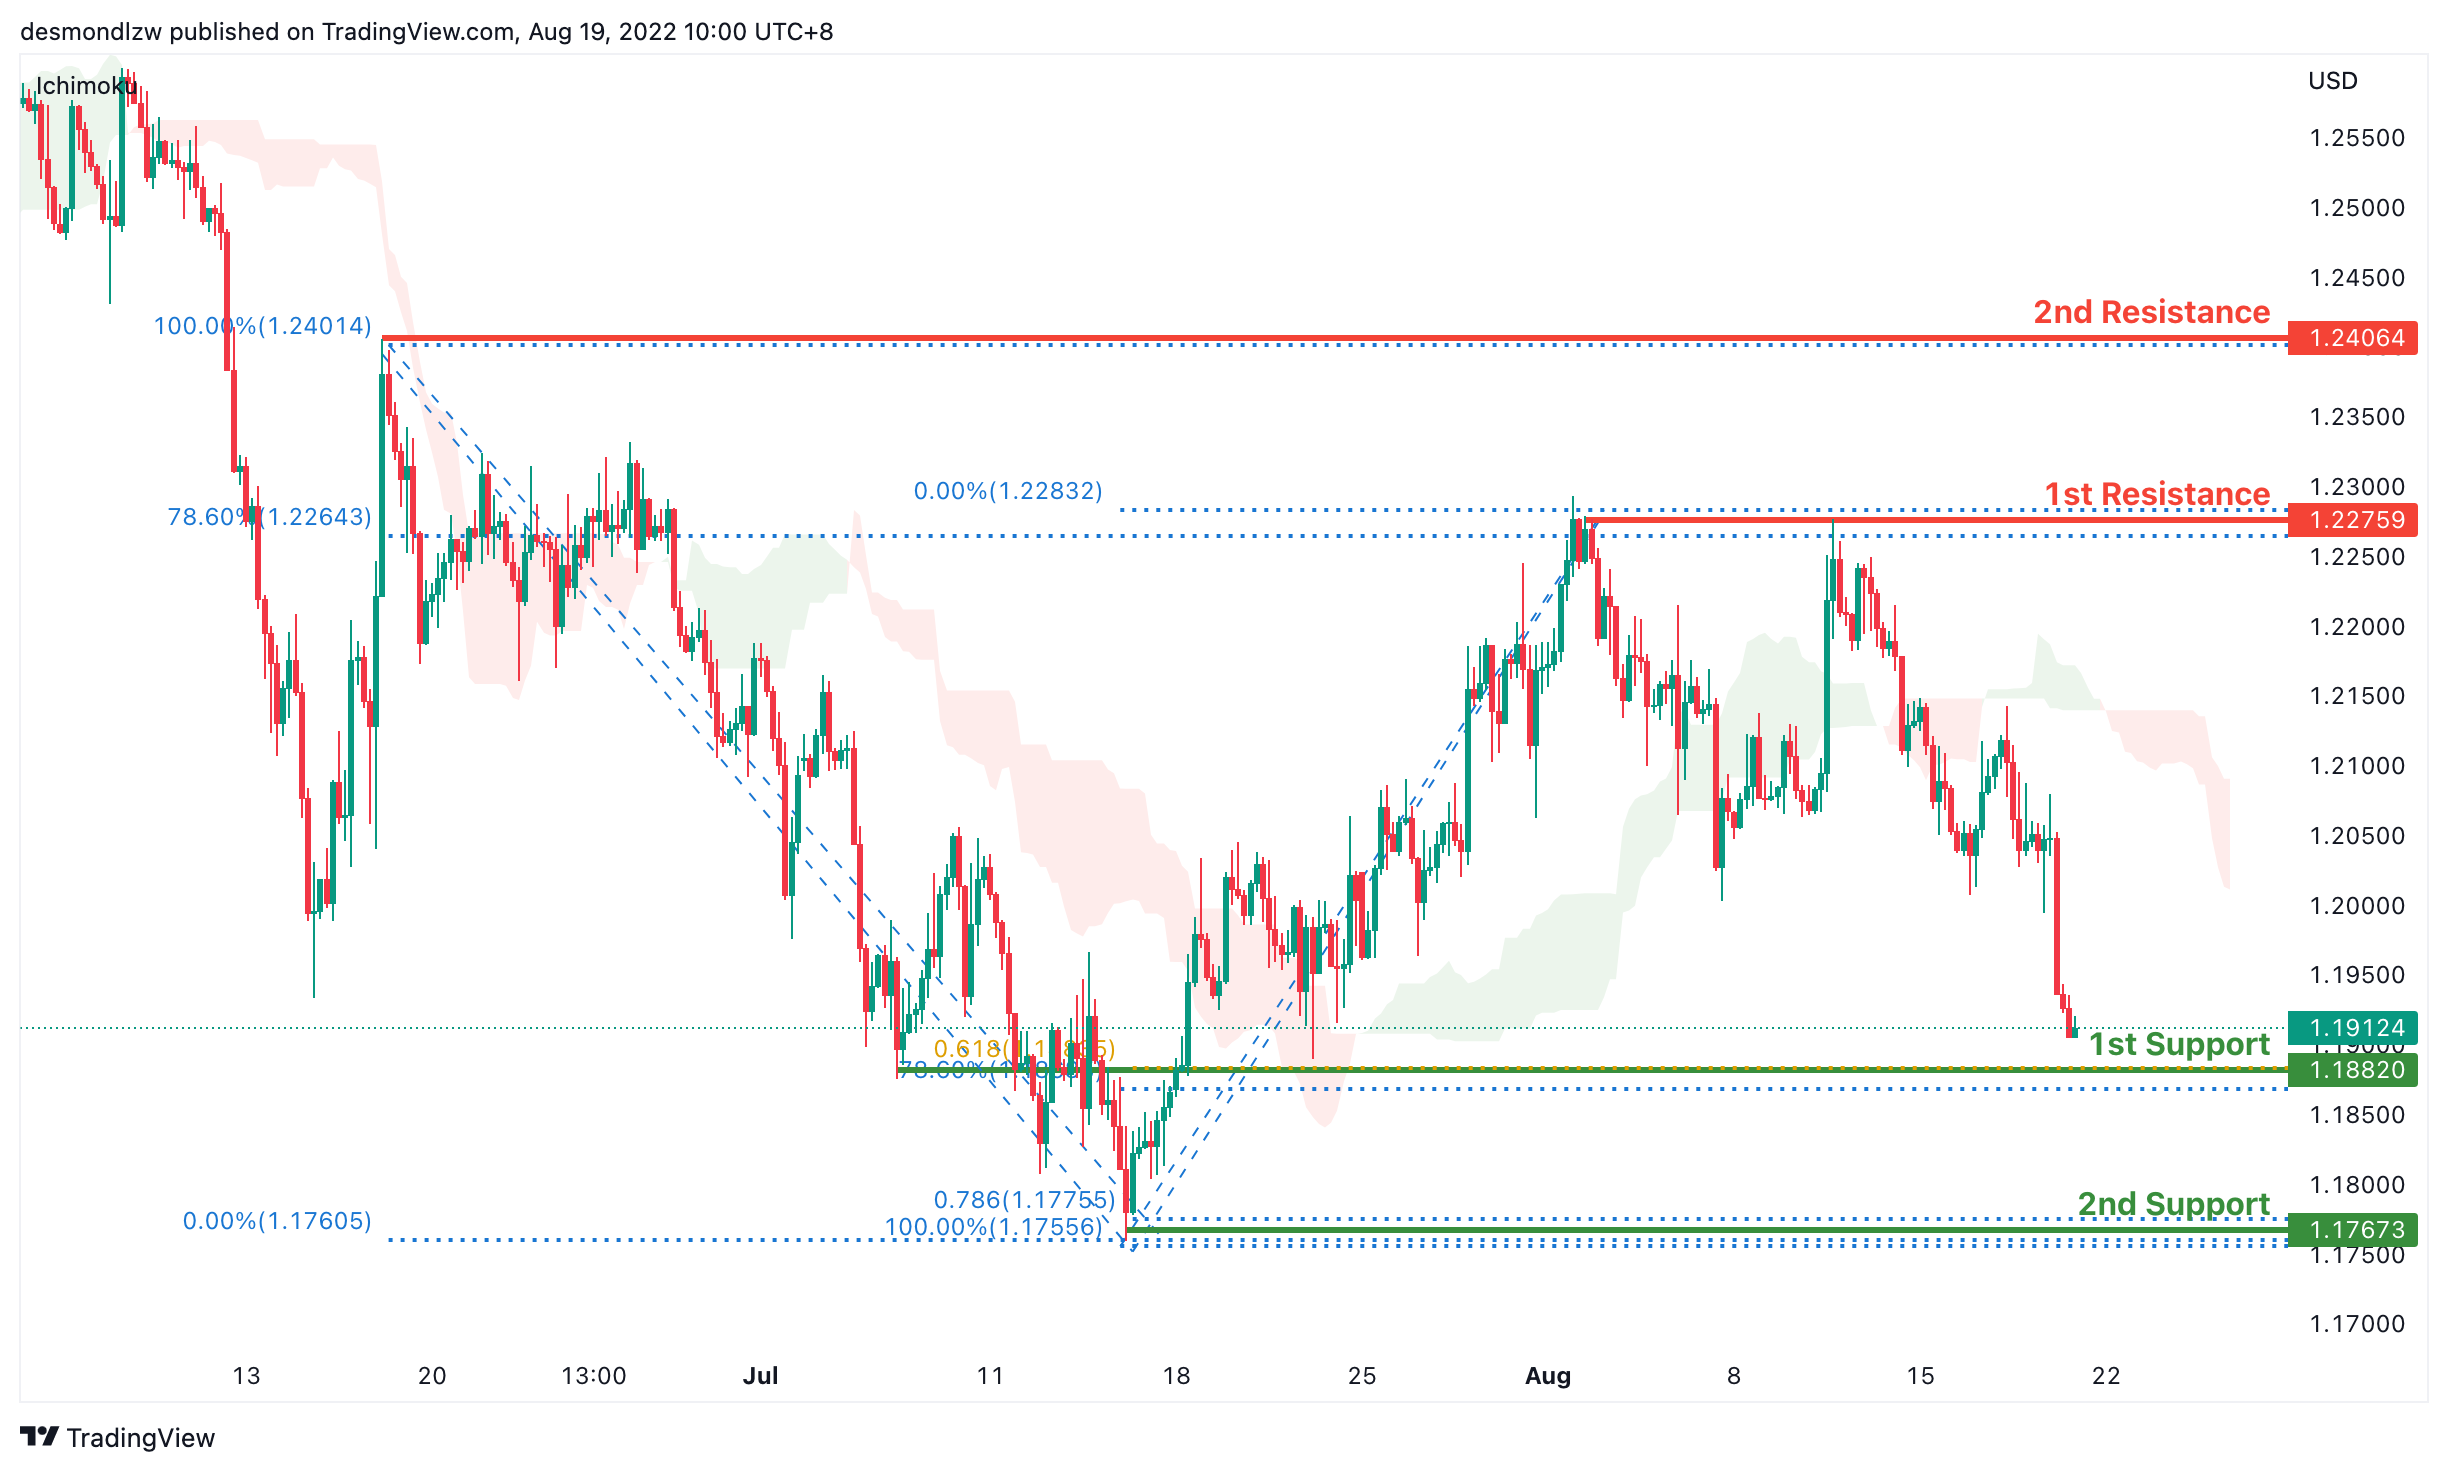
GBP/USD:
On the H4, prices seem to be in a bearish momentum and respecting the ichimoku cloud. It has tested the first support at 1.1722 where the swing low sits and has now slightly reversed. Alternatively, if price fails to break the first support at 1.1722, it can pull back to test the first resistance at 1.1920 where the 38.2% retracement and 61.8% projection sits. Subsequently testing the second resistance at 1.2015 where the swing low sits
Areas of consideration:
- H4 1st resistance at 1.1920
- H4 1st support at 1.1722
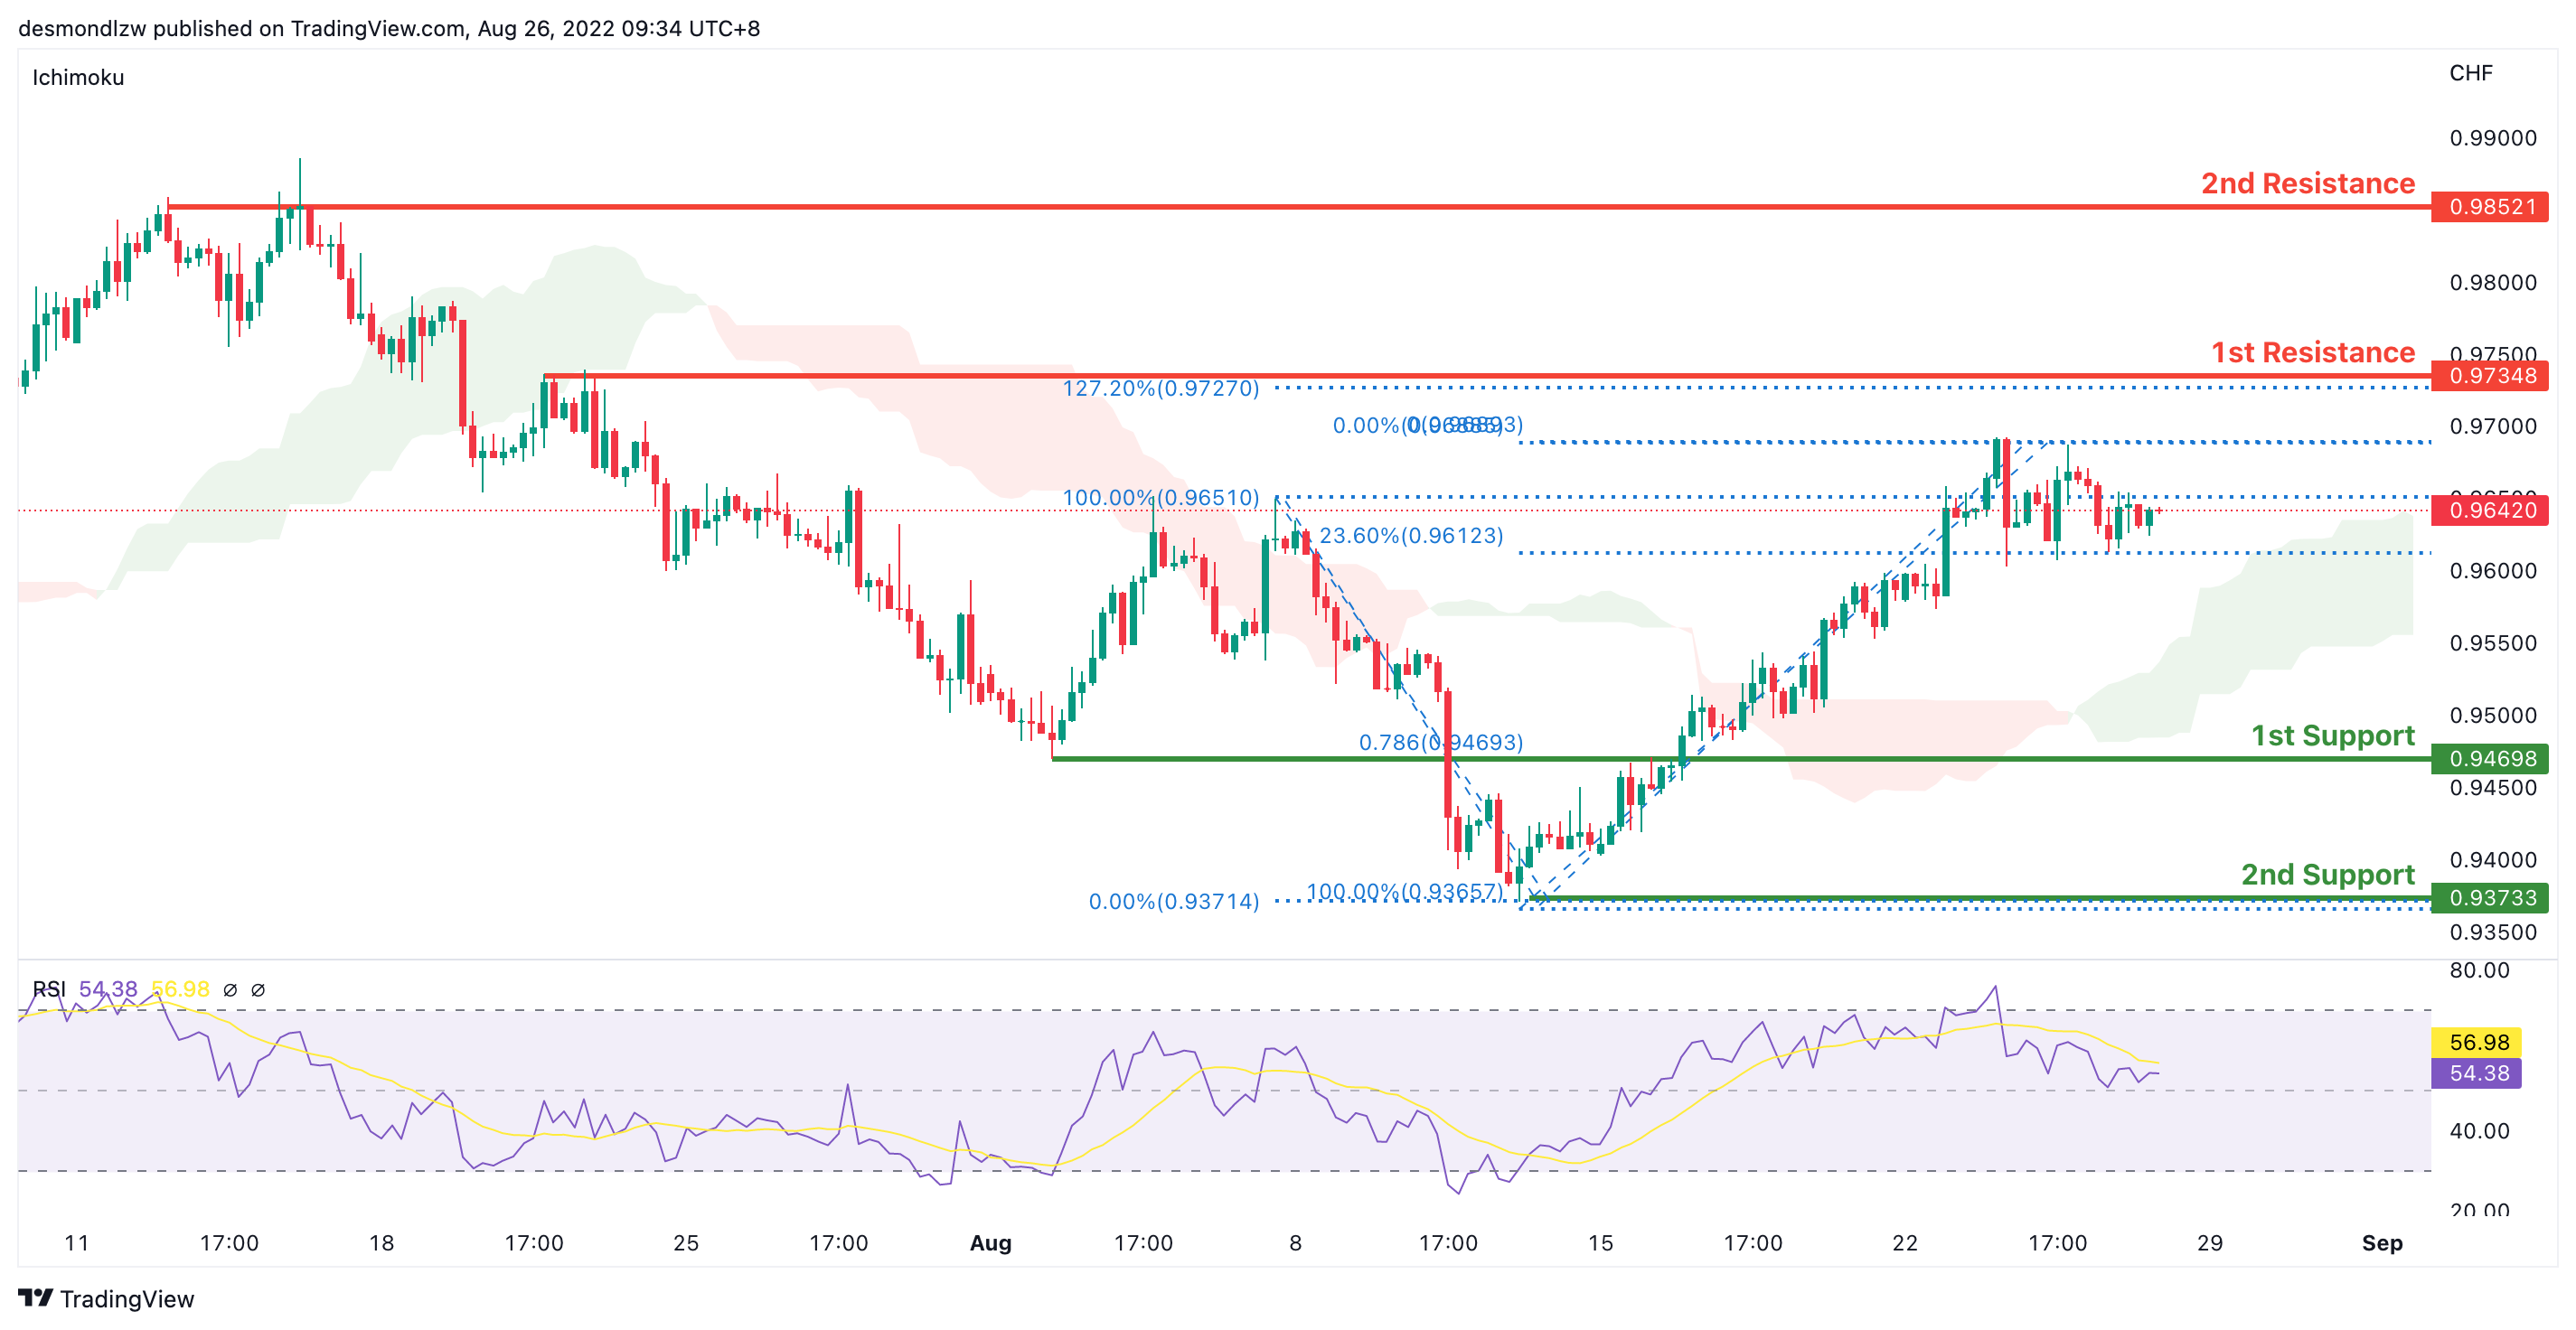
USD/CHF:
On the H4, with prices moving above the ichimoku cloud and breaking the descending trend, we are bullish bias. We’re looking at price to test the first resistance at 0.9734 where the 127.2% extension sits. If price continues with bullish momentum, it will bring price to second resistance at 0.9852. Alternatively, prices could test the intermediate support at 0.95500 where the swing low sits and then the first support at 0.9469 where the 78.6% fibonacci retracement sits
Areas of consideration
- H4 1st support at 0.9469
- H4 1st resistance at 0.9734
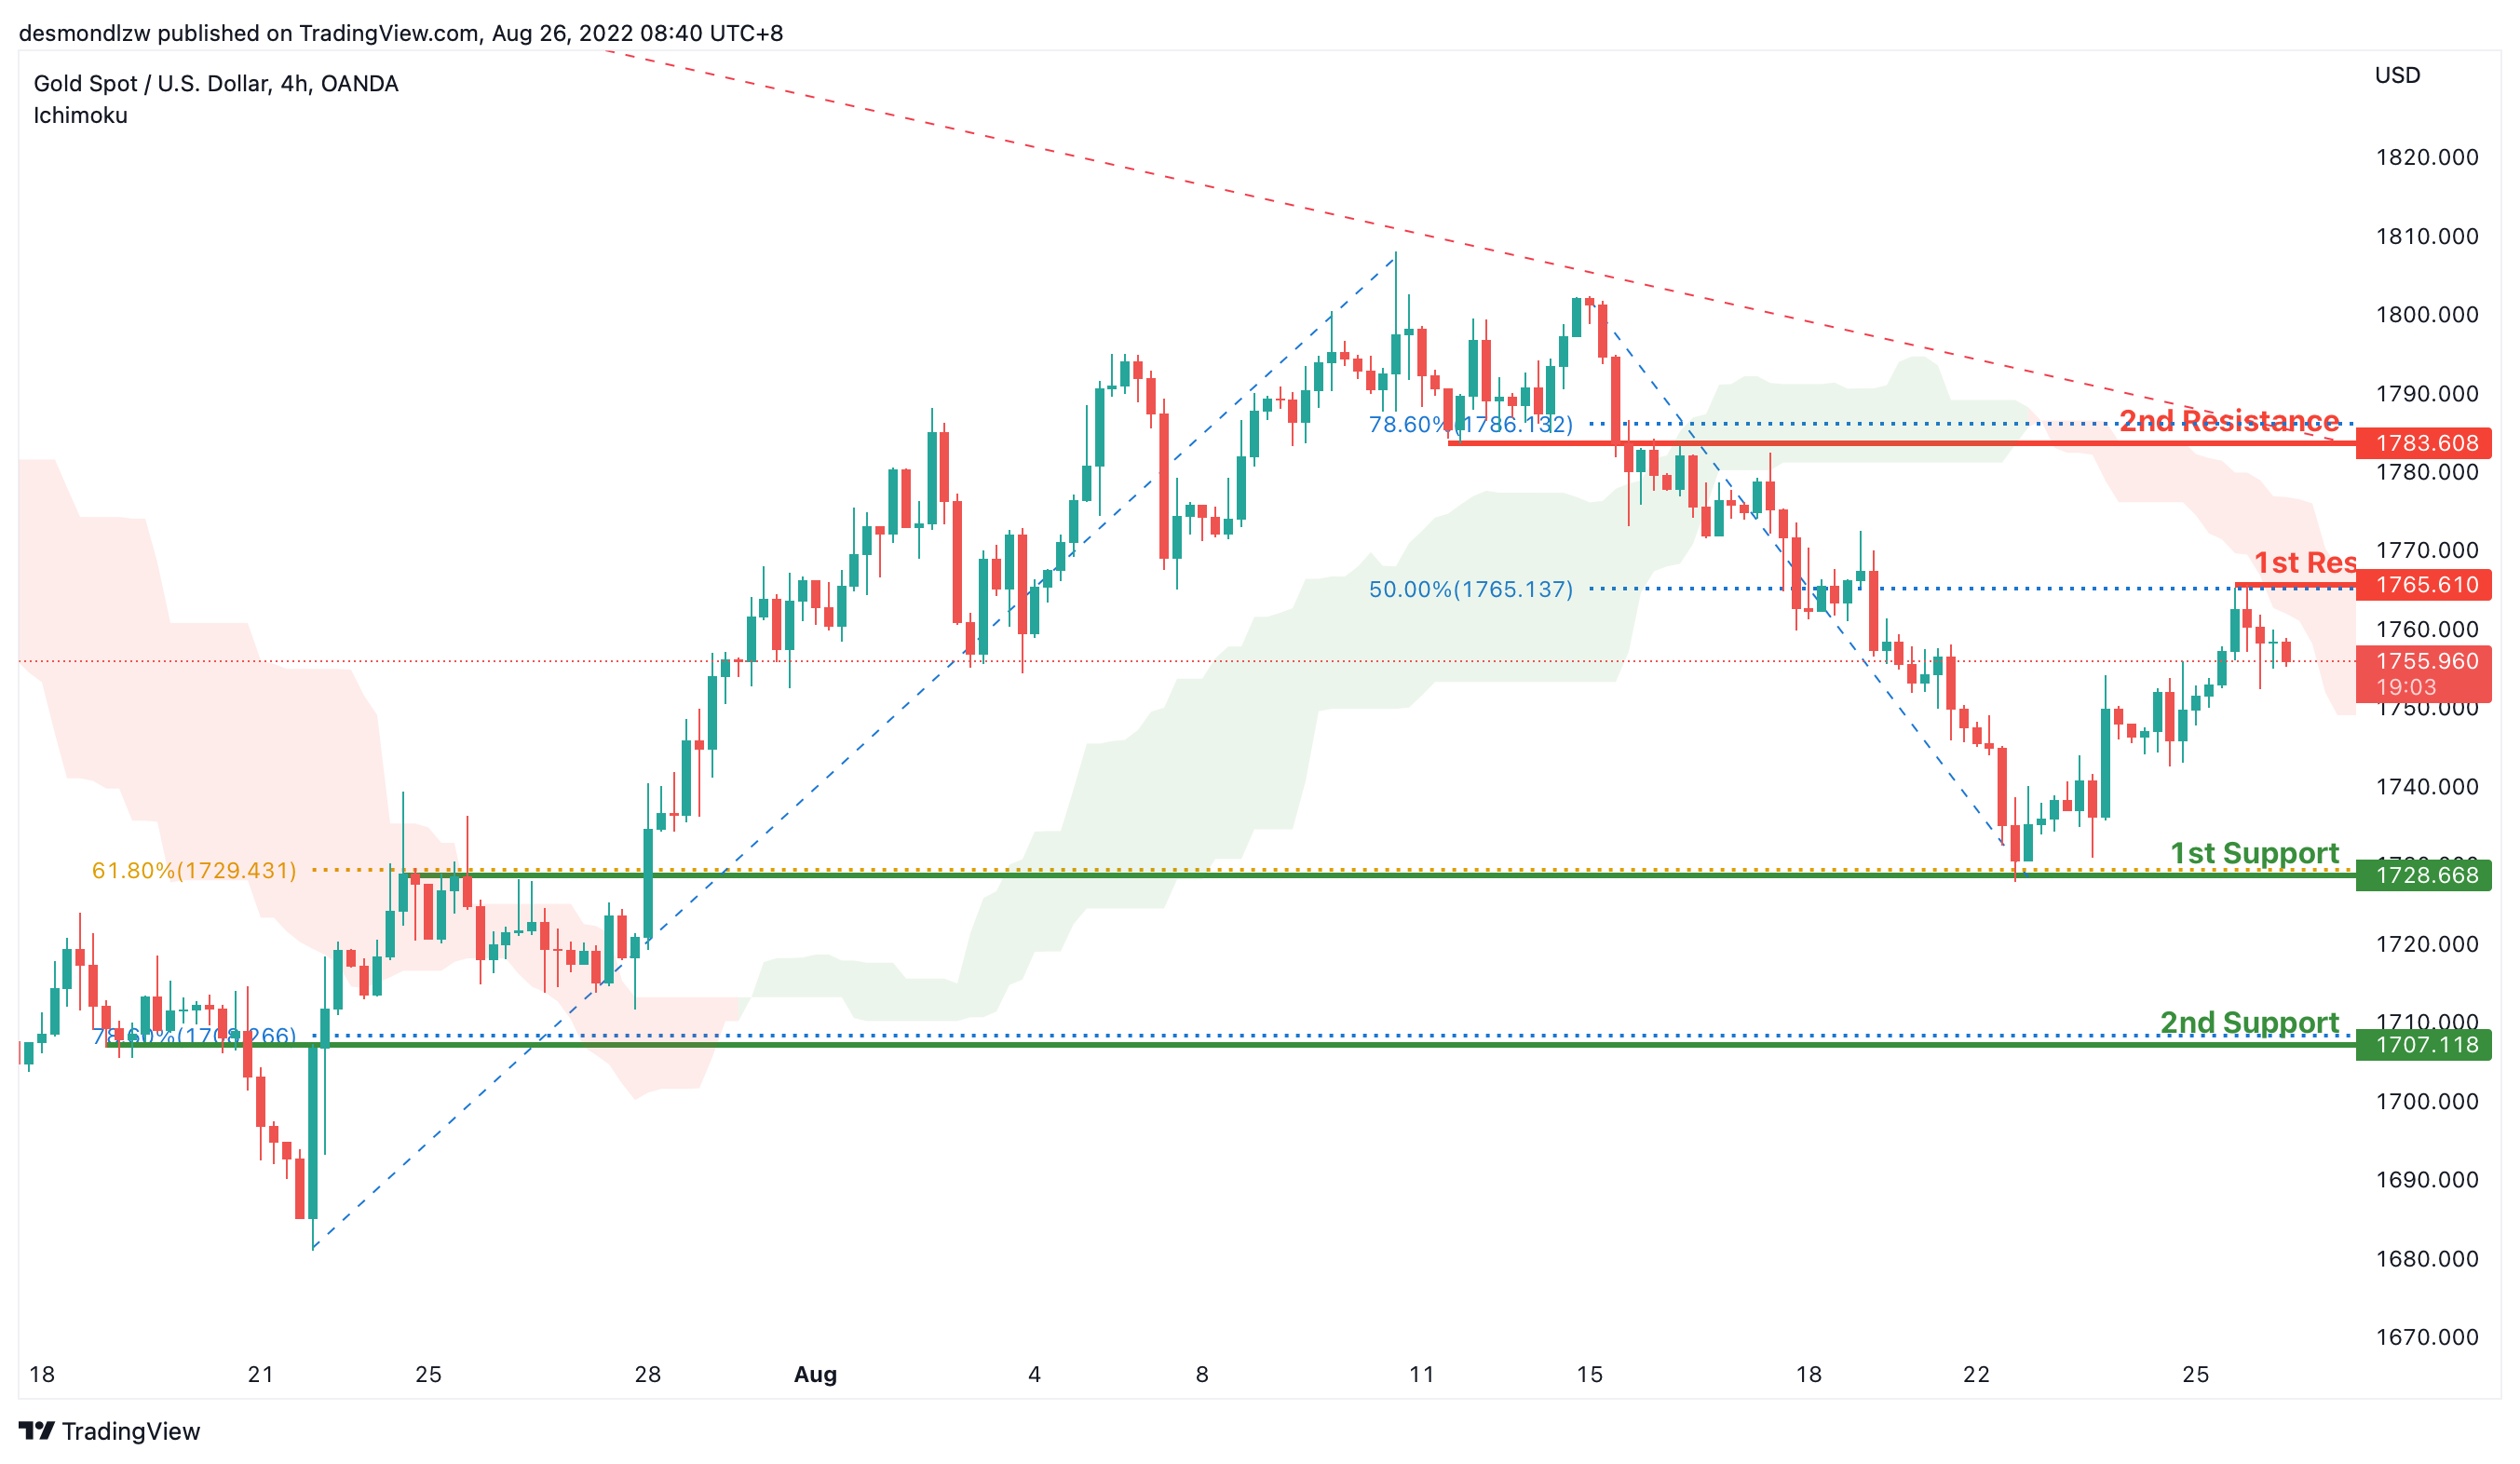
XAU/USD (GOLD):
On the H4, with prices moving within the descending trendline, below ichimoku cloud, we have a bearish bias. After pulling back and testing the 1st resistance at 1765.610 where the 50% fibonacci retracement is, now the price may drop to the 1st support at 1728.668, where the overlap support and 61.8% fibonacci retracement are. If the price break the 1st support, it may drop to the 2nd support at 1707.118 where the 78.6% fibonacci retracement is.
Alternatively, price may rise to the 1st resistance at 1765.960 again and then rise to the 2nd resistance at 1783.608, where the 78.6% fibonacci retracement is.
Areas of consideration:
- H4 time frame, 1st resistance at 1765.960
- H4 time frame, 1st support at 1728.668
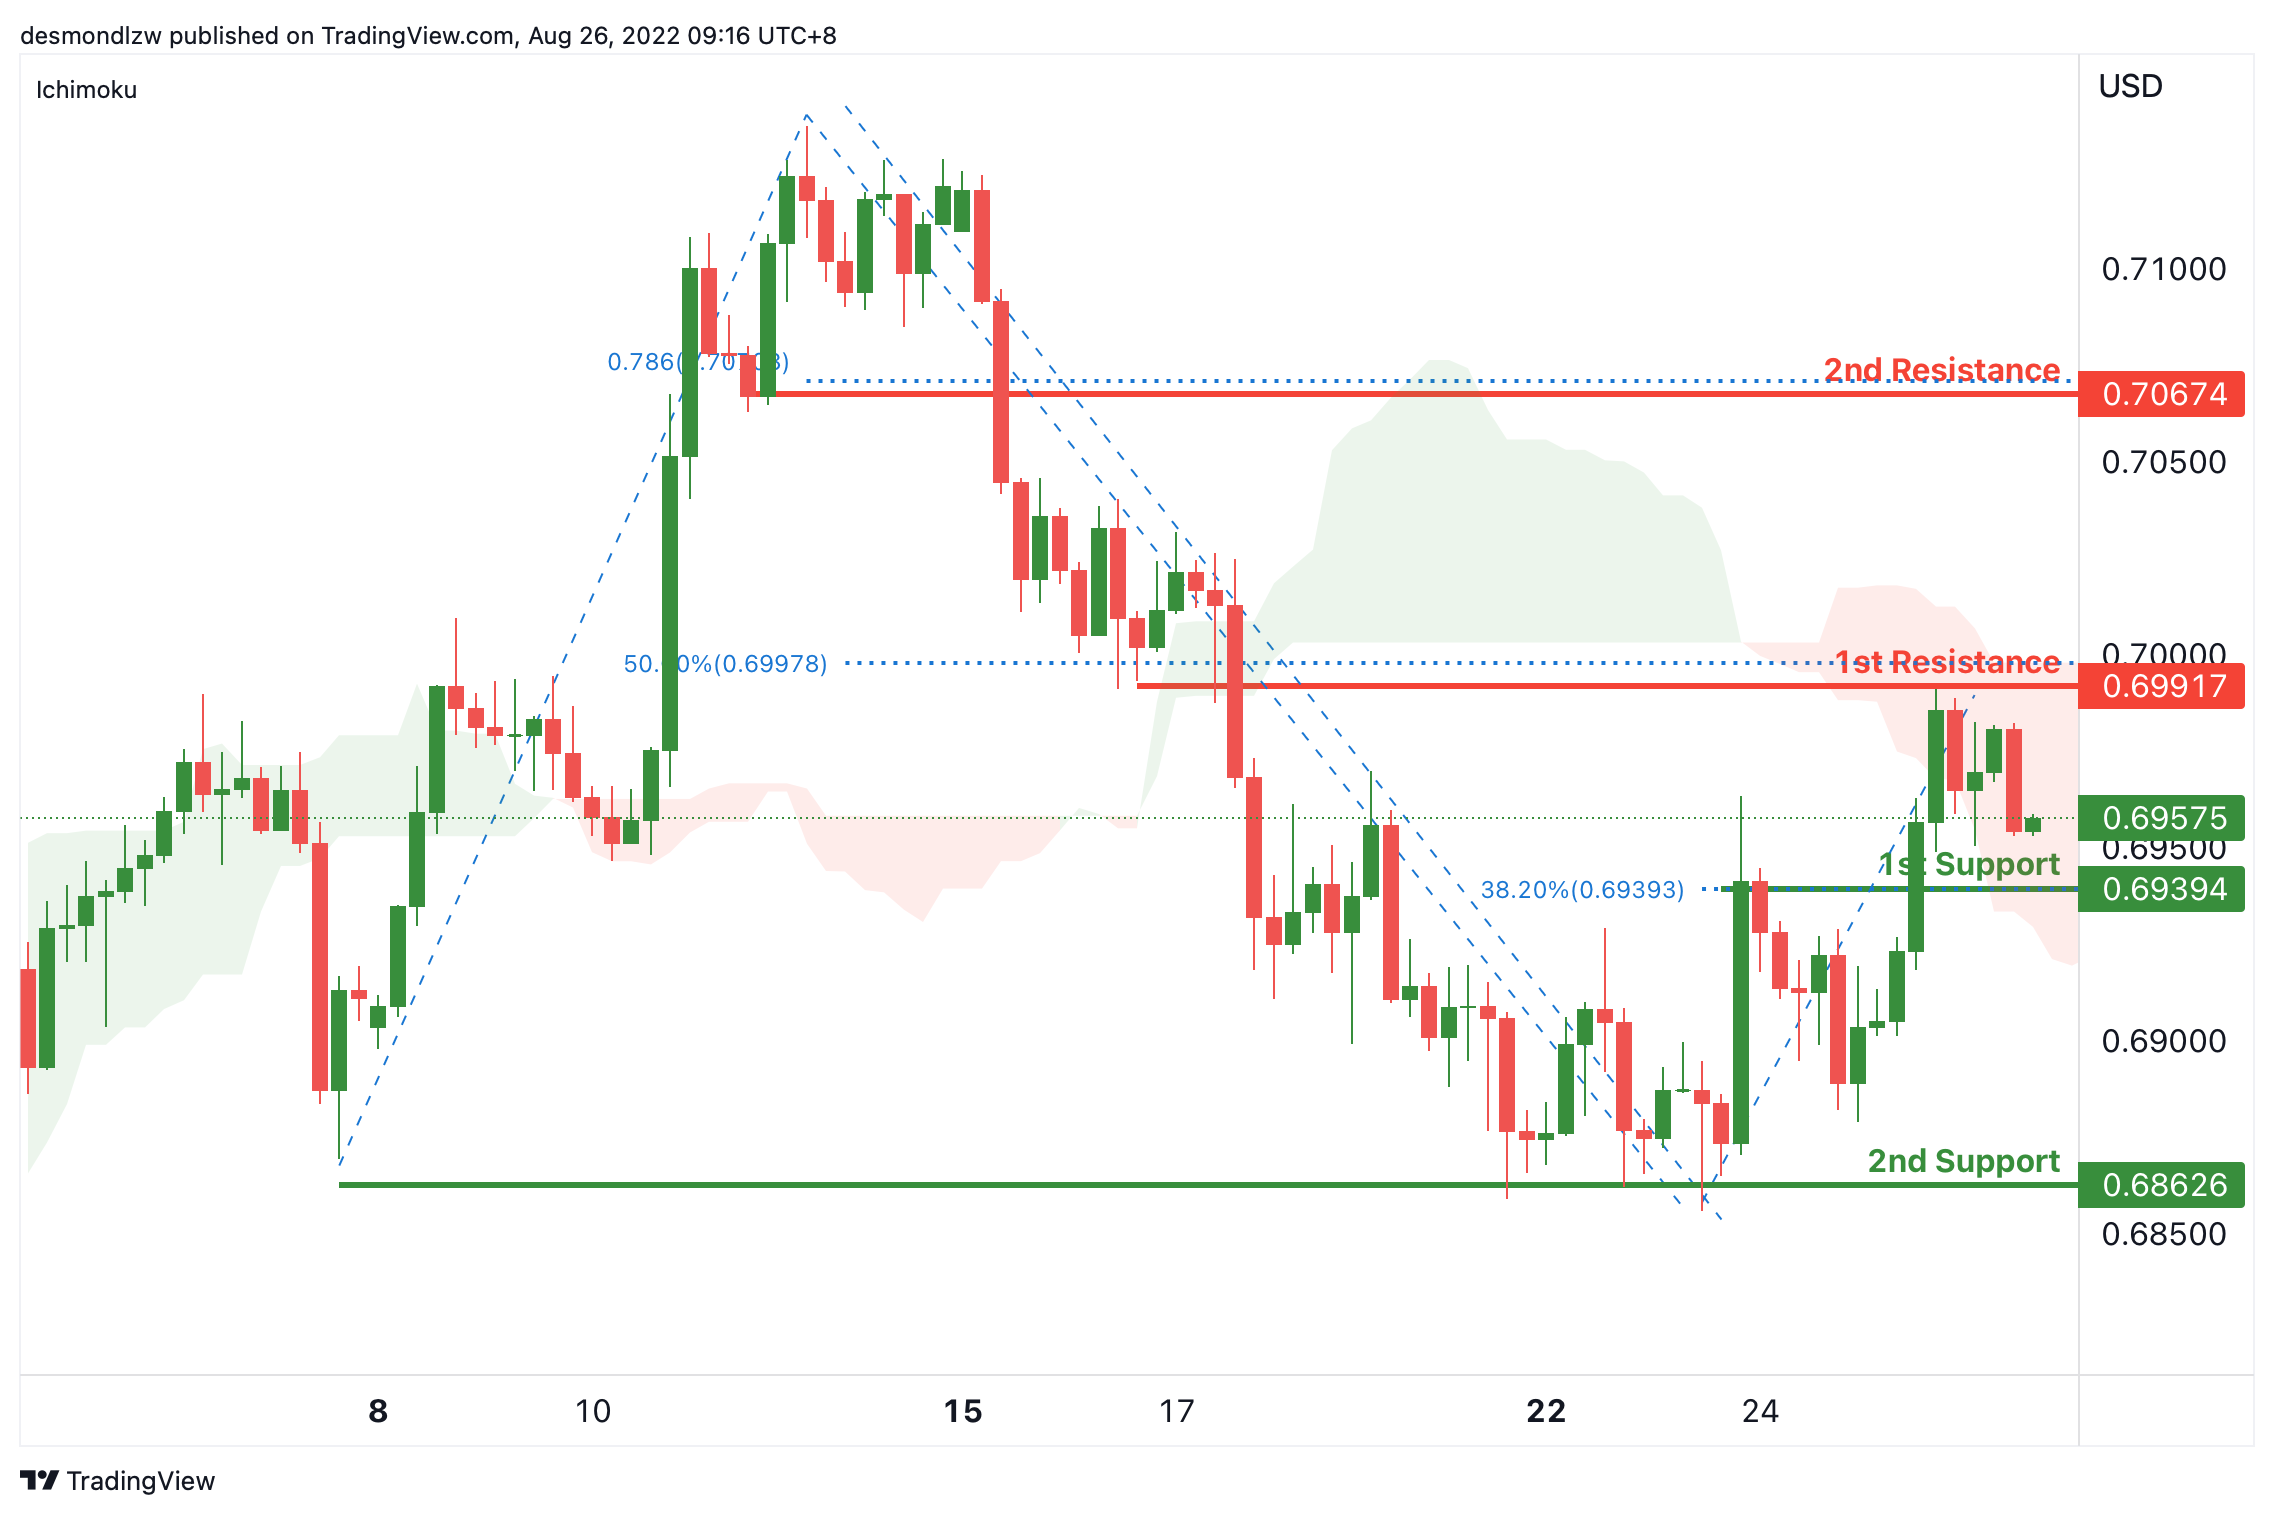
AUD/USD:
On the H4, with the price moving below the resistance of ichimoku cloud, we have a bearish bias that the price may drop from 1st support at 0.69394, where the 38.2% fibonacci retracement is to the 2nd support at 0.68626, which is in line with the swing lows. Alternatively, the price may rise to the 1st resistance at 0.69917, where the overlap resistance and 50% fibonacci retracement, if the price breaks this level, the 2nd resistance could be at 0.70674, which is in line with 78.6% fibonacci projection.
Areas of consideration
- H4 1st support at 0.69394
- H4 2nd support at 0.68626
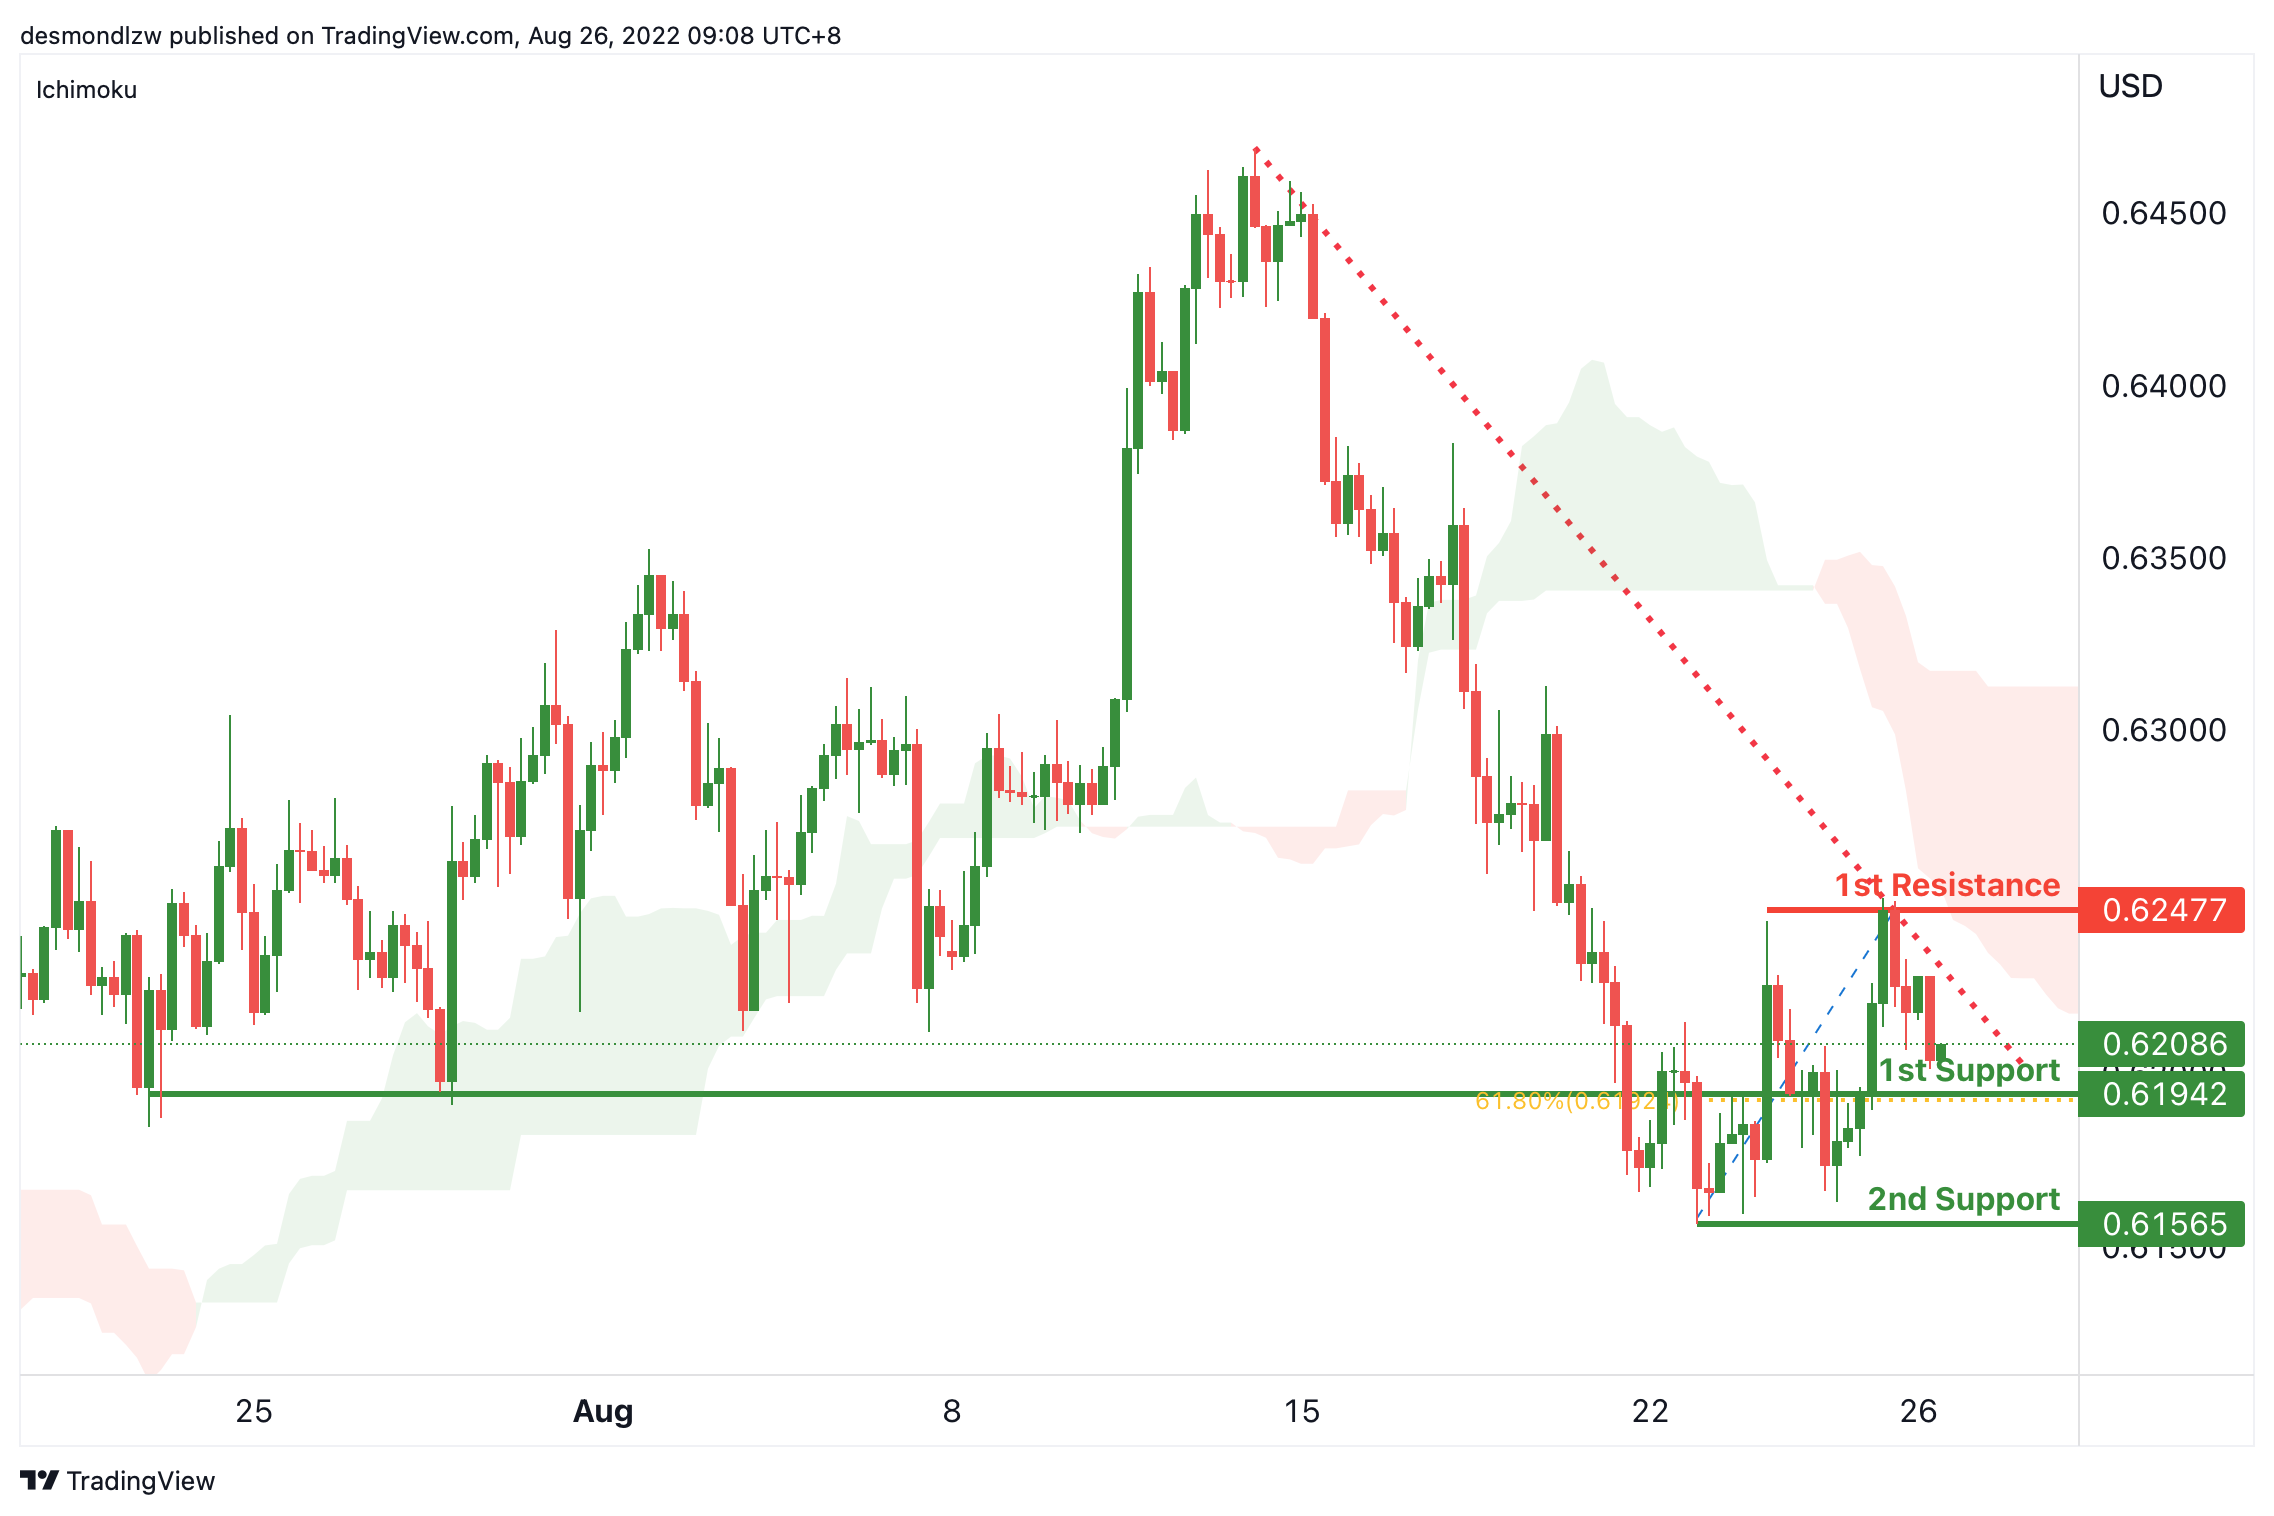
NZD/USD:
On the H4, with price moving within the descending trendline and below the ichimoku indicator, we have a bearish bias that price will drop from 1st support at 0.61942, where the overlap support and 61.8% fibonacci retracement are to the 2nd support at 0.61565, where the swing low is. Alternatively, price could rise to 1st resistance at 0.62477, which is in line with the swing highs.
Areas of consideration:
- H4 time frame, 1st support at 0.61942
- H4 time frame, 2nd support at 0.61565
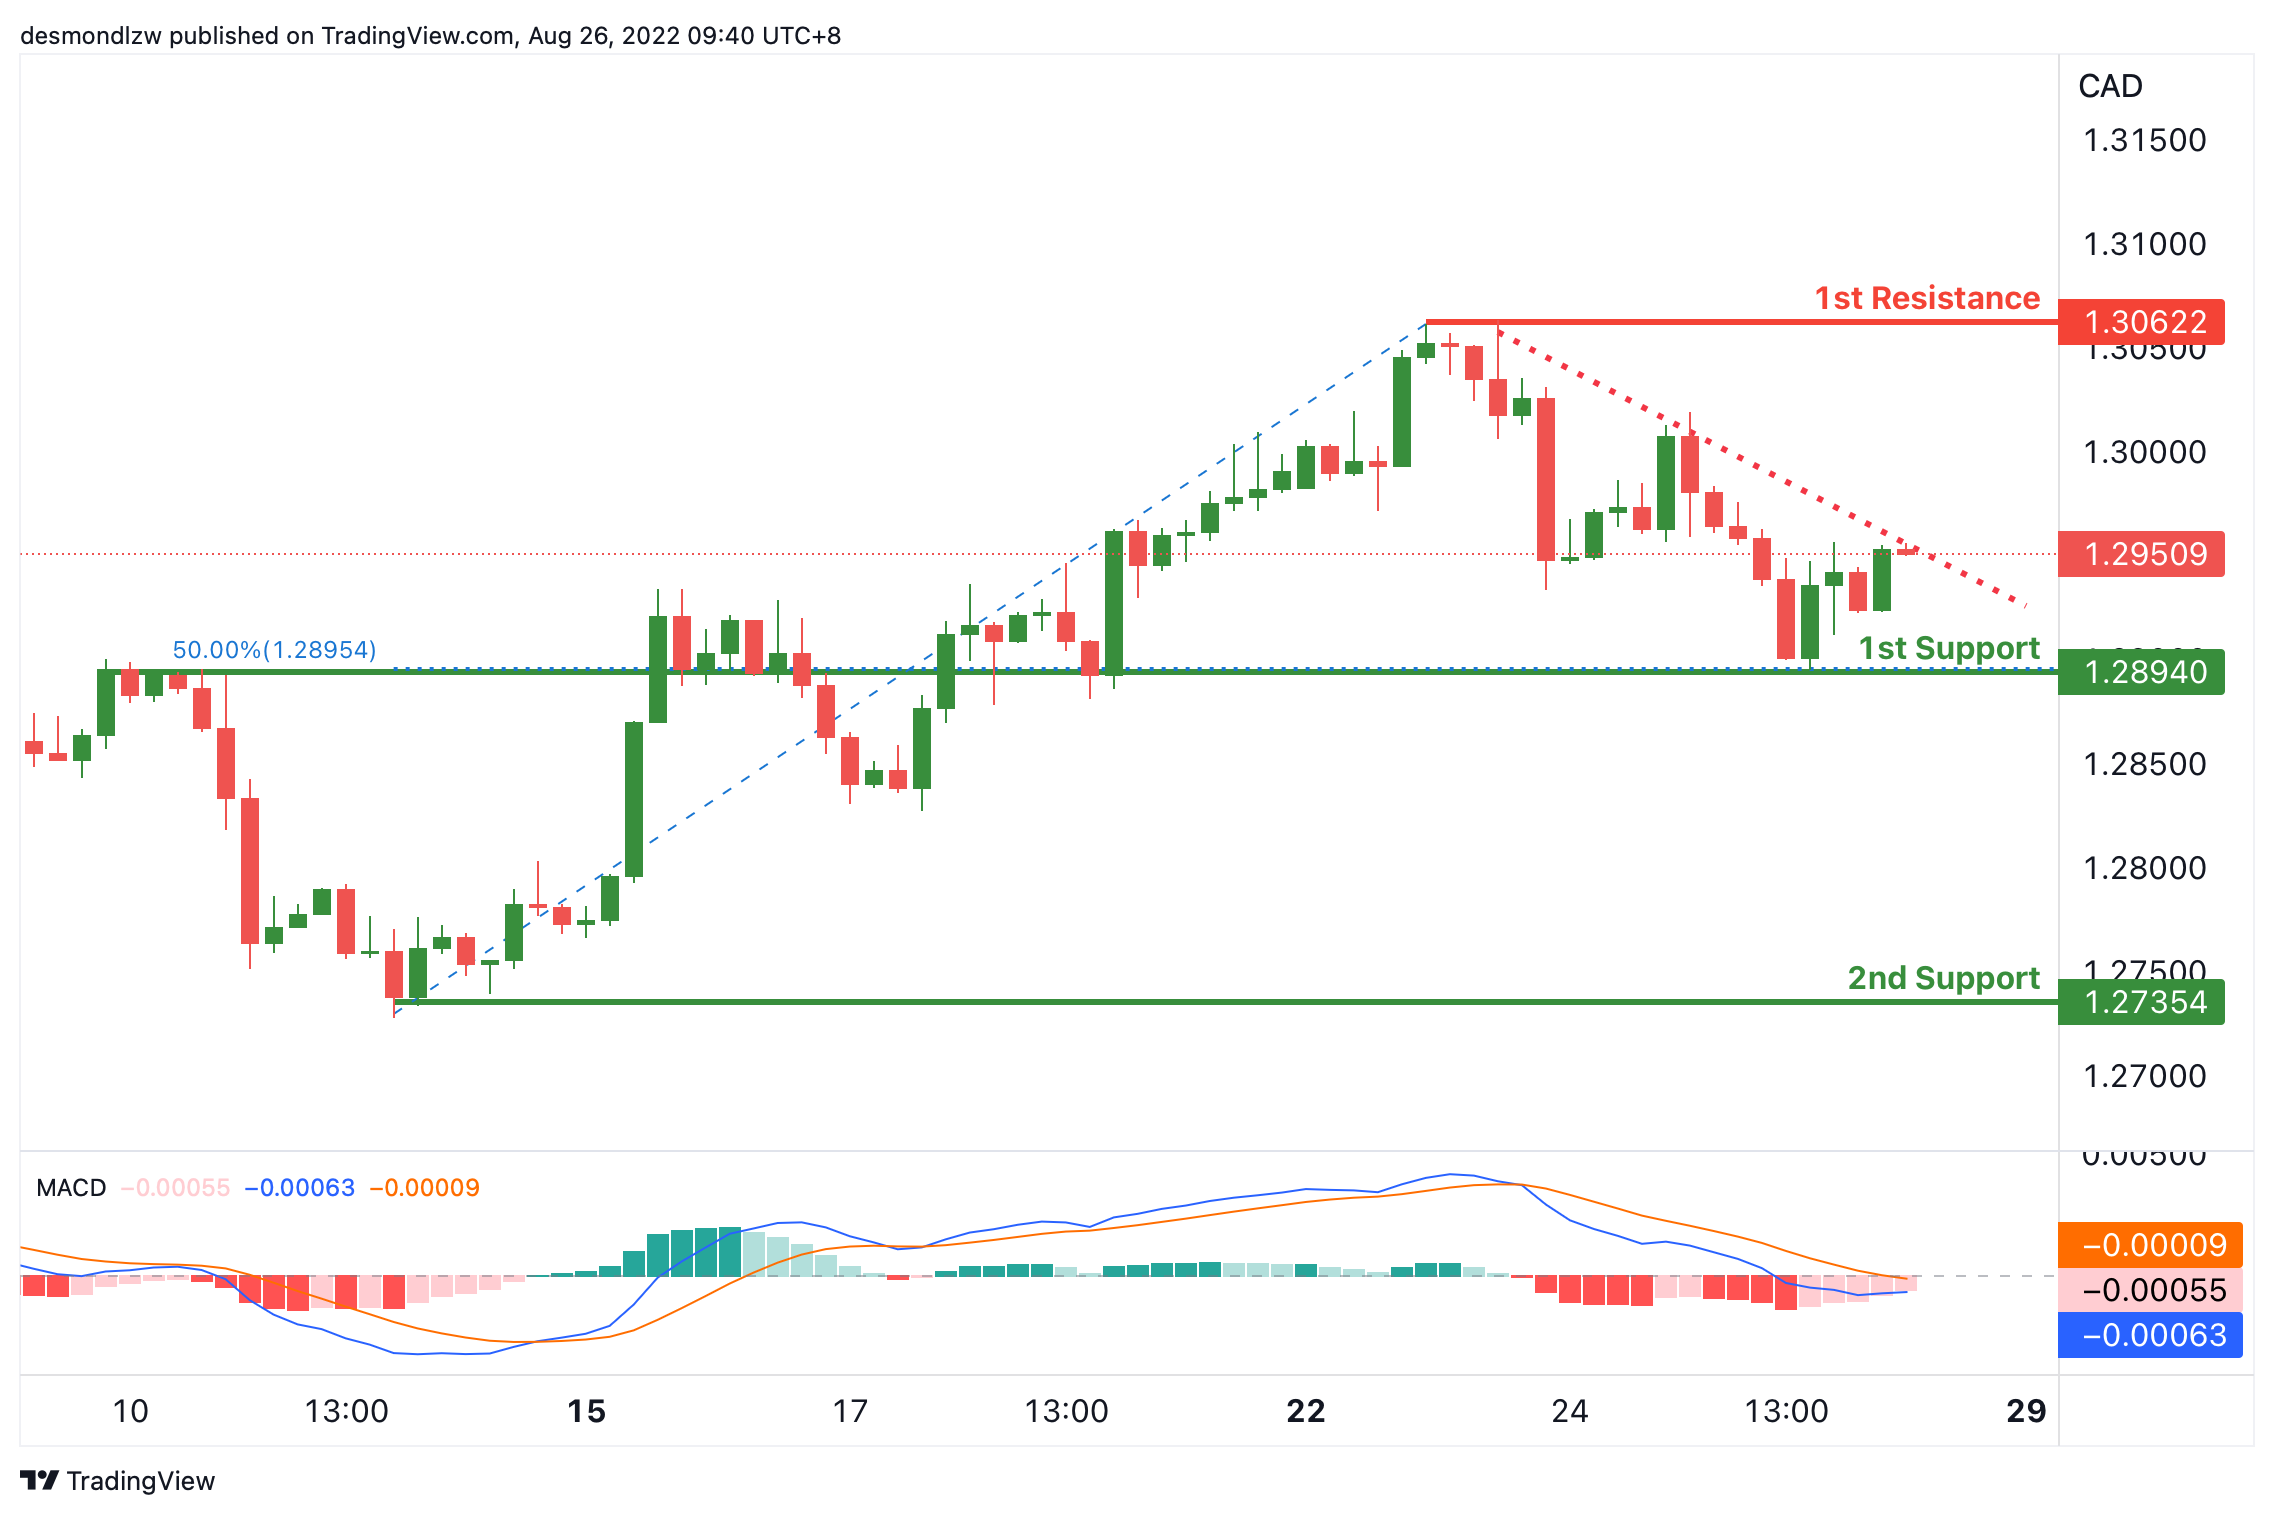
USD/CAD:
On the H4, with the price moving below the descending trendline and MACD indicators are below zero, we have a bearish bias that the price may drop form the 1st support at 1.28940, where the 50% fibonacci retracement and overlap support are to the 2nd support at 1.27354, where the swing low is. Alternatively, price could break the descending trendline and rise to the 1st resistance at 1.30622, where the swing high is.
Areas of consideration:
- H4 time frame, 1st support at 1.28940
- H4 time frame, 2nd support at 1.27354
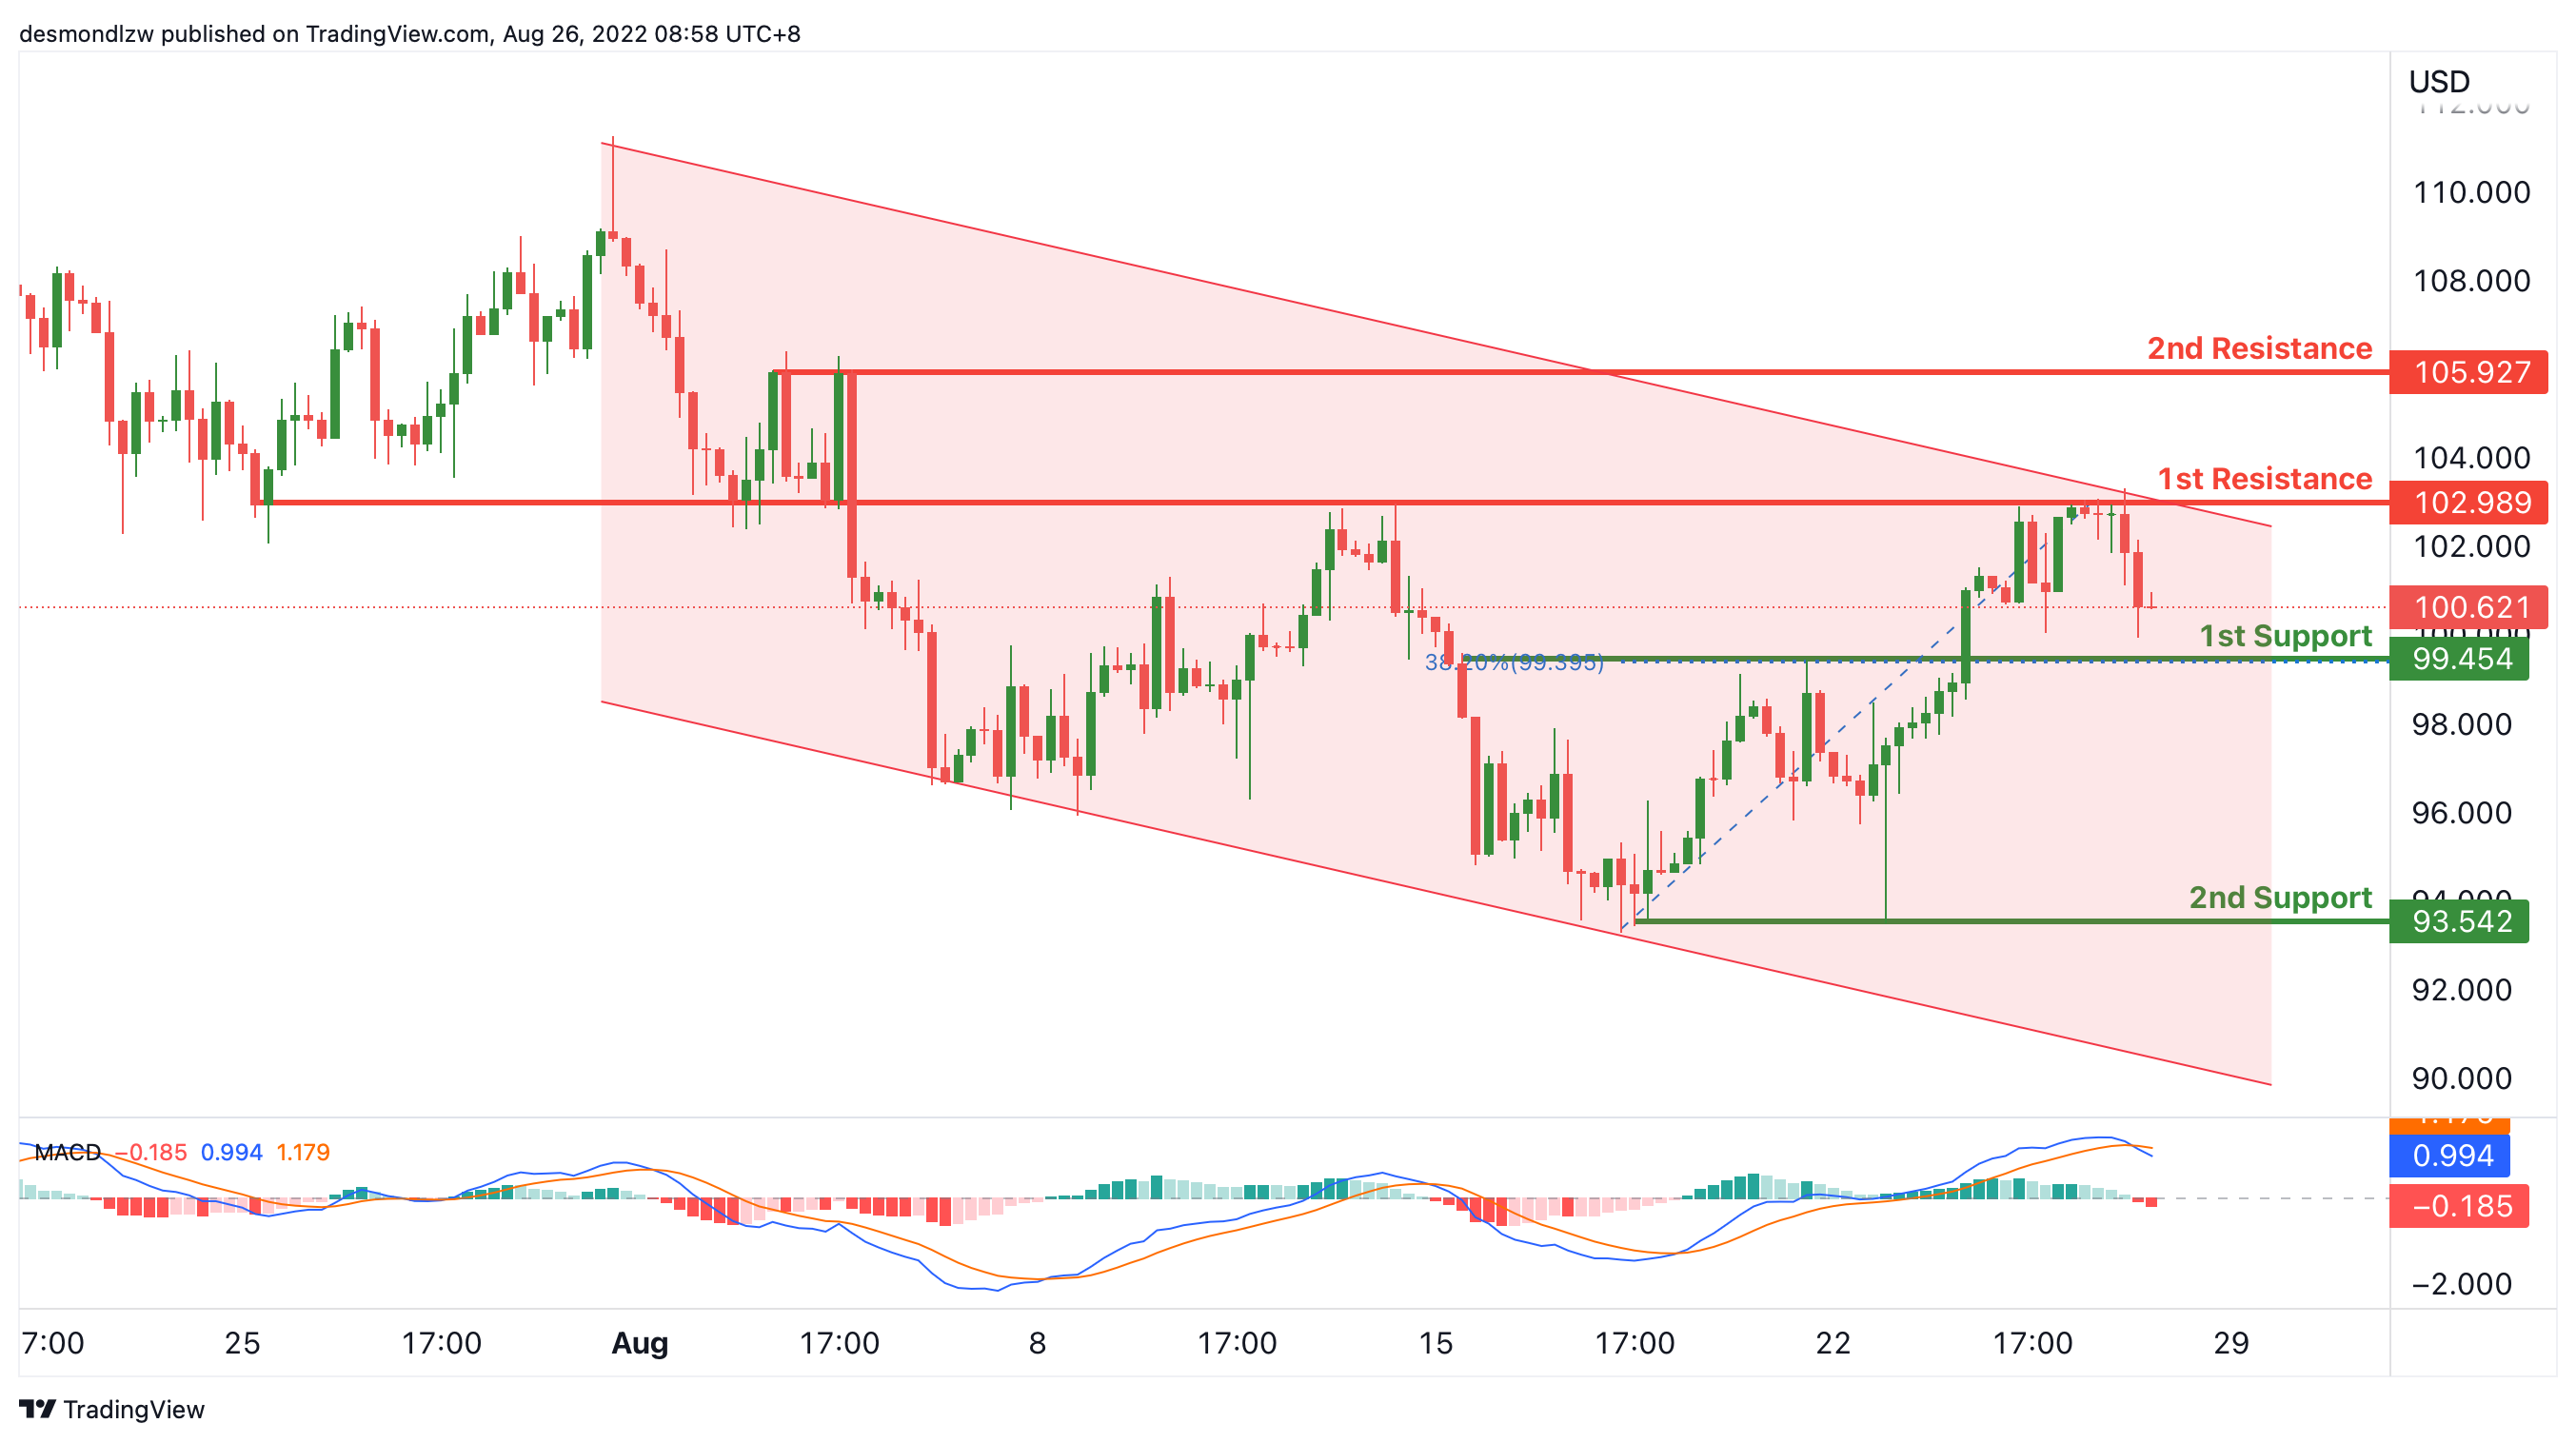
OIL:
On the H4, with price moving within the descending channel and DIF line is crossing below the signal line in MACD, we have a bearish bias that the price may drop from the 1st support at 99.454, where the 38.2% fibonacci retracement is to the 2nd support at 93.542, which is in line with the swing low support. Alternatively, the price may rise to the 1st resistance at 102.989, where the overlap resistance is. If the price break the 1st resistance, the price could reach the 2nd resistance at 105.927, where the swing high is.
Areas of consideration:
- H4 time frame, 1st support at 99.454
- H4 time frame, 2nd support at 93.542
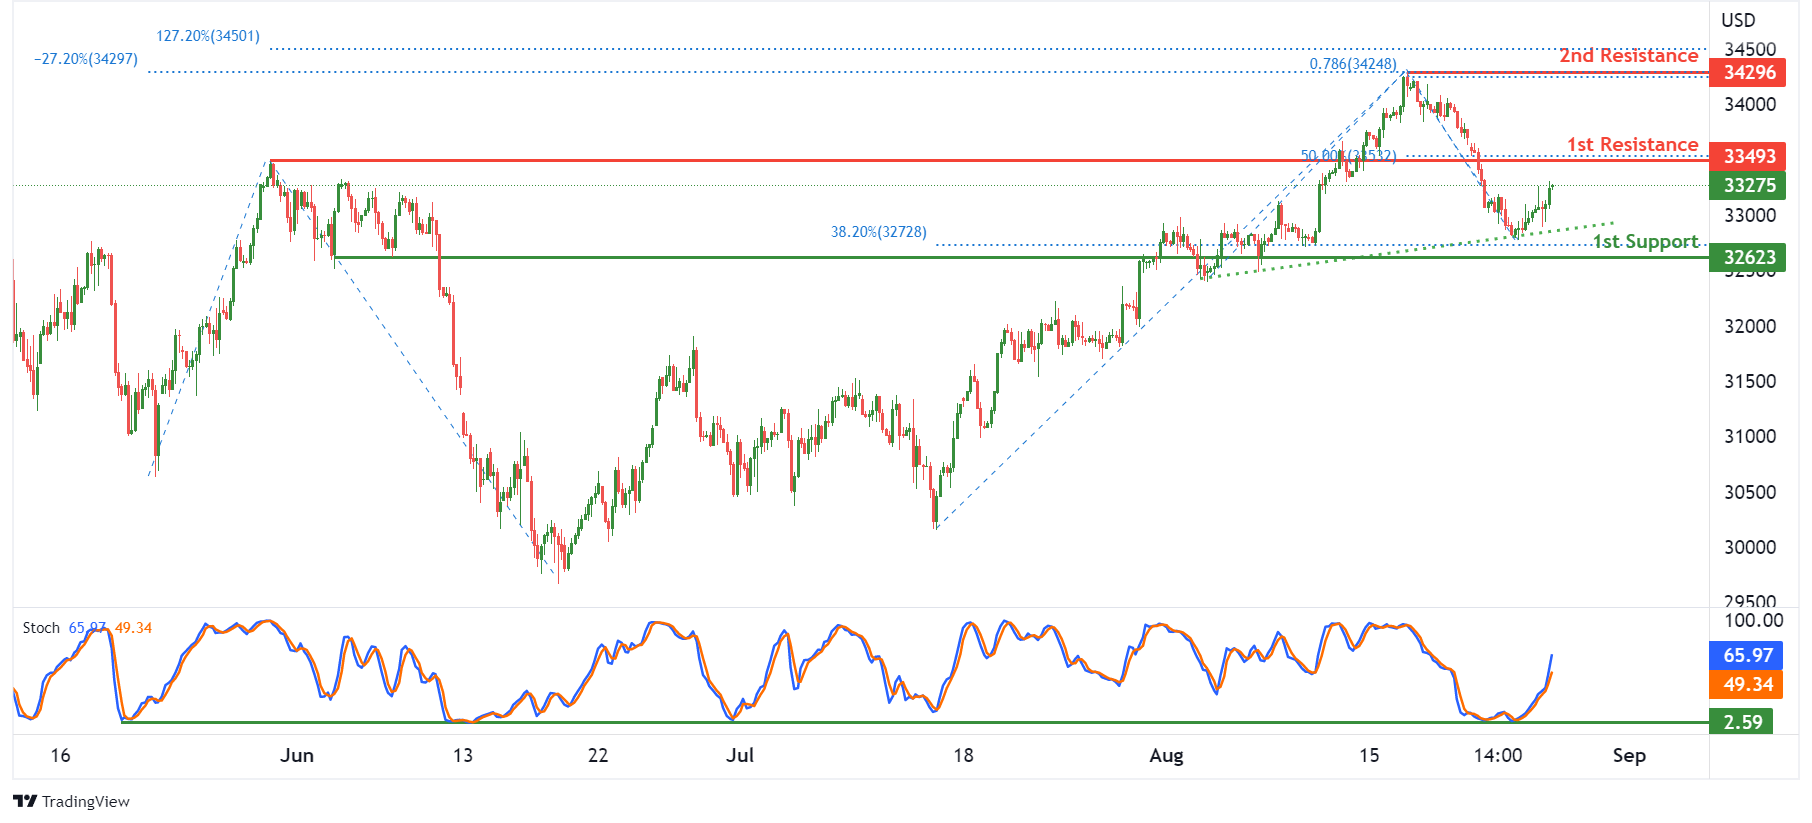
Dow Jones Industrial Average:
On the H4, with price moving along the ascending trendline and bouncing off the stochastic support,we have a bullish bias that price will rise to 1st resistance at 33493 where the pullback resistance and 50% fibonacci retracement are. Should price break 1st resistance, we would expect bullish momentum to carry price to 2nd resistance at 34296 where the swing high resistance, 127.2% fibonacci extension, -27.2% fibonacci expansion and 78.6% fibonacci projection are. Alternatively, price could drop to 1st support at 32623 where the pullback support and 38.2% fibonacci retracement are.
Areas of consideration:
- H4 time frame, 1st resistance of 33493
- H4 time frame, 1st support at 32623
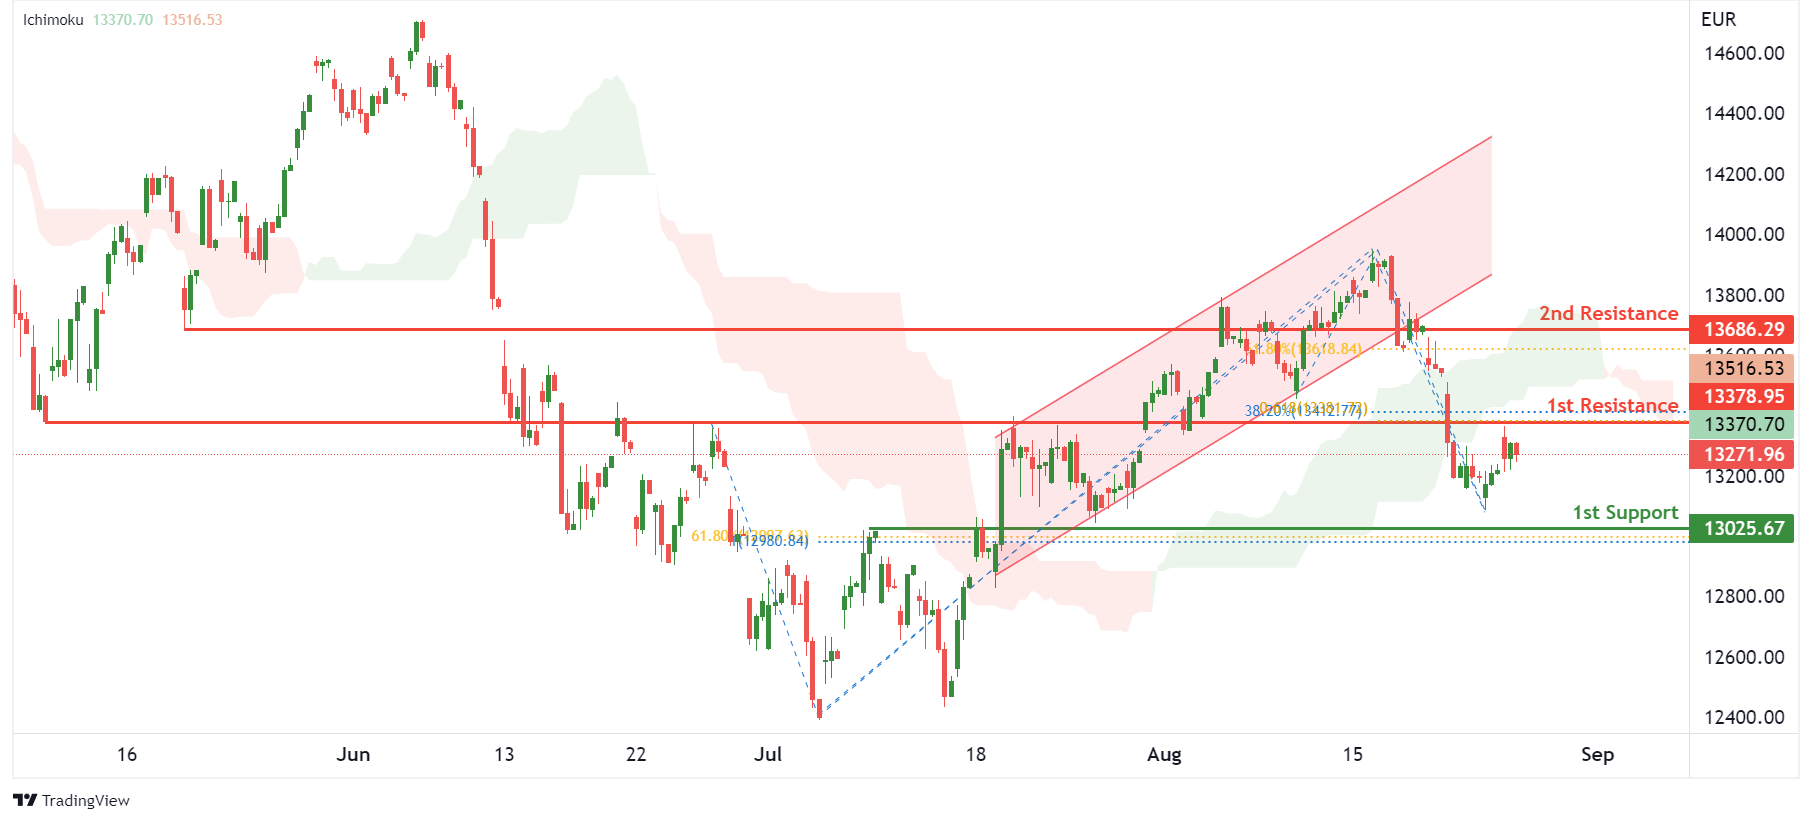
DAX:
On the H4, with price breaking out of an ascending channel and moving below the ichimoku indicator, we have a bearish bias that price will drop from 1st resistance at 13378.95 where the overlap resistance, 38.2% fibonacci retracement and 61.8% fibonacci projection are to the 1st support at 13025.67 where the pullback support, 61.8% fibonacci retracement and 100% fibonacci projection are. Alternatively, price could break 1st resistance and rise to 2nd resistance at 13686.29 where the pullback resistance and 61.8% fibonacci retracement are.
Areas of consideration:
- H4 time frame, 1st resistance of 13378.95
- H4 time frame, 1st support at 13025.67
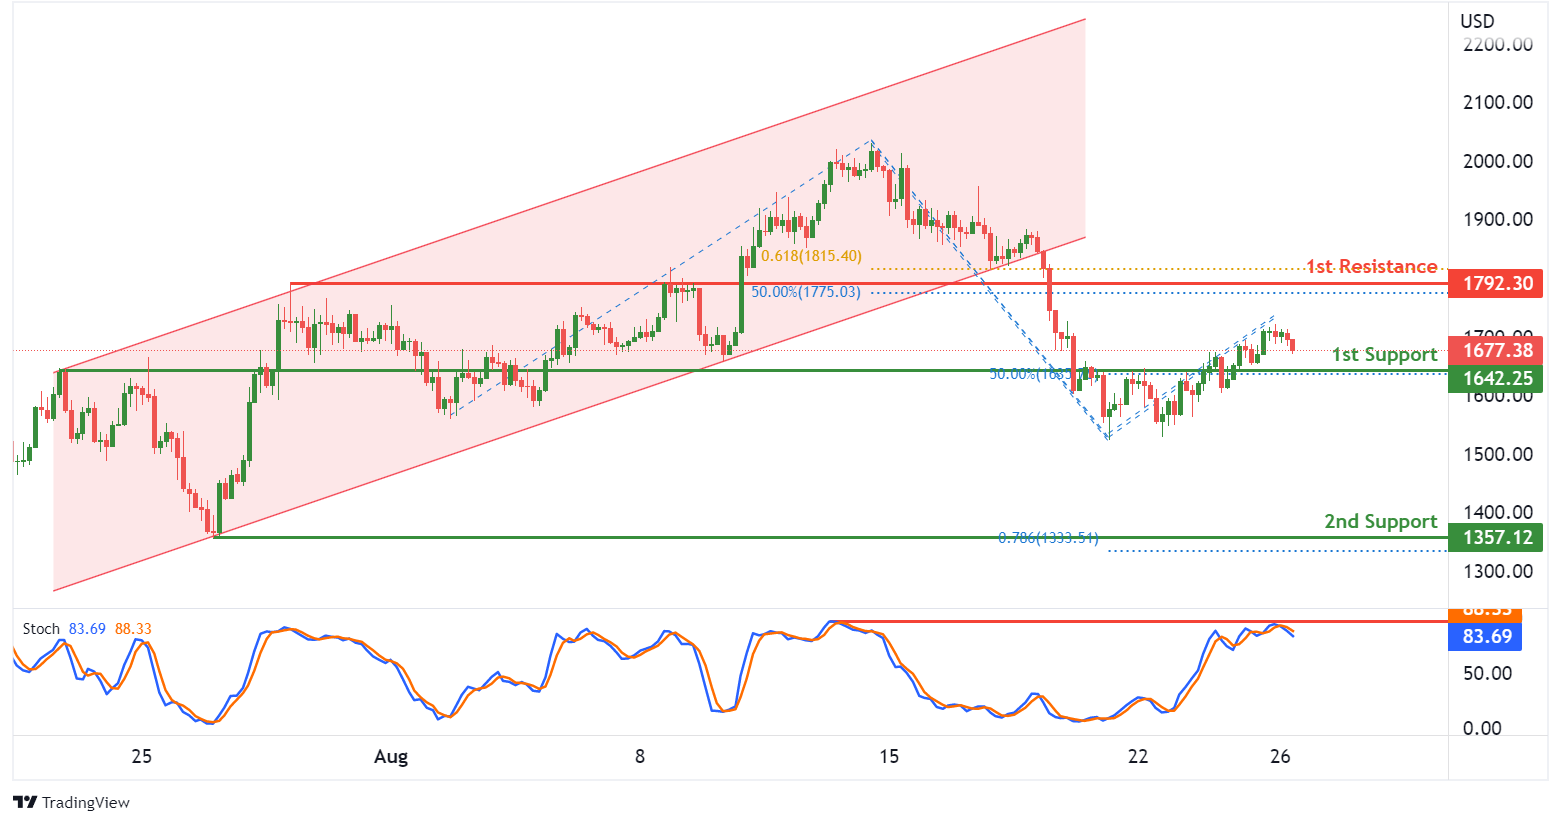
ETHUSD:
On the H4, with price breaking out of an ascending channel and reversing off the stochastic resistance, we have a bearish bias that price will drop to the 1st support at 1642.25 where the pullback support and 50% fibonacci retracement are. Once there is downside confirmation that price has broken 1st support, we would expect bearish momentum to carry price to 2nd support at 1357.12 where the swing low support and 78.6% fibonacci projection are. Alternatively, price could rise to 1st resistance at 1792.30 where the overlap resistance, 50% fibonacci retracement and 61.8% fibonacci projection are.
Areas of consideration:
- H4 time frame, 1st resistance of 1792.30
- H4 time frame, 1st support at 1642.25
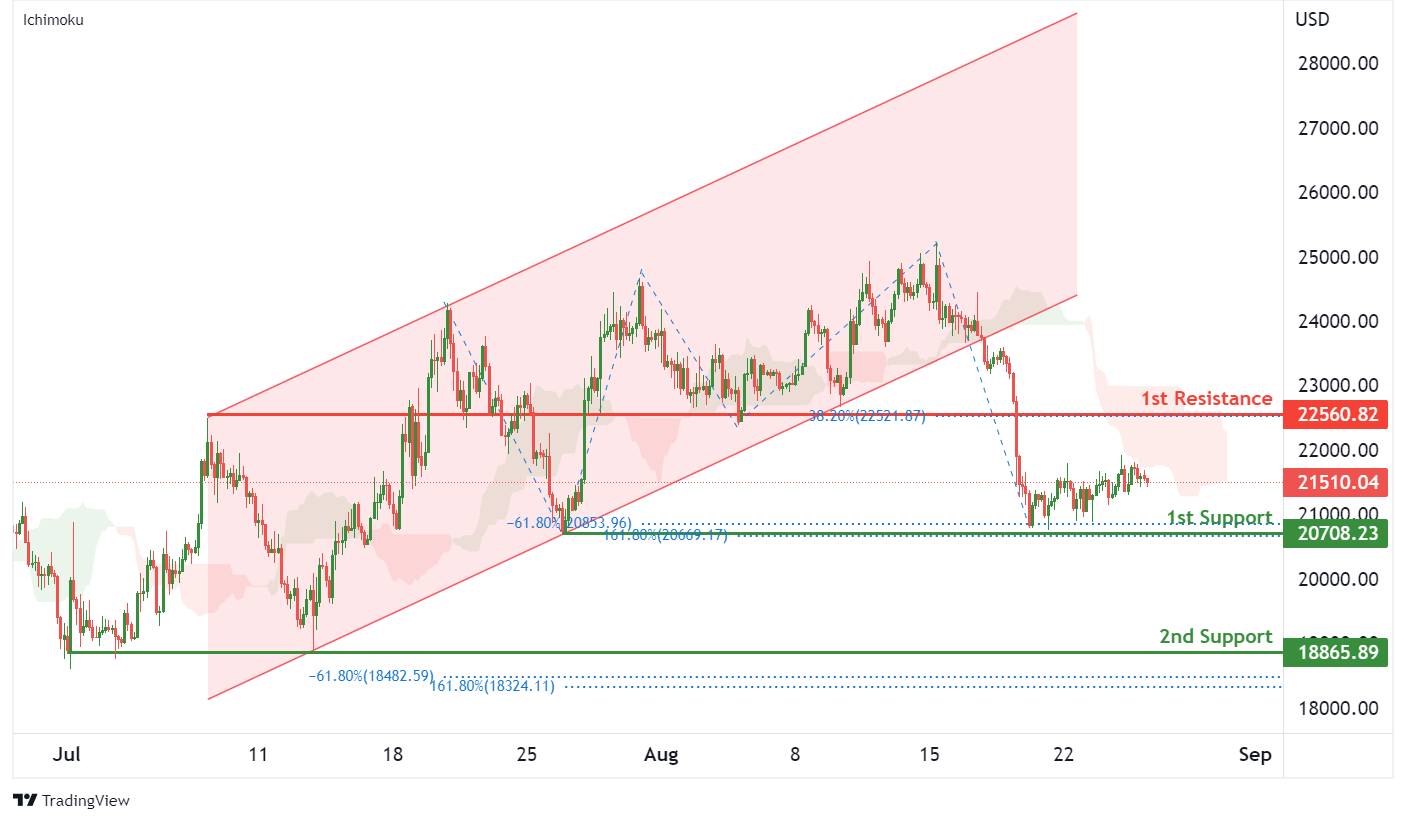
BTCUSD:
On the H4, with price breaking out of a bullish channel and moving below the ichimoku indicator, we have a bearish bias that price will drop to 1st support at 20708.23 where the -61.8% fibonacci expansion, 161.8% fibonacci extension and swing low support are. Once we have downside confirmation of price breaking 1st support structure,we would expect bearish momentum to carry price to 2nd support at 18865.89 where the swing low support, -61.8% fibonacci expansion and 161.8% fibonacci extension are. Alternatively, price could rise to 1st resistance at 22560.82 where the pullback resistance and 38.2% fibonacci retracement are.
Areas of consideration:
- H4 time frame, 1st resistance of 22560.82
- H4 time frame, 1st support at 20708.23
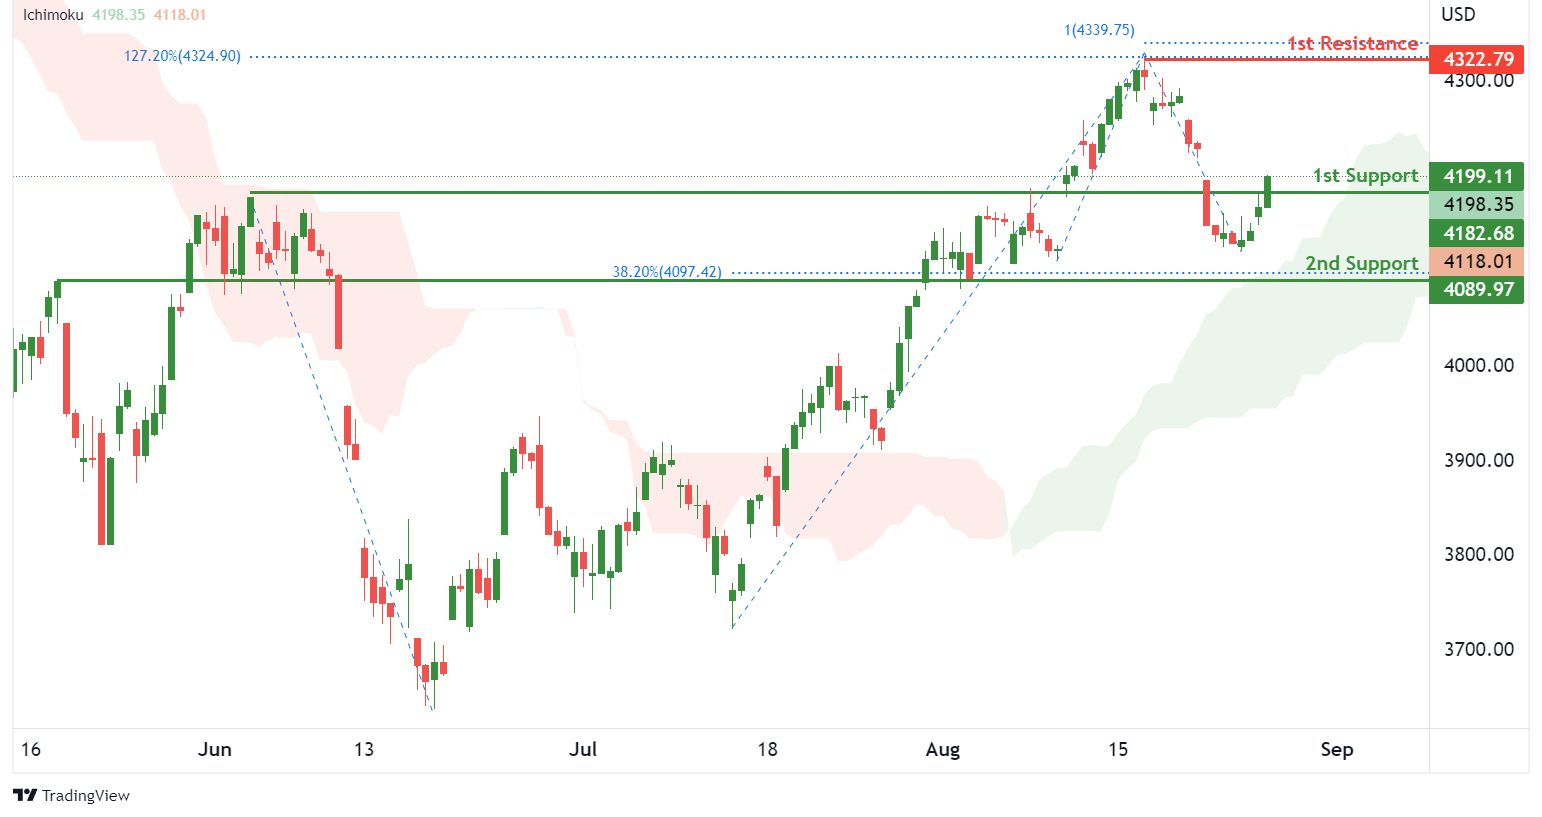
S&P 500:
On the H4, with prices moving above the ichimoku indicator, we have a bullish bias that the price will rise from 1st support at 4182.68 where the pullback support is to the 1st resistance at 4322.79 where the swing high resistance, 100% fibonacci projection and 127.2% fibonacci extension are. Alternatively, price could break 1st support structure and drop to 2nd support at 4089.97 where the pullback support and 38.2% fibonacci retracement are.
Areas of consideration:
- H4 time frame, 1st resistance of 4322.79
- H4 time frame, 1st support at 4182.68


