
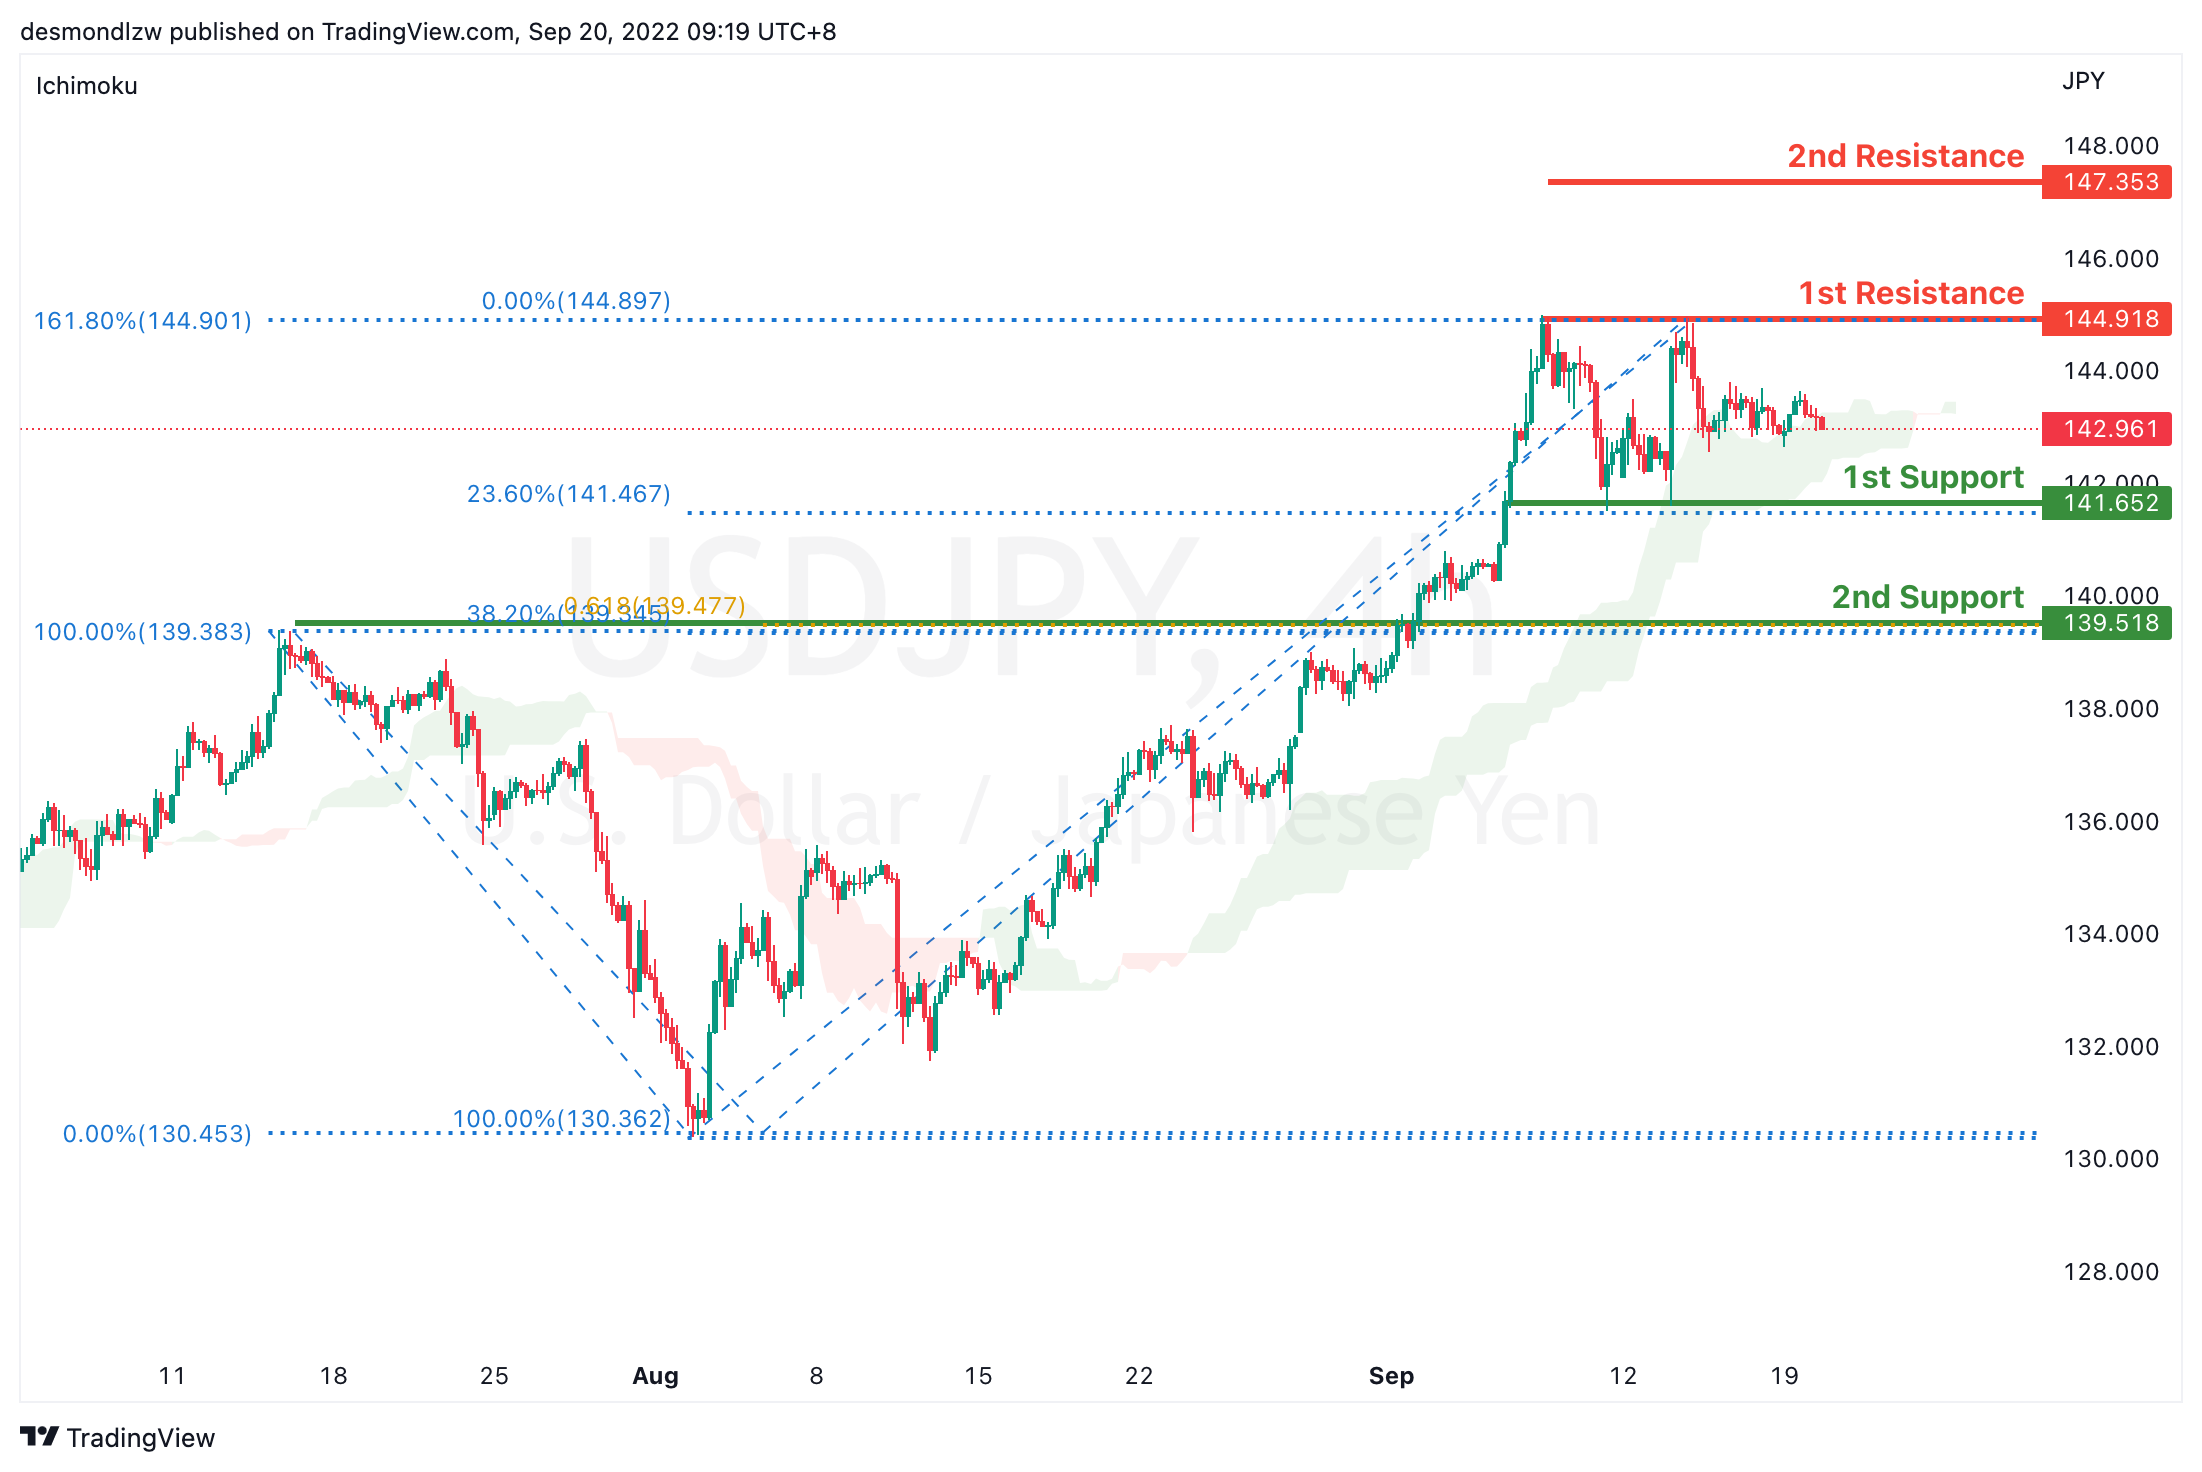
USD/JPY:
On the H4 chart, price is still respecting the ascending momentum. We are still bullish bias- Price is testing above the previous low and if bullish momentum continues, it should bring price to first resistance at 144.918 where the 161.8% extension sits. If it breaks this level, it should bring price to 147.353 where the previous swing high sits. Alternatively it could pull back to the first support at 141.652 where the 23.6% retracement and 100% projection sits then to the second support at 139.381 where the 38.2% retracement and overlapping support sits.
Areas of consideration:
- H4 time frame, 1st resistance at 144.918
- H4 time frame, 1st support at 141.652
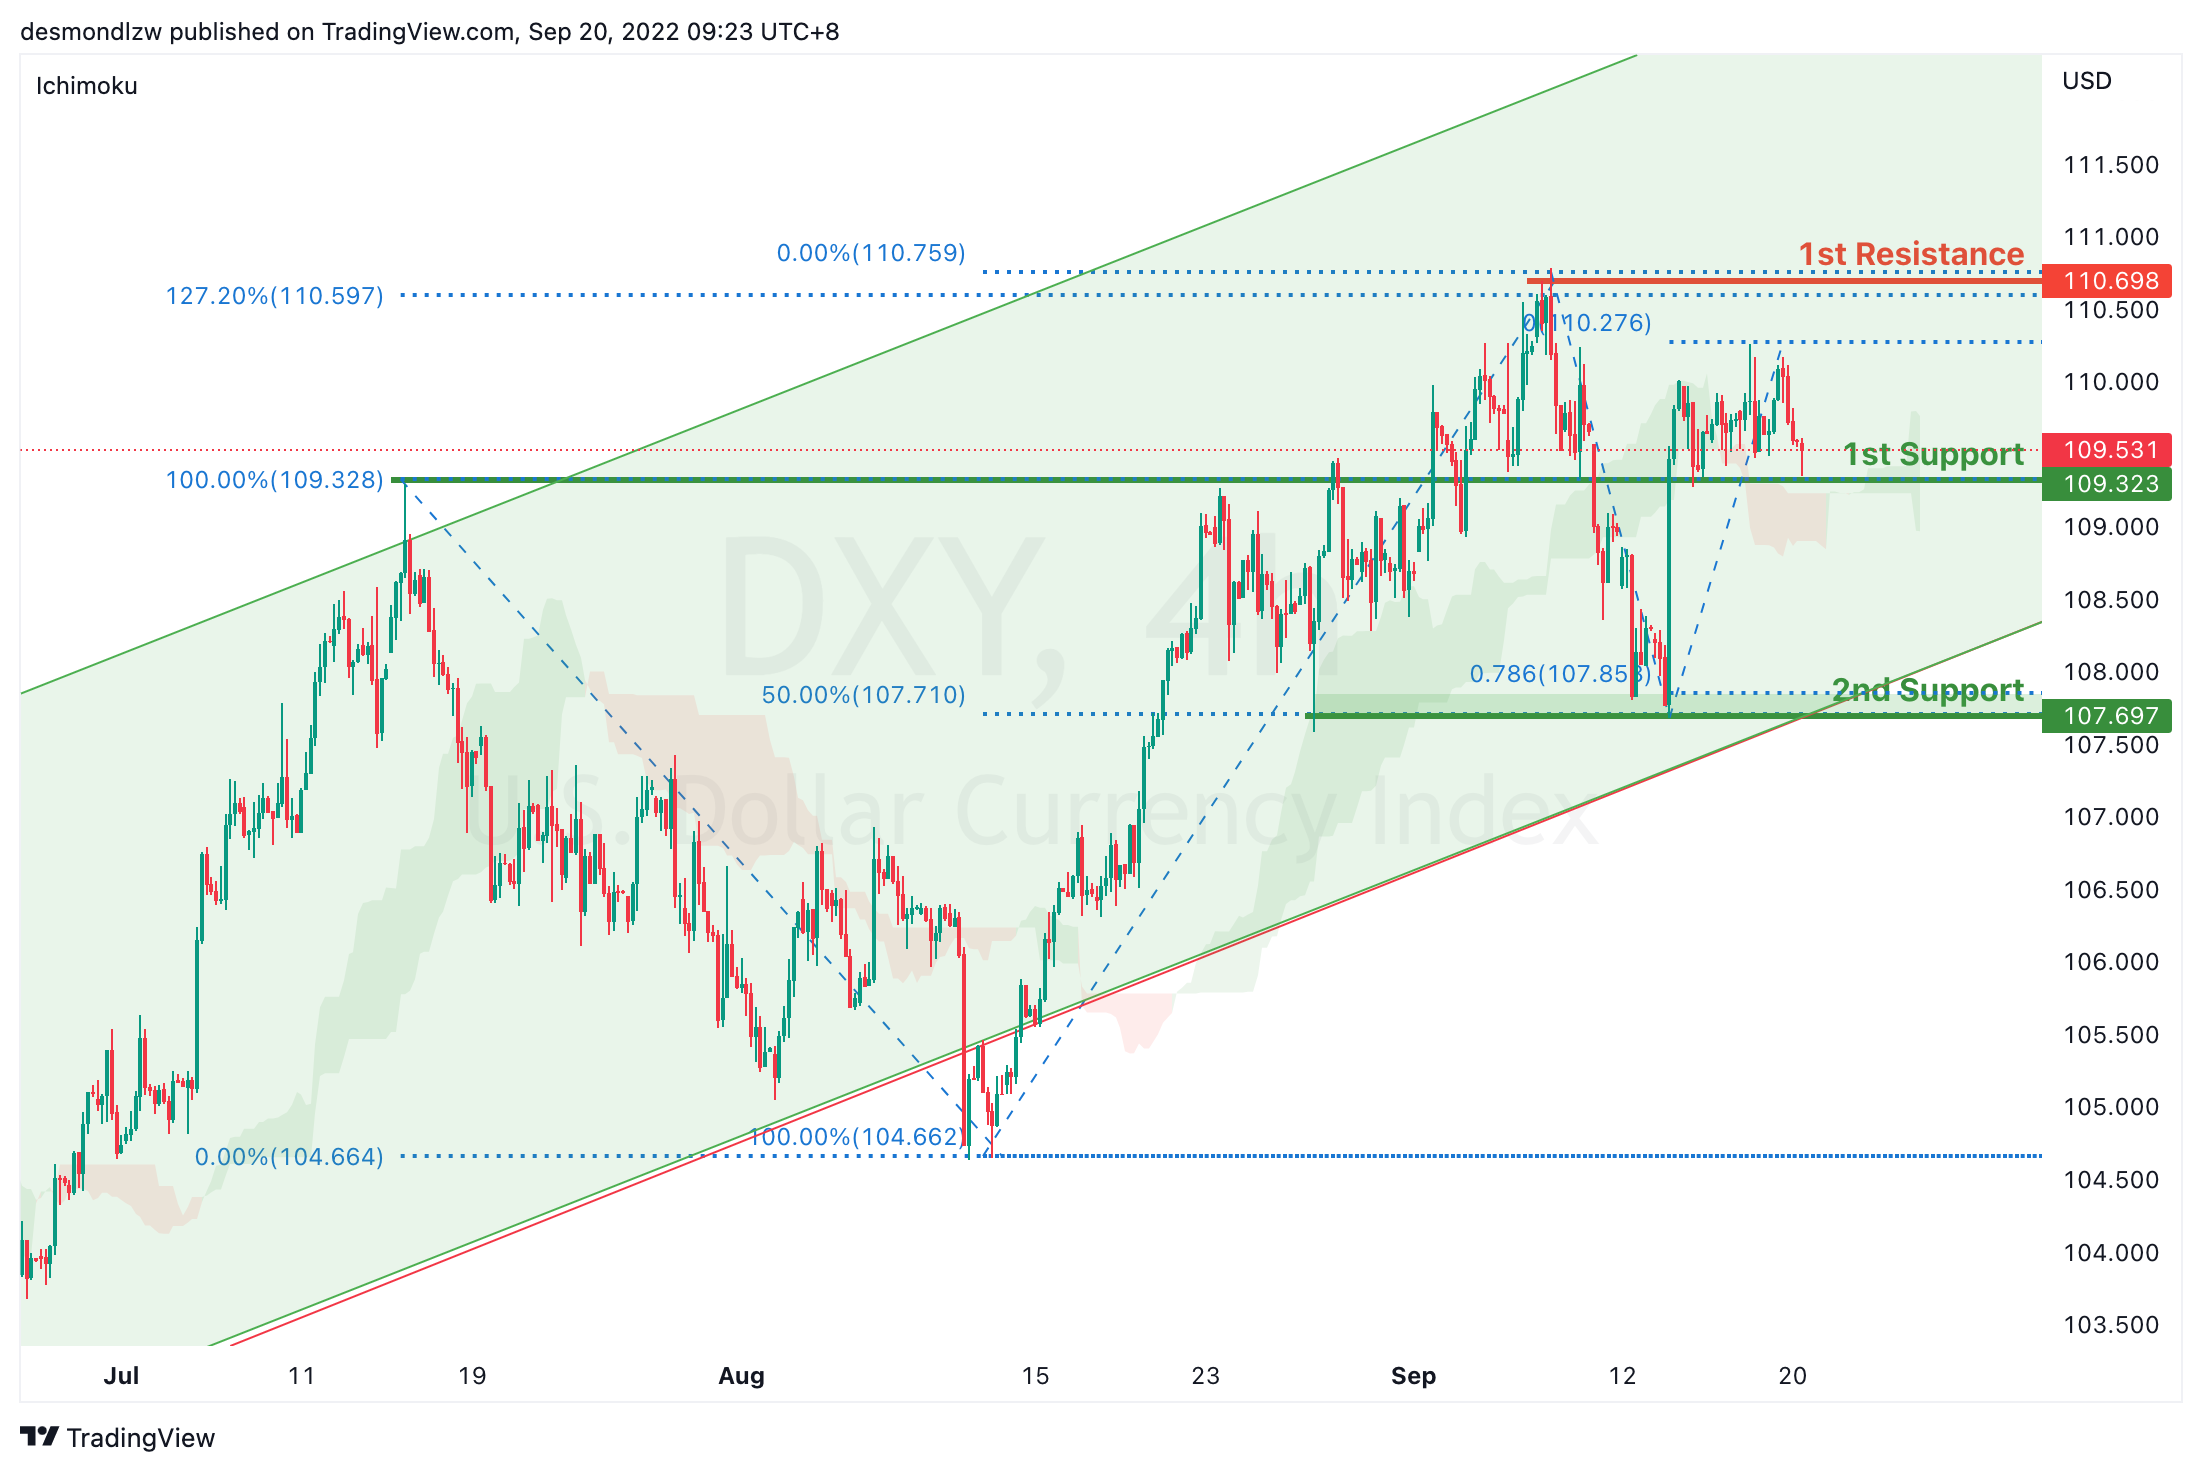
DXY:
On the H4, price is still respecting the bullish channel and has failed to break the first support- we are bullish bias. Price is currently testing the first support at 109.323 where the 23.6% retracement sits. If bullish momentum continues, it should bring price toward the first resistance at 110.698 levels where the previous swing high sits. Alternatively, it could break the first support to bring price to the second support at 107.697 where the 78.6% projection, 50% retracement and previous swing low sits
Areas of consideration:
- H4 time frame, 1st resistance at 110.698
- H4 time frame, 1st support at 109.323
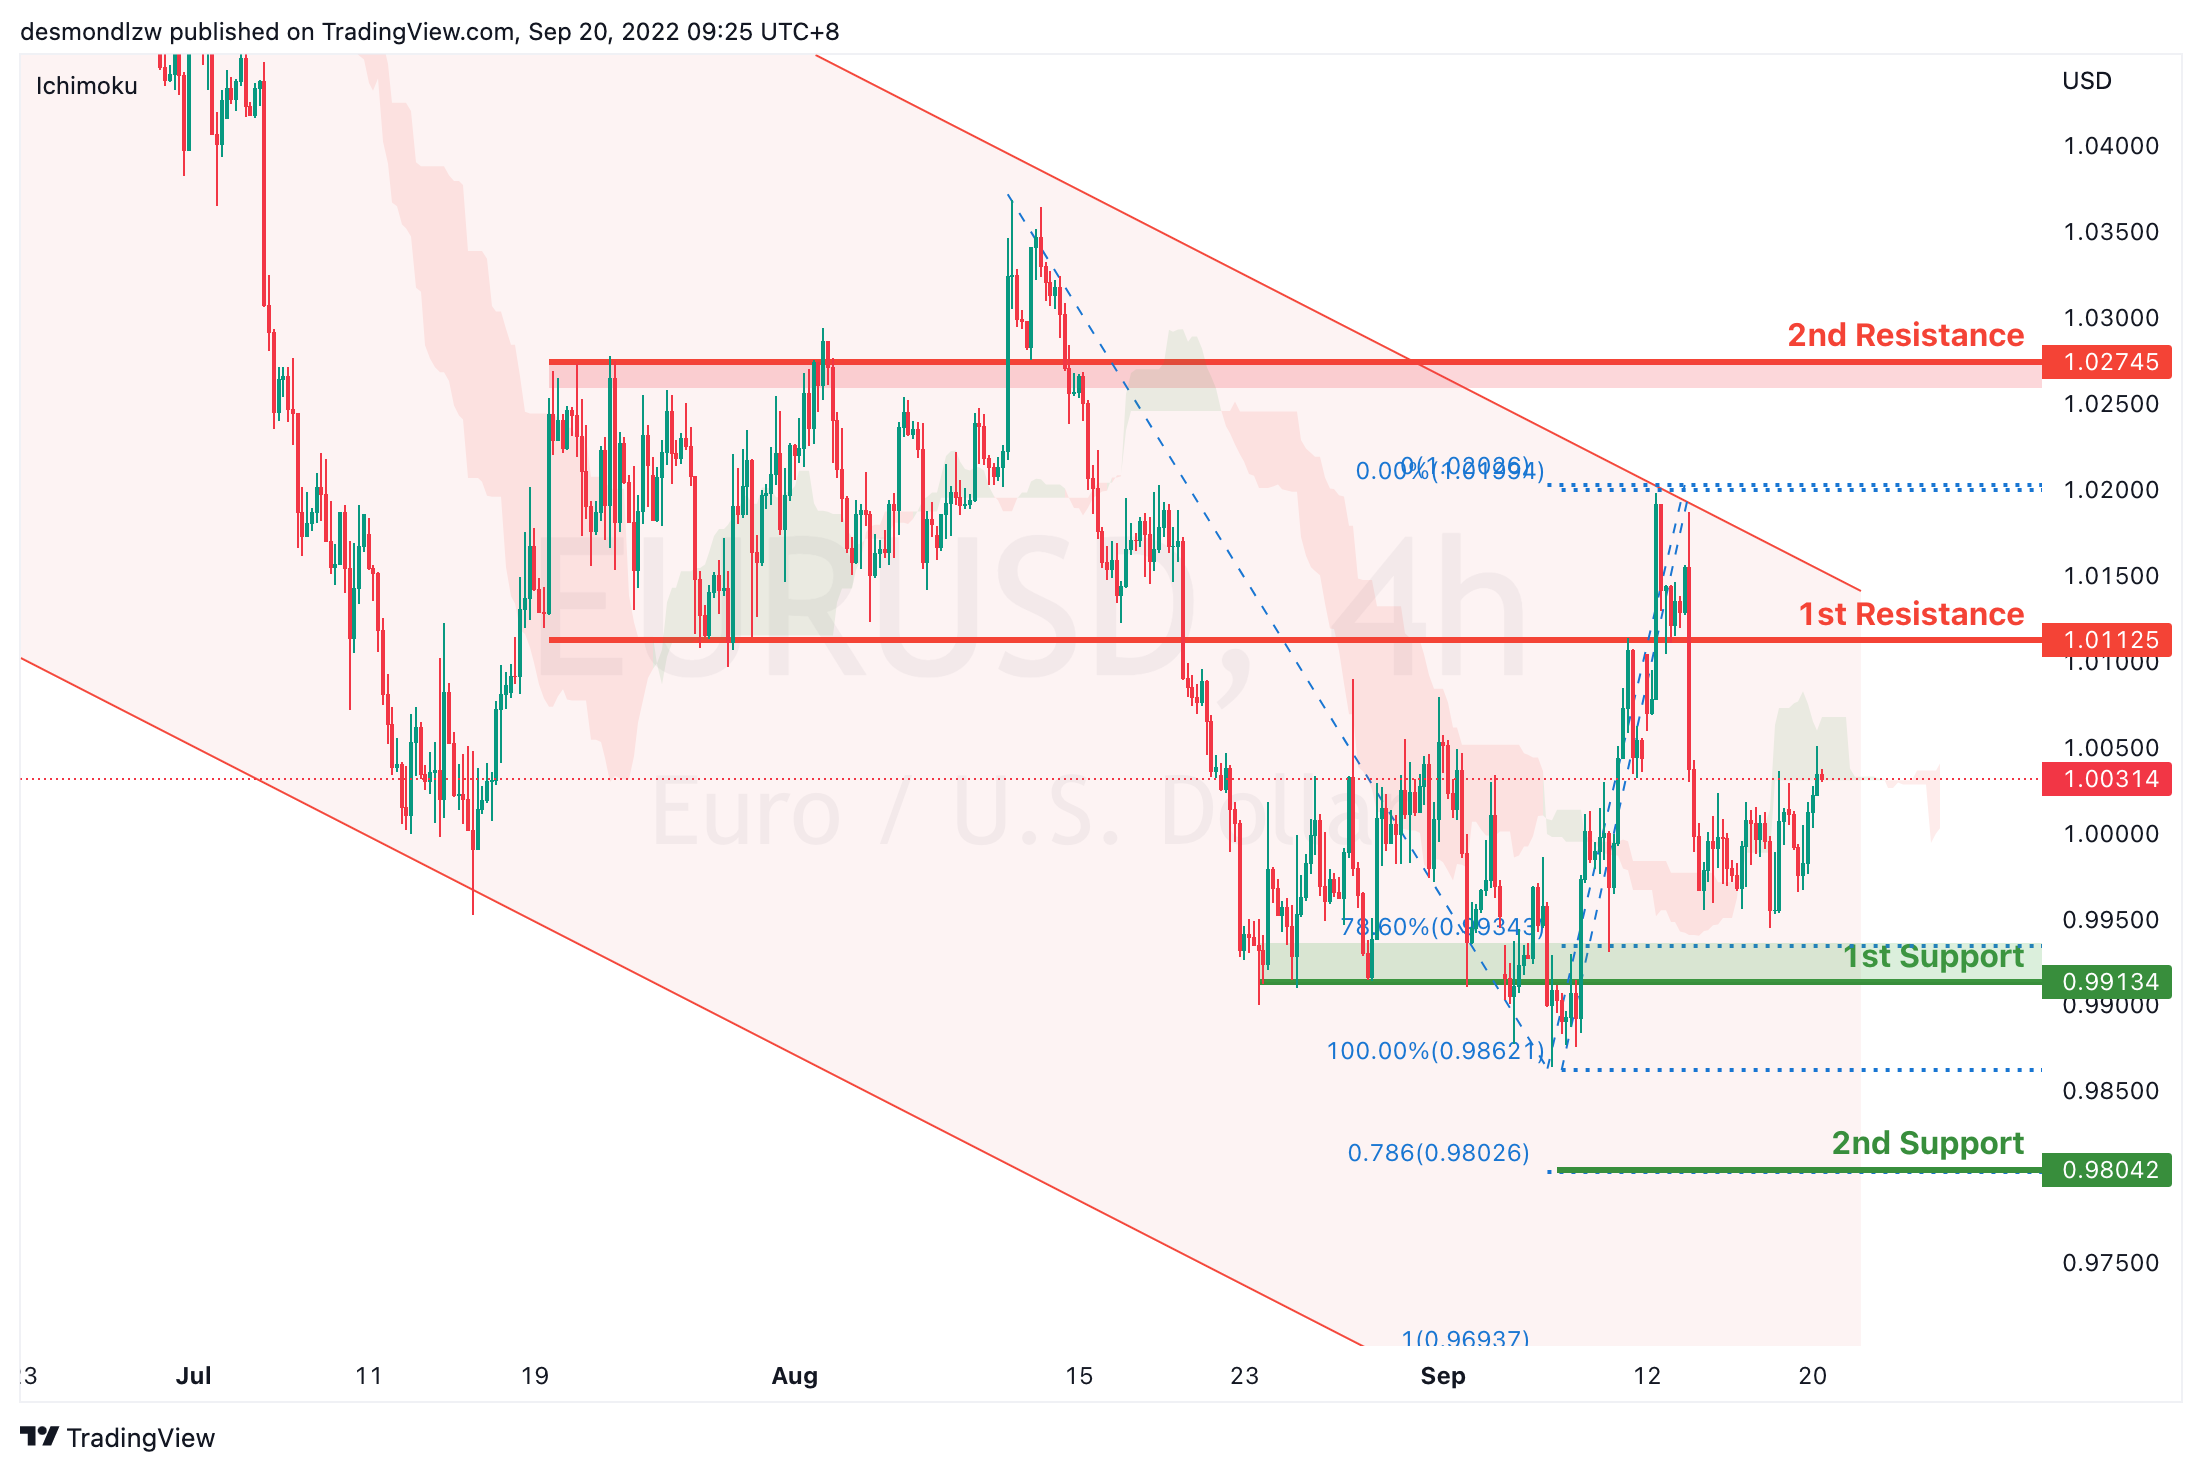
EUR/USD:
On the H4, price is moving within the channel, we are currently bullish bias as price fails to break the first support. Price seems like its moving to first resistance at 1.0112 level where the 50% retracement and previous swing low sits. If bullish momentum continues, it should bring price to second resistance at 1.0274 where the 78.6% retracement and previous swing high sits. Alternatively, price could pull back to test the first support at 0.9913 where the 78.6% projection and previous swing low sits, subsequently the second support at 0.9804 where the 100% projection sits
Areas of consideration :
- H4 1st resistance at 1.0112
- H4 1st support at 0.9913
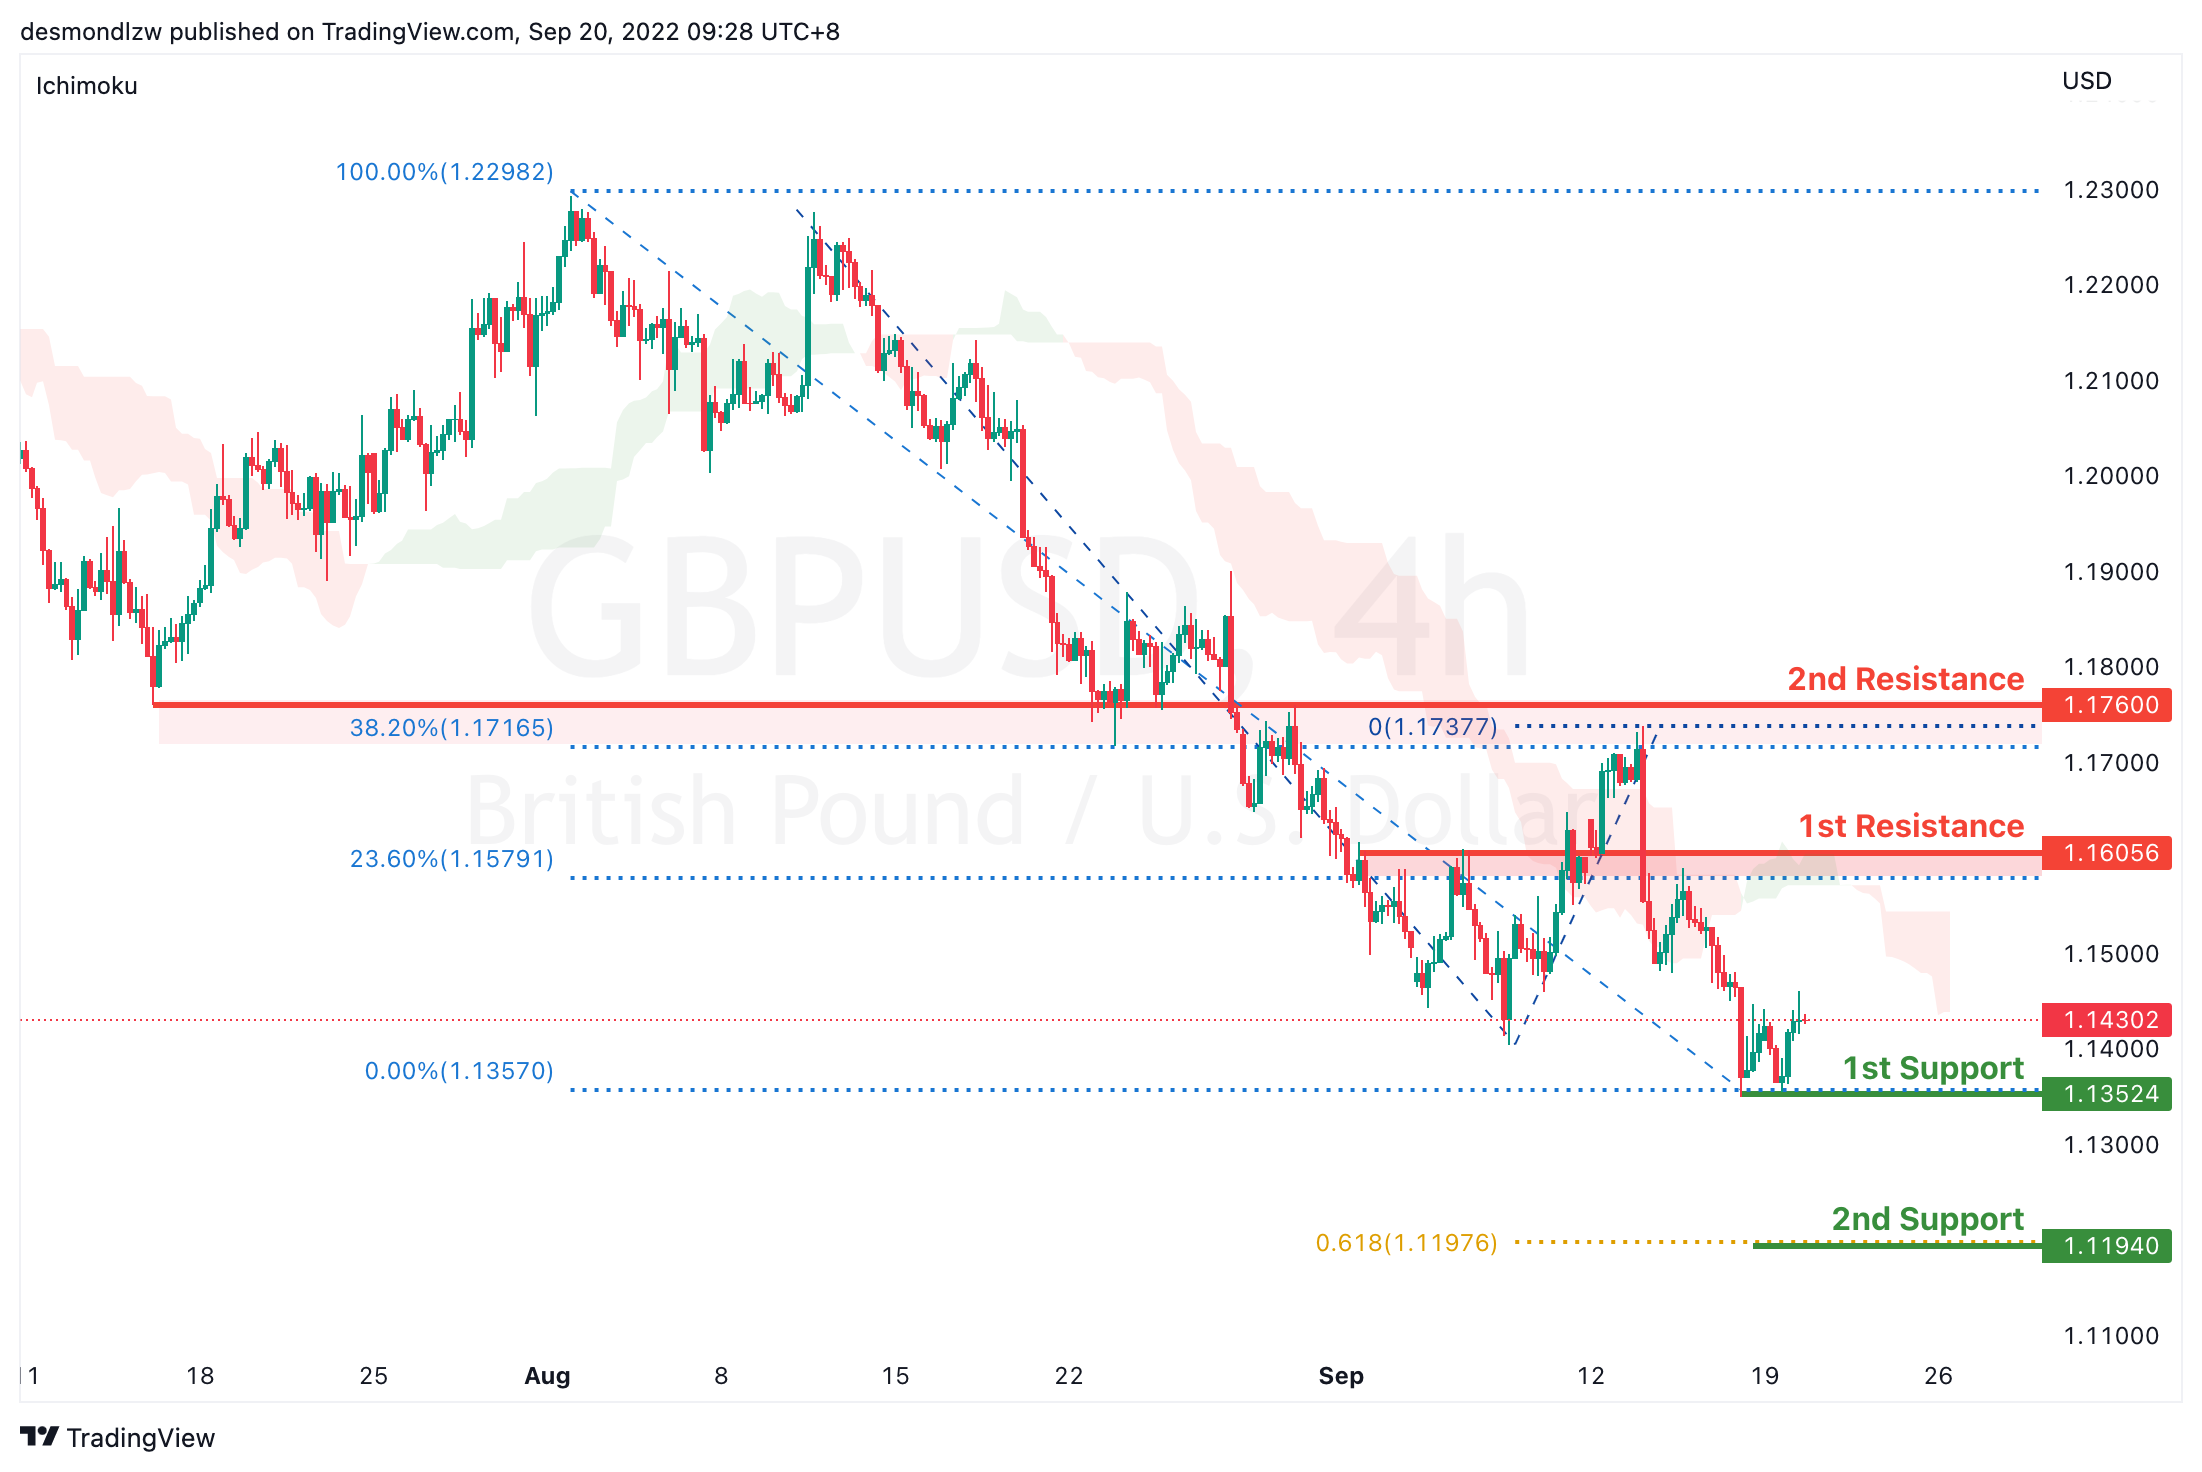
GBP/USD:
On the H4, prices are still moving in a bearish momentum hence we are bearish biassed. Prices have pulled back slightly but if bearish momentum continues, it should test the first support again at 1.1352 levels where the previous swing low sits then the second support at 1.1194 where the 161.8% extension and 61.8% projection sits. Alternatively, price could pull back to test the first resistance at 1.1605 where the 23.6% retracement and overlapping support sits then the second resistance at 1.1760 where the 38.2% retracement and previous swing high sits
Areas of consideration:
- H4 1st resistance at 1.1605
- H4 1st support at 1.1350
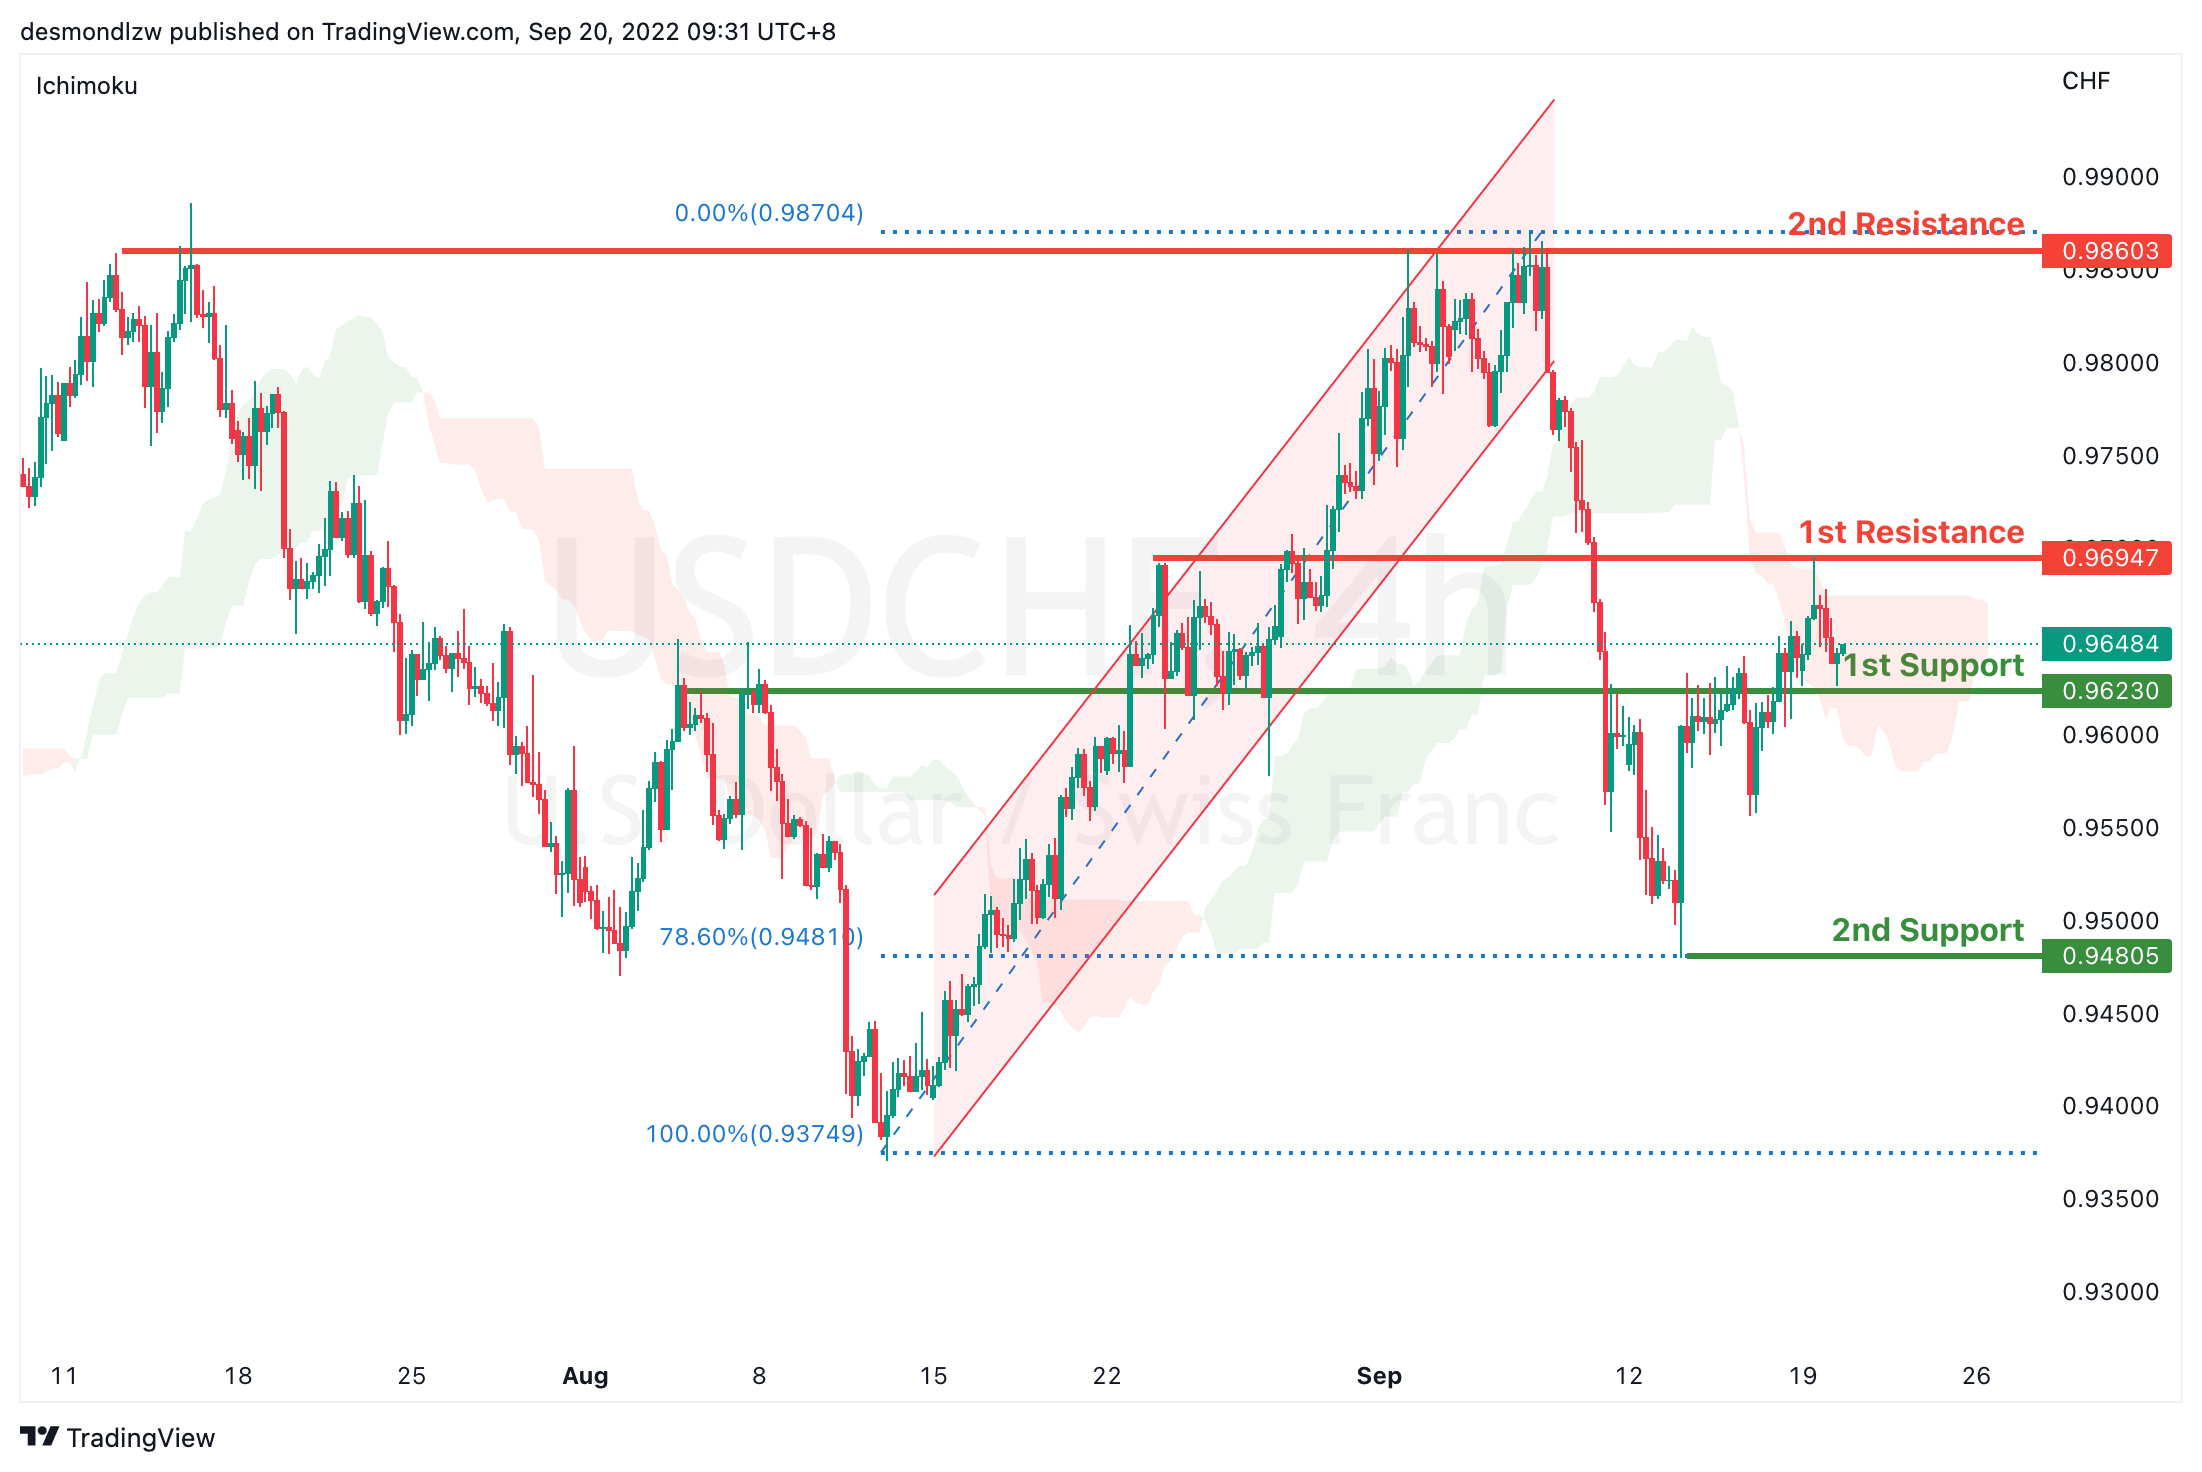
USD/CHF:
On the H4, prices have broken the ascending channel and we are currently bearish bias. Price is currently testing around the first support at 0.9623 where the overlapping resistance sits but prices are ranging. If price continues with the bearish momentum, it should bring price back to test the 0.9623 levels again before testing the second support at 0.9480 where the 78.6% projection and 78.6% retracement sits. Alternatively, price could pull back to test the first resistance at 0.9694 then the second support at 0.9860 where the swing high sits
Areas of consideration
- H4 1st support at 0.9623
- H4 1st resistance at 0.9694
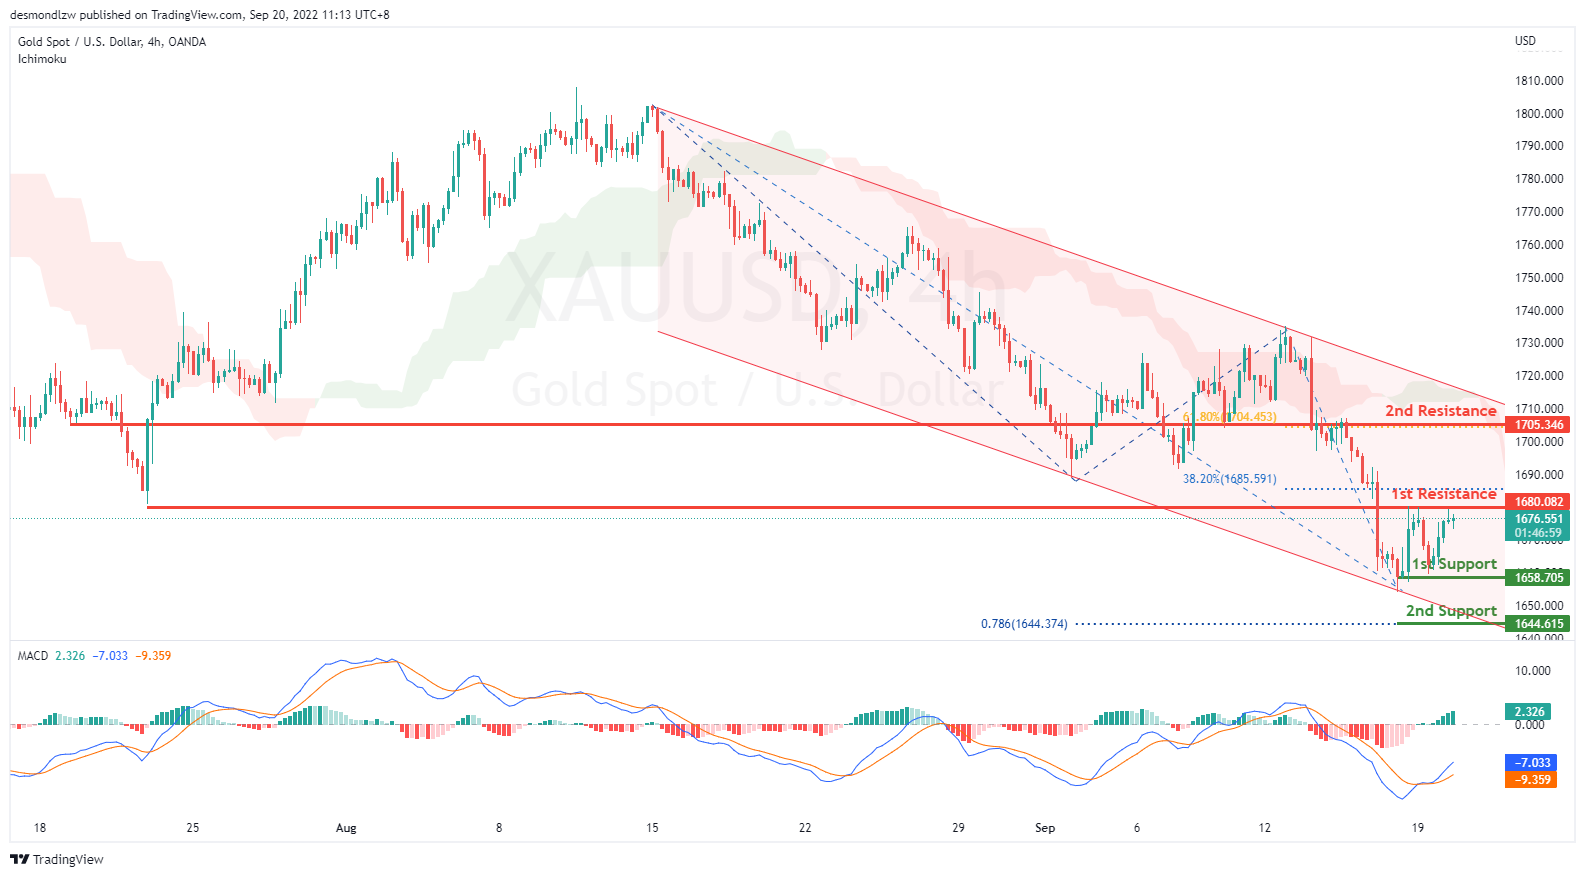
XAU/USD (GOLD):
On the H4, with the price testing the 1st resistance and MACD showing a golden cross, we have a weak bullish bias that the price may break the 1st resistance at 1680.082, which is in line with the overlap resistance. If the 1st resistance is broken, the price may try to test the 2nd resistance at 1705.346, which is in line with the 61.8% fibonacci retracement. Alternatively, the price may drop to the 1st support at 1658.705, where the swing low is. If the 1st support is broken, we can expect the price drop to the 2nd support at 1644.615, which is in line with the 78.6% fibonacci projection.
Areas of consideration:
- H4 time frame, 1st resistance at 1680.082
- H4 time frame, 1st support at 1658.705
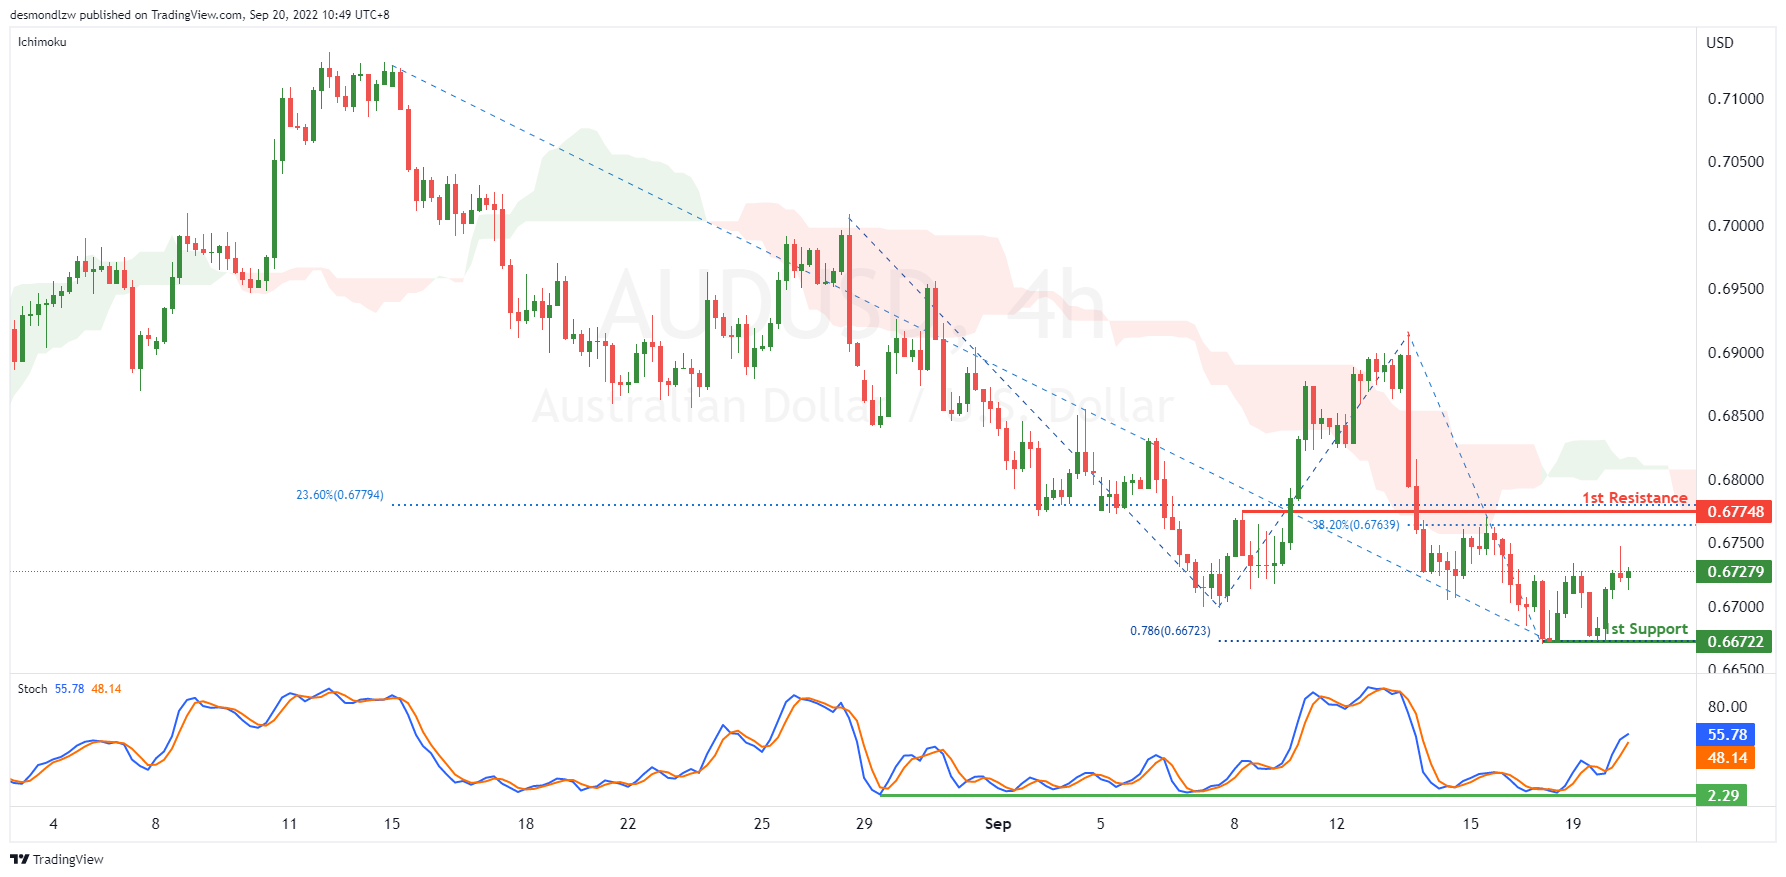
AUD/USD:
On the H4, with the Stoch is rising from the support level, we have a weak bullish bias that the price may rise to the 1st resistance at 0.67748, which is in line with the 23.6% fibonacci retracement and 38.2% fibonacci retracement. Alternatively, as the price is below ichimoku cloud, the price may retest the 1st support at 0.66722, which is in line with the 78.6% fibonacci retracement and swing low.
Areas of consideration
- H4, 1st resistance at 0.67748
- H4, 1st support at 0.66722
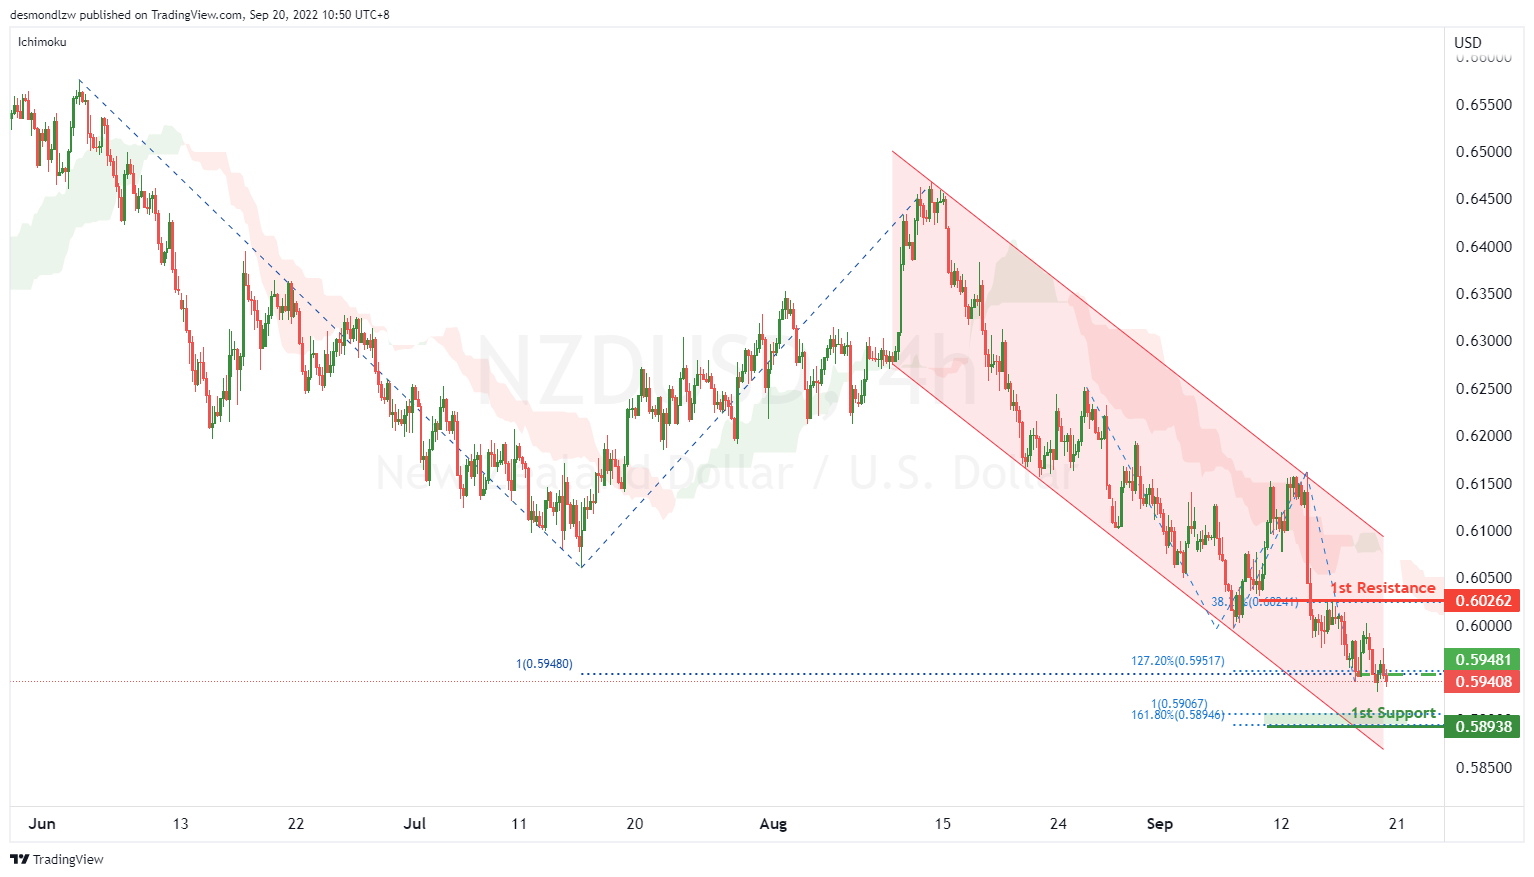
NZD/USD:
On the H4, with the price moving within the descending channel, below ichimoku cloud, and breaking the previous key support level at 0.59481, which is in line with the 100% fibonacci projection and 127.2% fibonacci extension, we have a bearish bias that the price may drop to the 1st support at 0.58938, which is in line with the 100% fibonacci projection and 161.8% fibonacci retracement. Alternatively, the price may pull back to the 1st resistance at 0.60262, where the 38.2% fibonacci retracement is.
Areas of consideration:
- H4 time frame, current price
- H4 time frame, 1st support at 0.58938
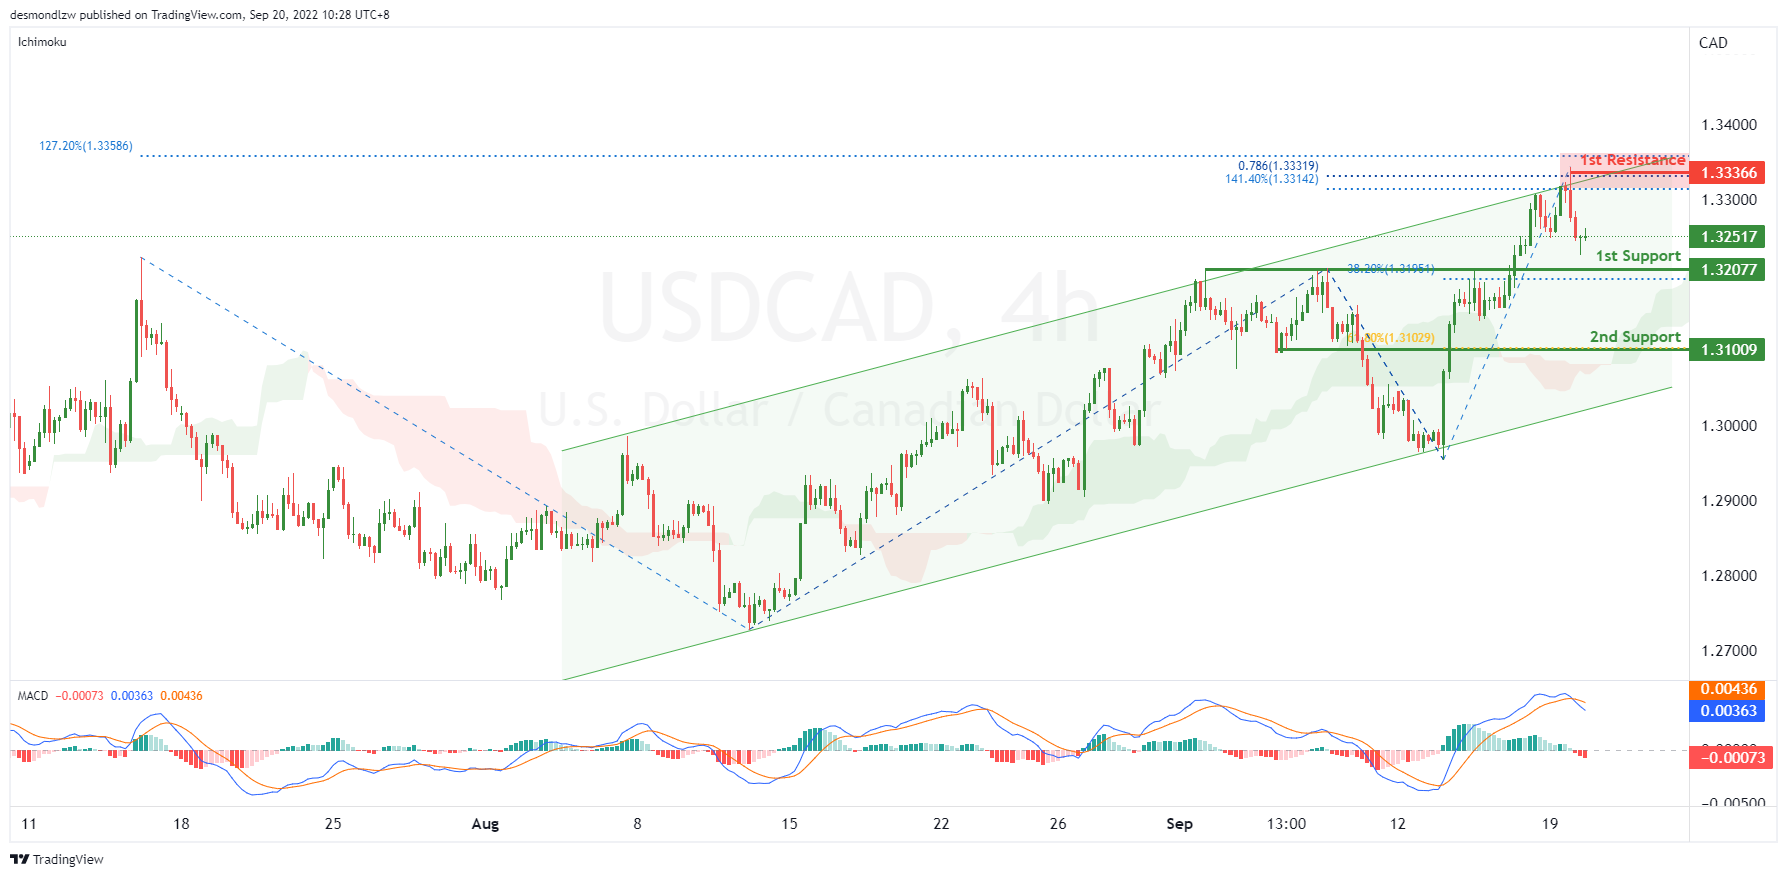
USD/CAD:
On the H4, with the price moving testing the upper bond of the ascending channel and MACD is showing a death cross, we have a bearish bias that the price may drop to the 1st support at 1.32077, which is in line with the previous swing highs and 38.2% fibonacci retracement. If the 1st support is broken, the 2nd support could be at 1.31009, where the 61.8% fibonacci retracement is. Alternatively, as the price is moving within the ascending channel and above ichimoku cloud, the price may rise to the 1st resistance at 1.33366, which is in line with the 127.2% fibonacci extension, 78.6% fibonacci retracement and 141.4% fibonacci extension.
Areas of consideration:
- H4 time frame, 1st support at 1.32077
- H4 time frame, 1st resistance at 1.33366
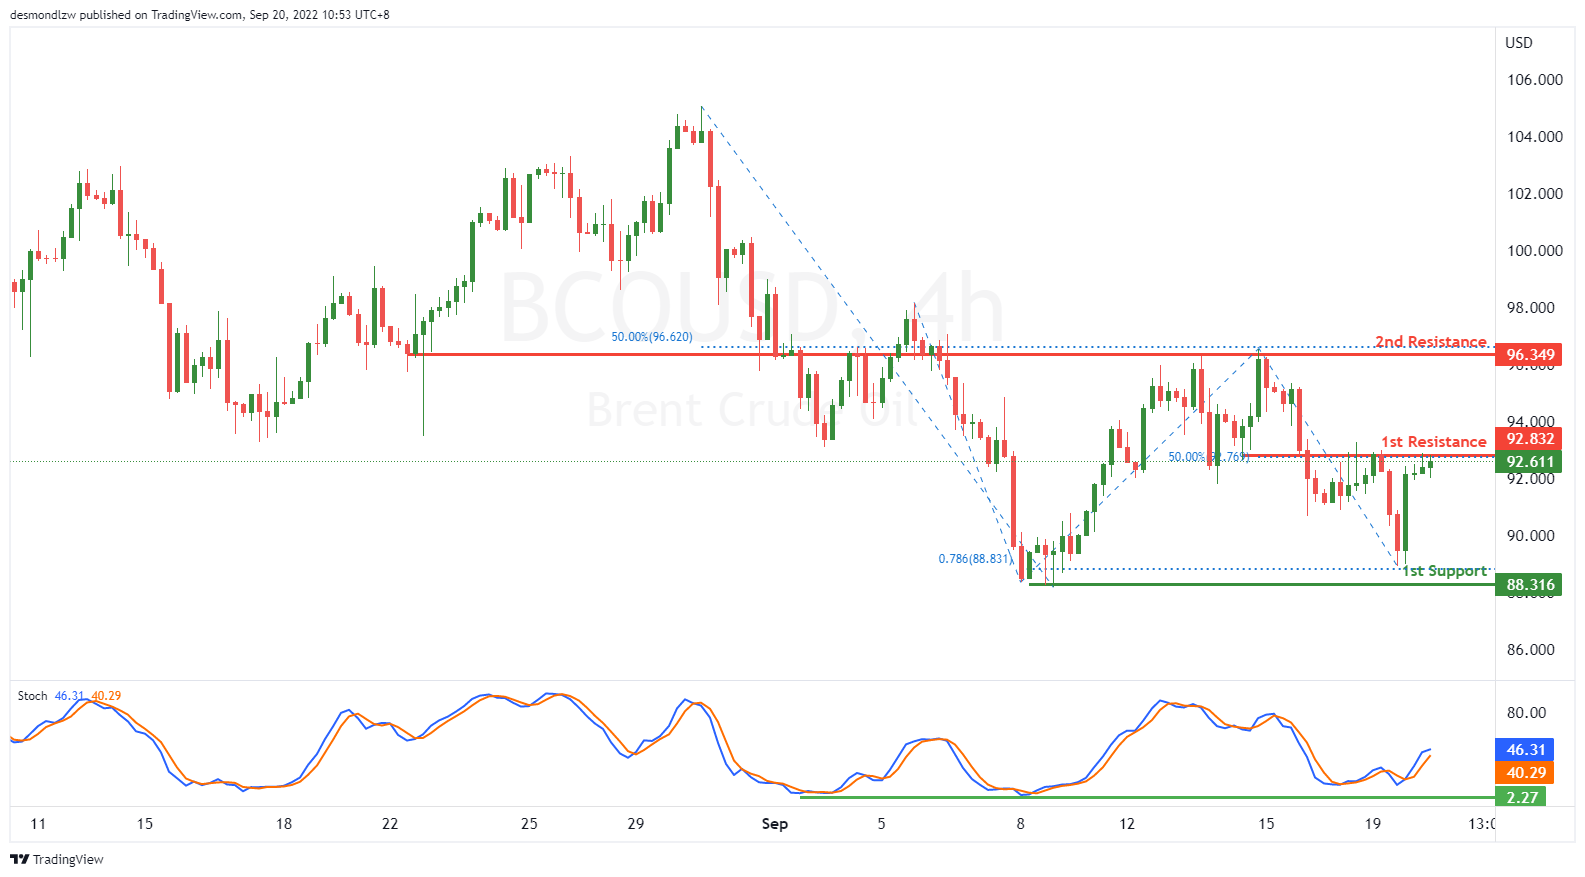
OIL:
On the H4, with the stoch is reversing from the support line and here is a golden cross, we have a bullish bias that the price may test the 1st resistance at 932.832, which is in line with the 50% fibonacci retracement. If the 1st resistance is broken, the next key resistance could be at 96.349, which is in line with the overlap resistance and 50% fibonacci retracement. Alternatively, the price may pull back and drop to the 1st support at 88.316, where the 78.6% fibonacci retracement and swing low are.
Areas of consideration:
- H4 time frame, 1st resistance at 932.832
- H4 time frame, 1st support at 88.316
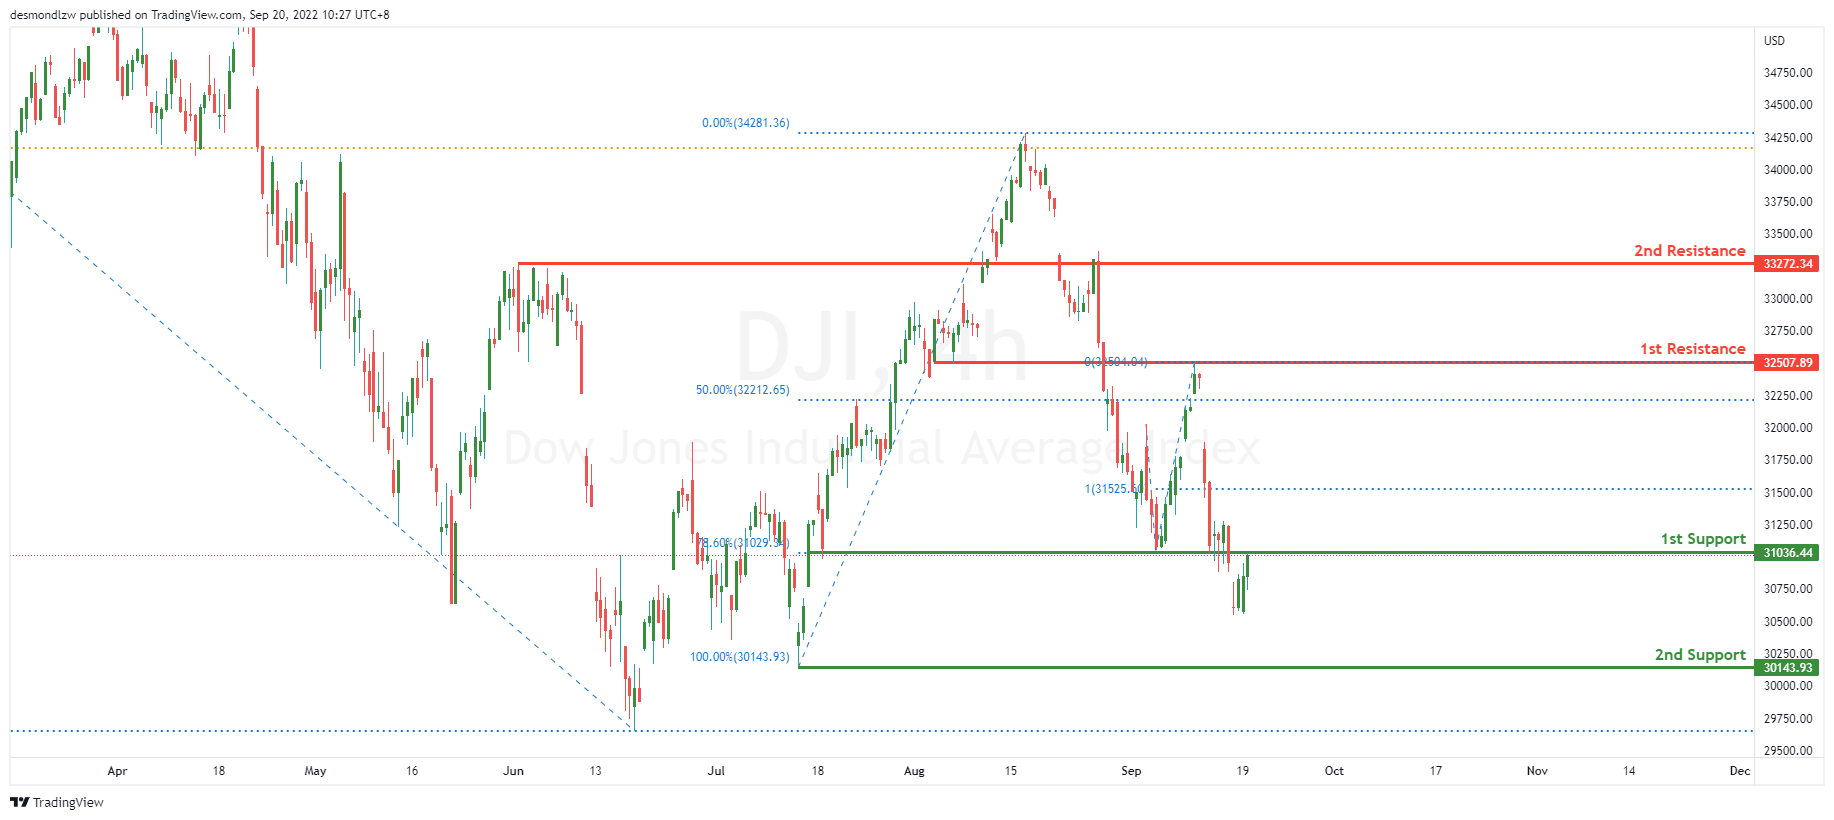
Dow Jones Industrial Average:
On the H4, price is reflected off nicely at the first resistance at 32500.85 where the 50% Fibonacci retracement is and broke right through the first support at 31029.34 where the 78.6% Fibonacci retracement is. Price might continue heading downwards towards the second support at 30343.73 where the previous swing low is.
Areas of consideration:
- H4 time frame, 1st support at 31029.34
- H4 time frame, 2nd support at 30343.73
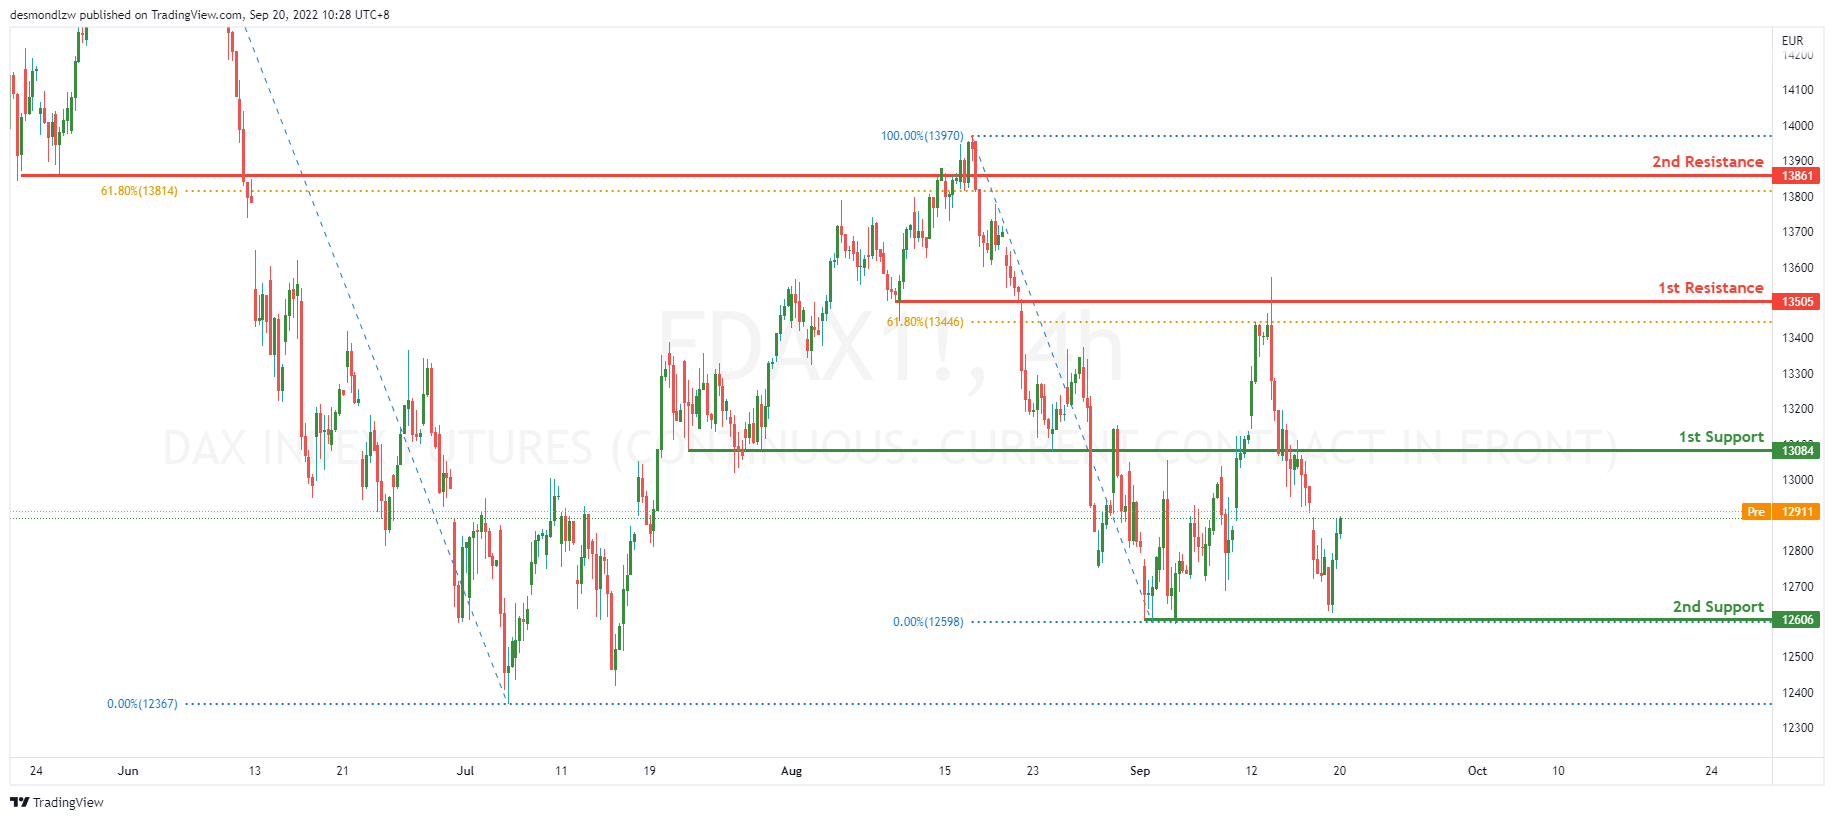
DAX:
On the H4, price has reflected of the first resistance at 13505 where the 61.8% retracement is and got a big reaction breaking through the first support at 13084. Price might continue going down towards the second support at 12606 where the swing low is.
Areas of consideration:
- H4 time frame, 1st support at 13084
- H4 time frame, 2nd support at 12606
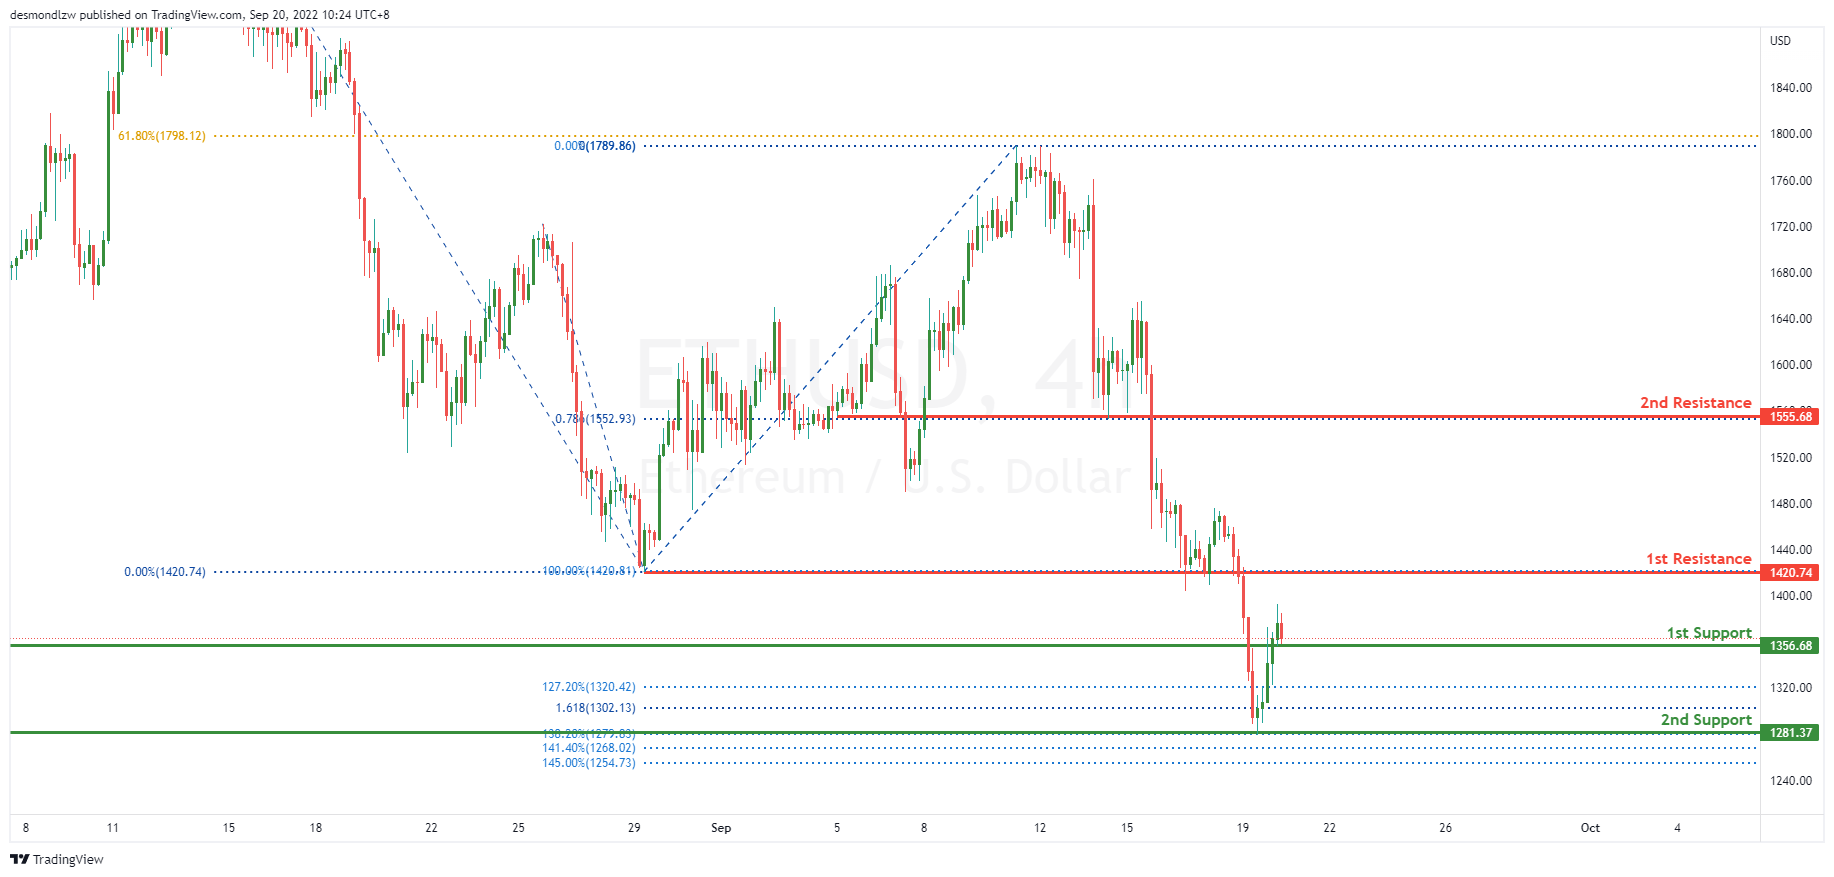
ETHUSD:
On the H4, price has pushed through the 1st Resistance at 1420.81 where the previous swing low sat. Price has also pushed through the 1st support at 1356.35 where the 127.2% Fibonacci extension lies and reflected off the second support at 1281.37 where the 138.2% Fibonacci Extension lies. Expecting a pull back on price back up to the first resistance.
Areas of consideration:
- H4 time frame, 1st resistance of 1420.81
- H4 time frame, 1st support at 1356.35
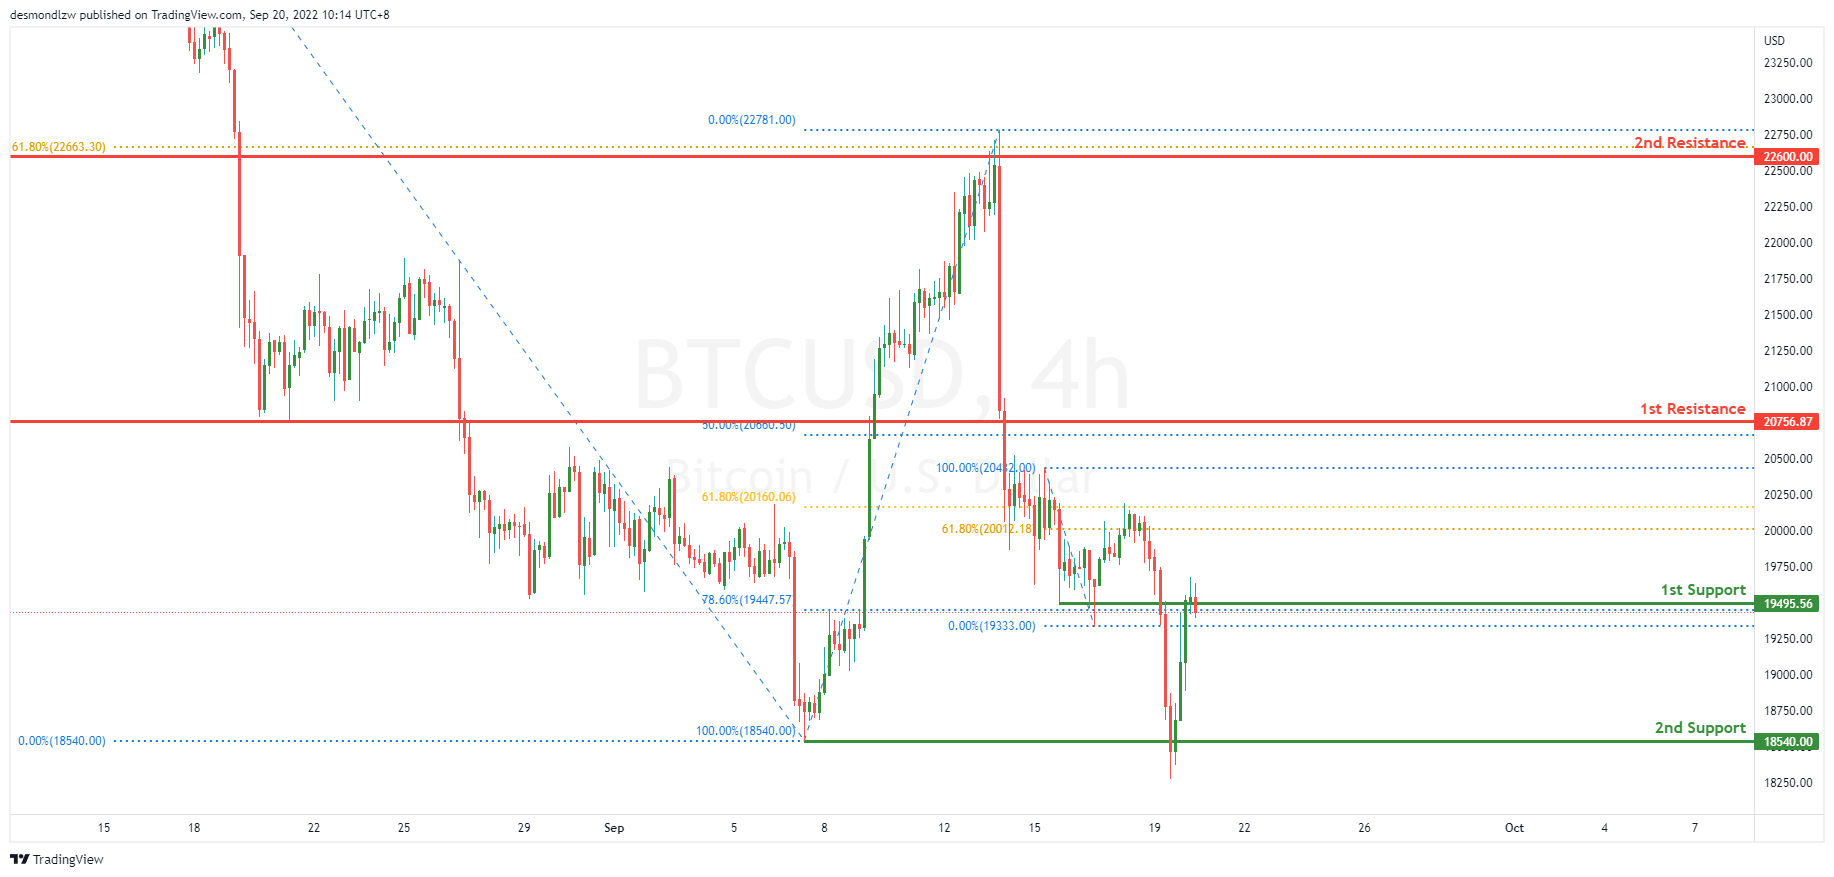
BTCUSD:
On the H4, price has broke through the second support 18540.00 where the previous swing low sits and reflected back up above the first support at 19557.00 where the 78.6% Fibonacci retracement sits. Price could possibly head back up to the first resistance at 22600.00 or price could reflect off the first support and go back to the second support area.
Areas of consideration:
- H4 time frame, 1st resistance of 22600.00
- H4 time frame, 1st support at 19557.00
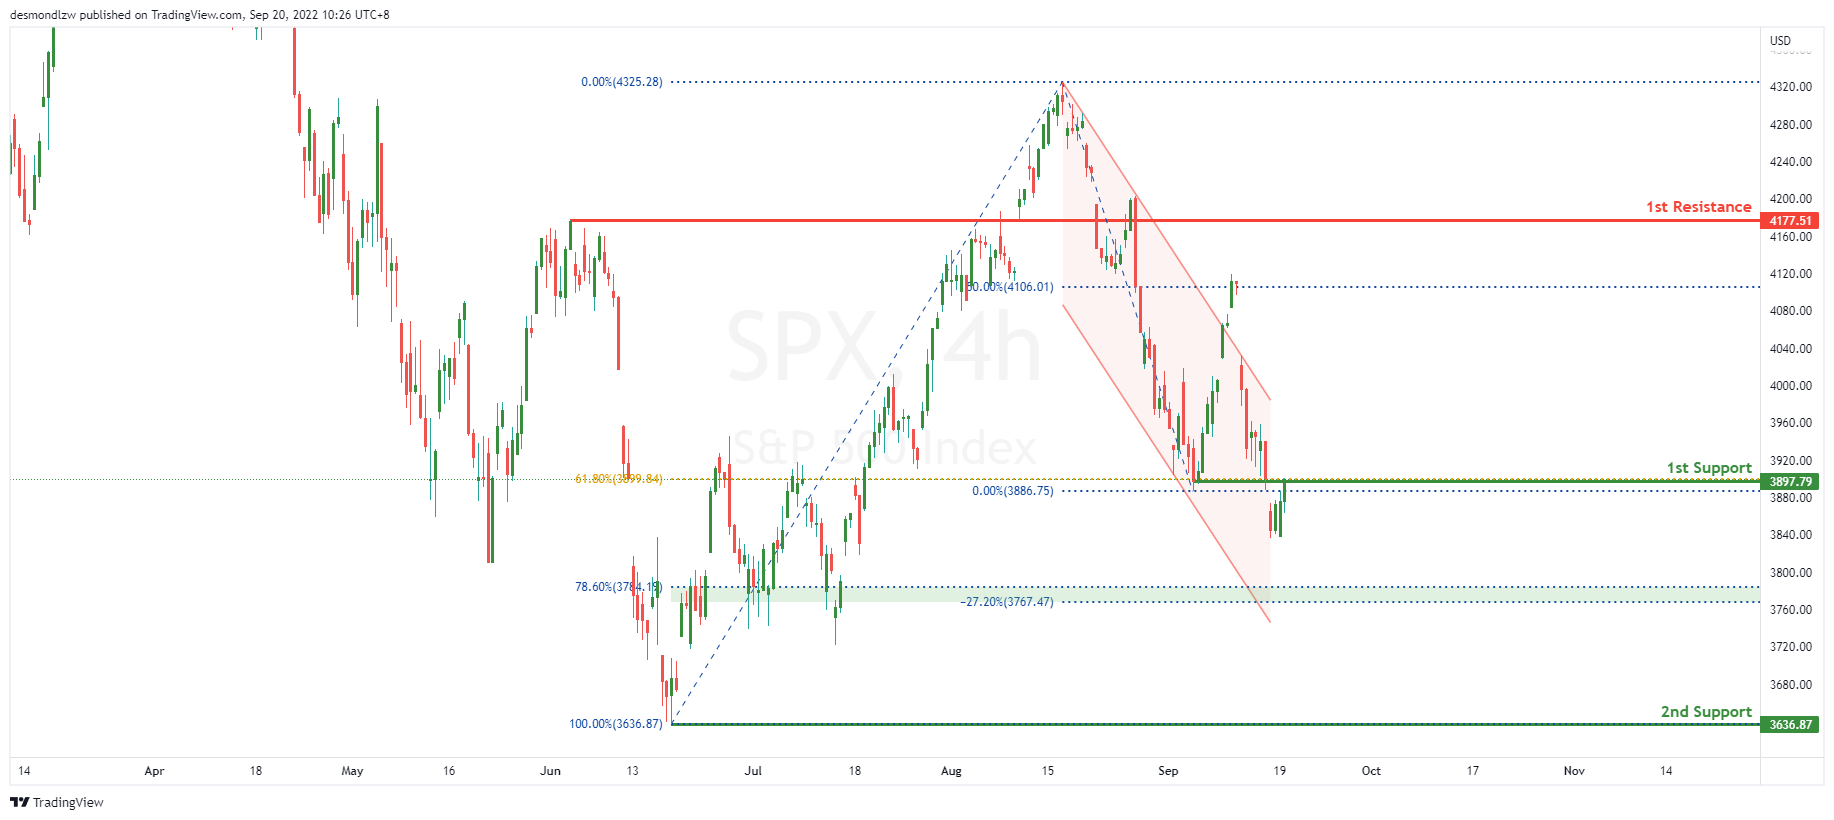
S&P 500:
On the H4, the price reversed from the 4100 price area forming a bearish channel, with the price falling towards the 1st support are of 3900. With our bearish bias still valid, as price trades back towards the 61.8% Fibonacci retracement, look for price to test the 1st support area. Price has broken below the 1st support level, the price could fall towards the 78.6% Fibonacci retracement level of 3784.19. There could be some pullback up towards the 1st Support level area else it could head towards the 2nd support of 3636.87. As the price falls towards the 2nd support, it could find some pullback towards the 78.6% Fibonacci retracement pullback support area.
Areas of consideration:
- H4 time frame, 1st support at 3900
- H4 time frame, 2nd support at 3636.87


