
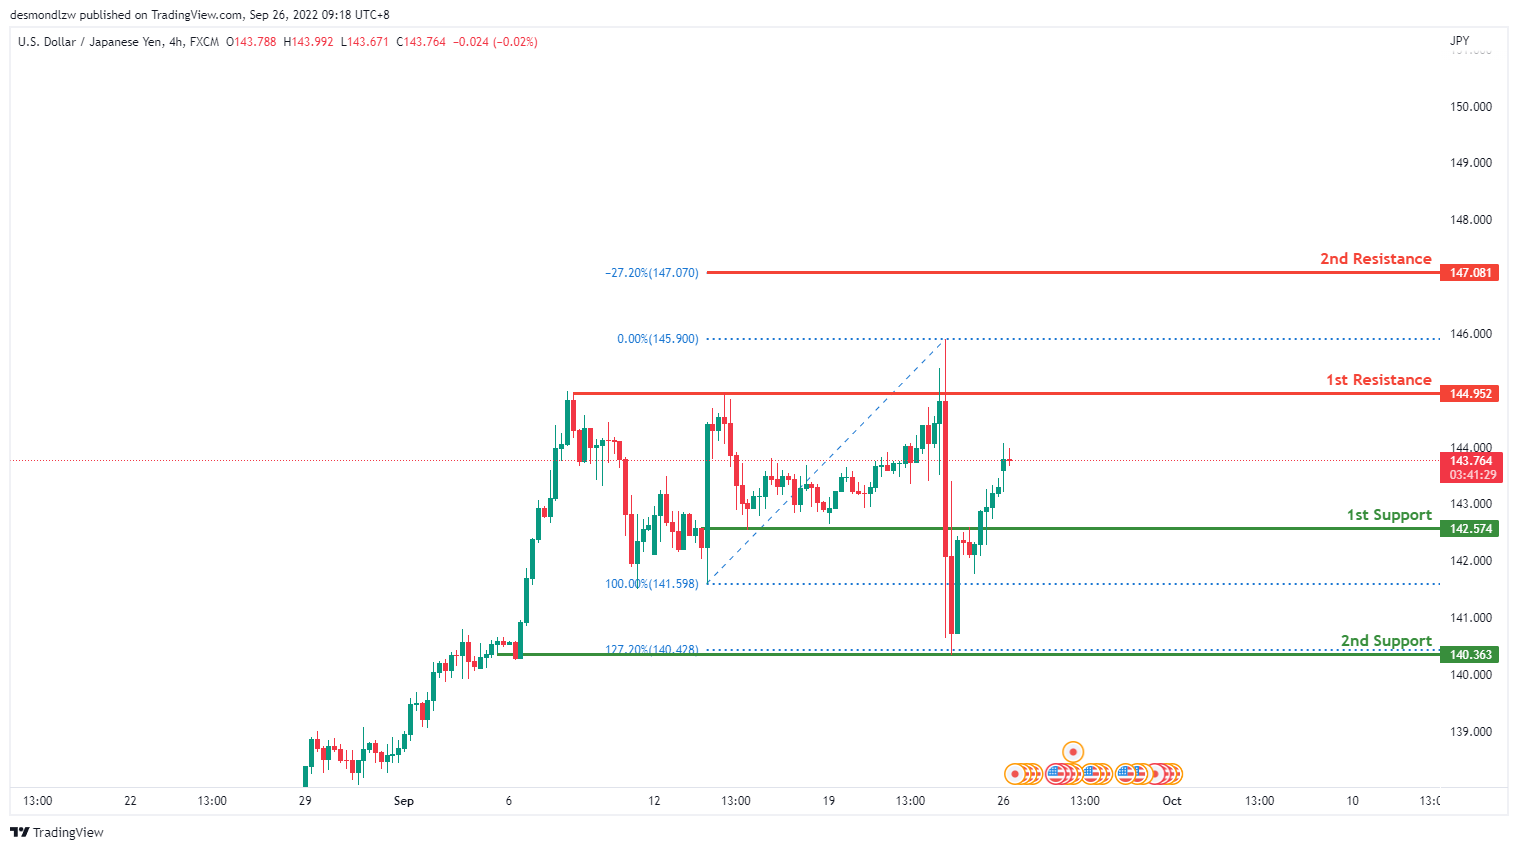
USD/JPY:
On the H4 chart, price has reflected off the 2nd support at 140.363 and through 1st support at 142.574 where the 78.6% Fibonacci line is. Price could possibly continue this short term bullish move up towards the 1st resistance line where the 23.6% Fibonacci line lies.
Areas of consideration:
- H4 time frame, 1st resistance at 144.952
- H4 time frame, 1st support at 142.574
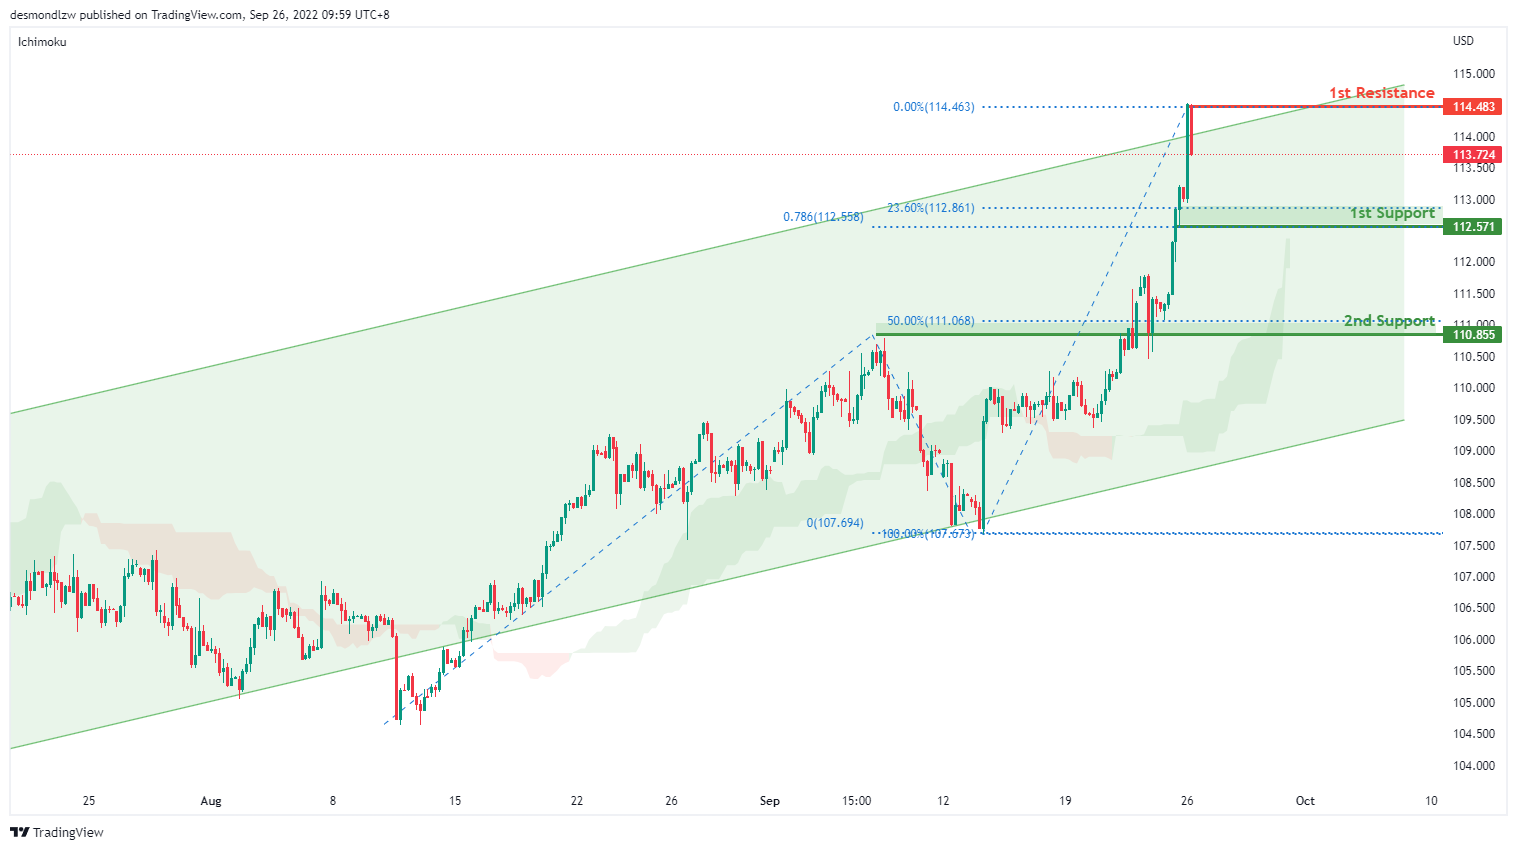
DXY:
On the H4, price is still respecting the bullish channel and we are bullish bias. Price has broken the previous high to test at the first resistance at 114.483 where the swing high sits. If bullish momentum continues, it could bring price toward the second resistance at 120.506 where the previous swing high sits. Alternatively, it could pull back to test the first support at 112.571 where the 23.6% retracement sits then the second support at 110.855 where the 50% retracement and overlap support sits
Areas of consideration:
- H4 time frame, 1st resistance at 114.483
- H4 time frame, 1st support at 112.571
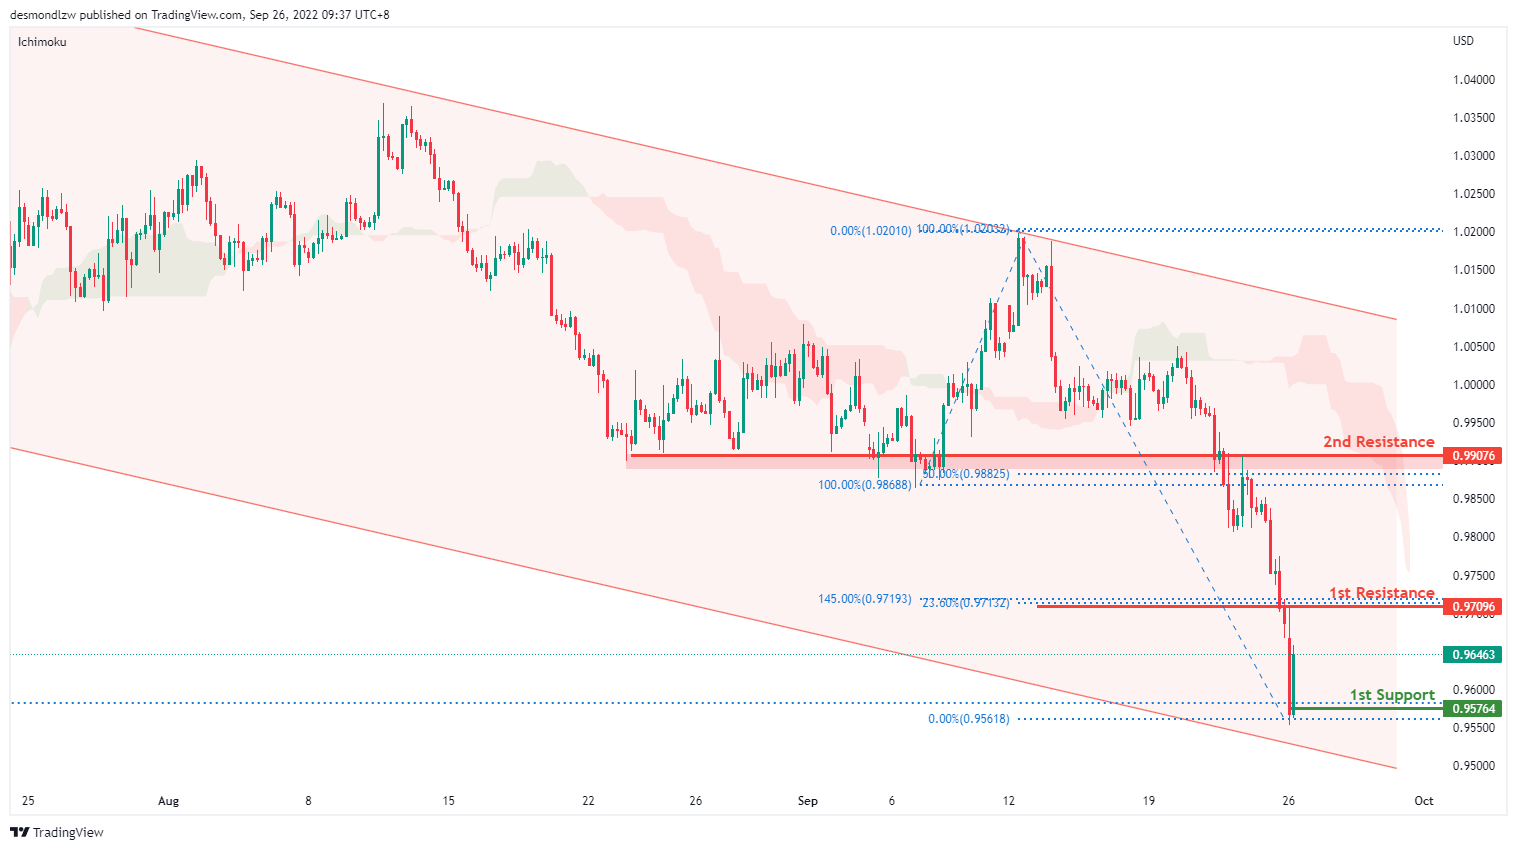
EUR/USD:
On the H4, price is moving within the channel in a descending manner- we are bearish biased. Price has bounced off the first support and it looks like it’s moving to test the first resistance at 0.9709 where the 23.6% retracement and 145% extension sits. If price breaks this level, it will bring prices to the second resistance at 0.9907 where the 50% retracement and 100% projection sits. Alternatively it could continue with its bearish momentum to bring the price back down to 0.9576 where the previous swing low and 161.8% extension sits.
Areas of consideration :
- H4 1st resistance at 0.9709
- H4 1st support at 0.9576
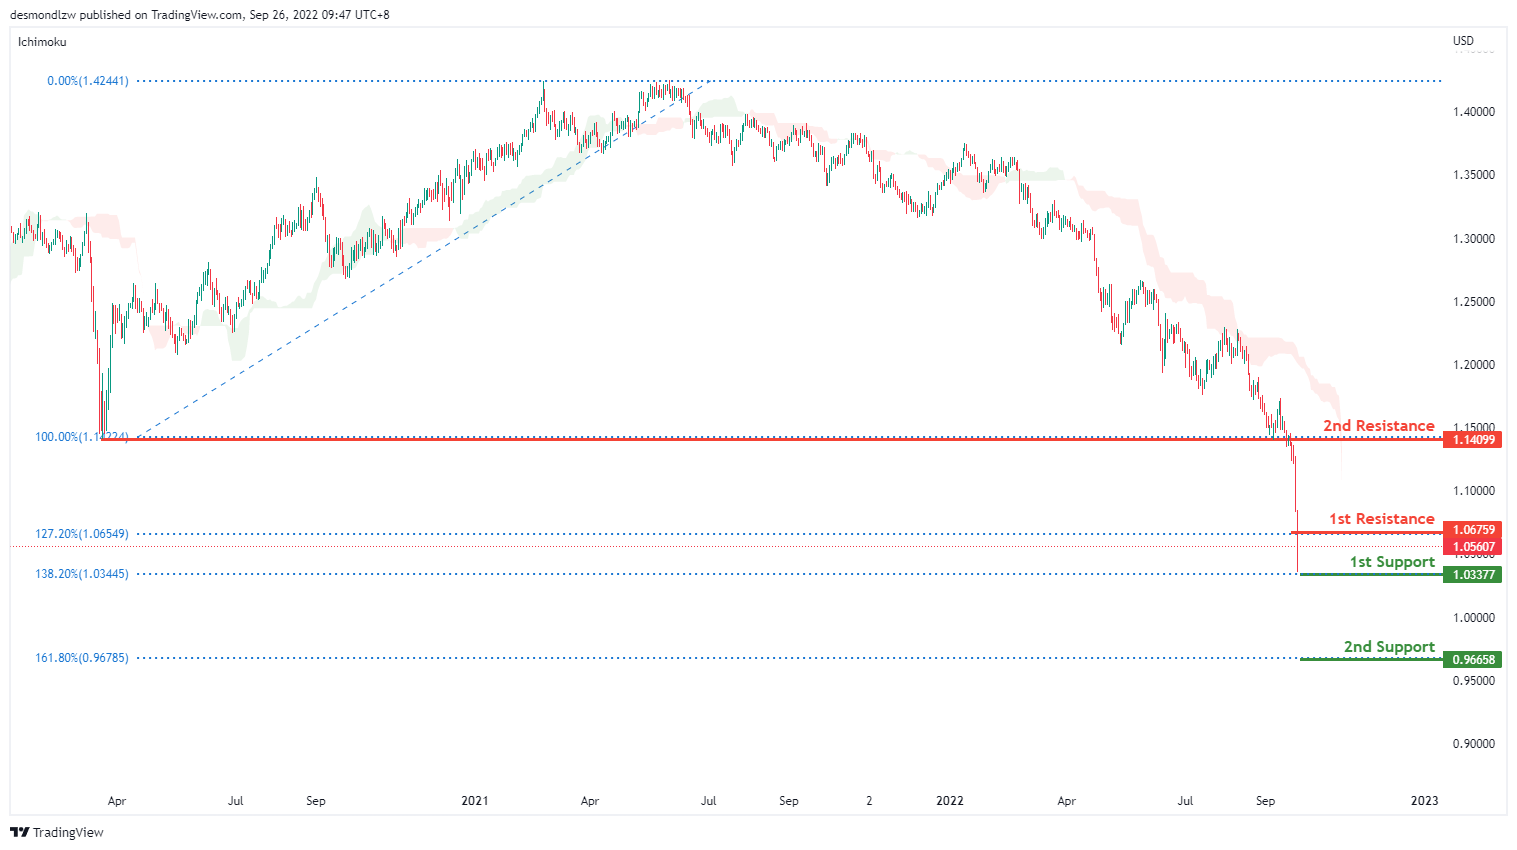
GBP/USD:
On the daily time frame, prices are still moving in a bearish momentum hence we are bearish biassed. Price has already tested the previous swing low at 1.0337 where the 138.2% extension sits. If bearish momentum continues, it should bring price to 0.9665 where the 161.8% extension sits. Alternatively price could pull back to test the first resistance at 1.0560 where the 127.2% extension sits then the second resistance at 1.1409 where the previous swing low sits
Areas of consideration:
- H4 1st resistance at 1.0675
- H4 1st support at 1.0337
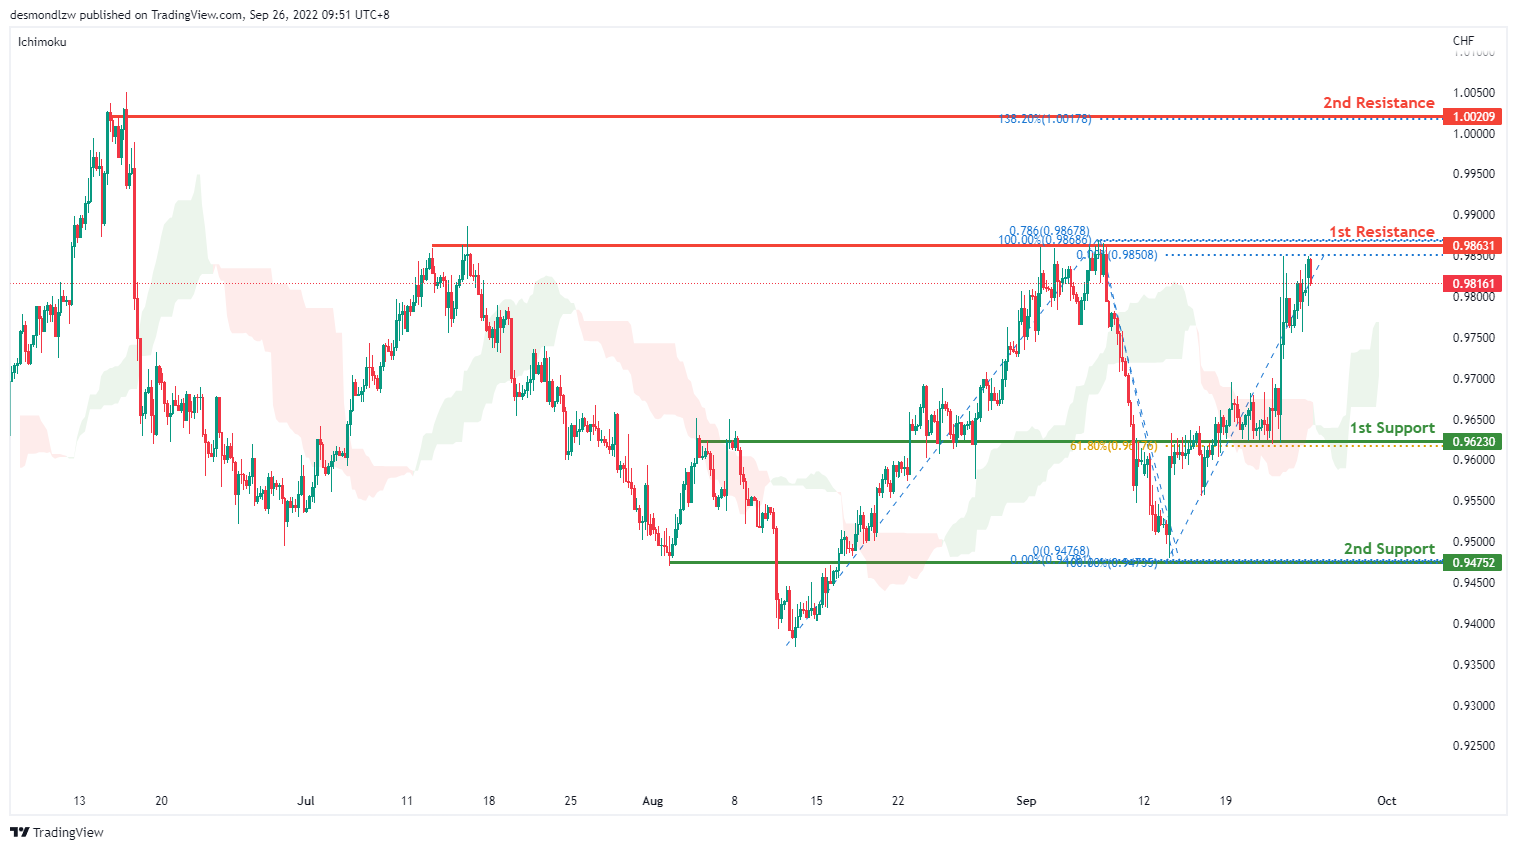
USD/CHF:
On the H4, prices have broken the descending channel and we are currently bullish biased. Price has broken the first support and is moving toward the first resistance at 0.9863 where the 78.6% projection and previous swing high sits. If bullish momentum continues, it should bring price to the second resistance at 1.0020 where the swing high and 138.2% extension sits. Alternatively, price could pull back to test the first support at 0.9623 where the 61.8% retracement and overlapping resistance sits. If it breaks the first support, it should bring price to the second support at 0.9475 where the 100% projection sits.
Areas of consideration
- H4 1st support at 0.9623
- H4 1st resistance at 0.9863
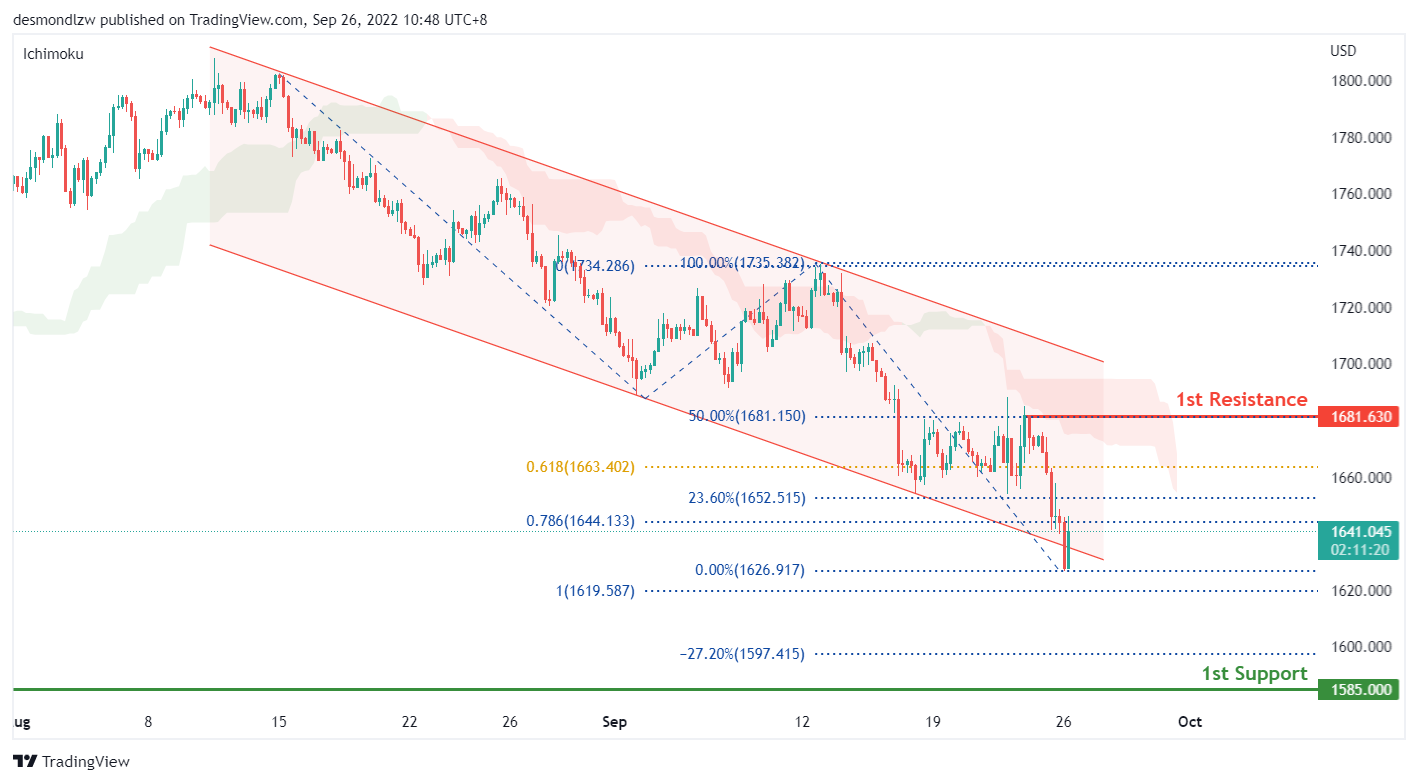
XAU/USD (GOLD):
On the H4, with the price broke out of the descending channel briefly but maintains below the ichimoku cloud, leading to a continual bearish bias that price may drop to the 1st support of 1585, which is in line with the swing low from March 2020. However, before the move lower, the price may first rebound to test the 1660 price level which is the 61.8% fibonacci extension, before trading lower.
Areas of consideration:
- H4 time frame, 1st resistance at 1680
- H4 time frame, 1st support at 1585
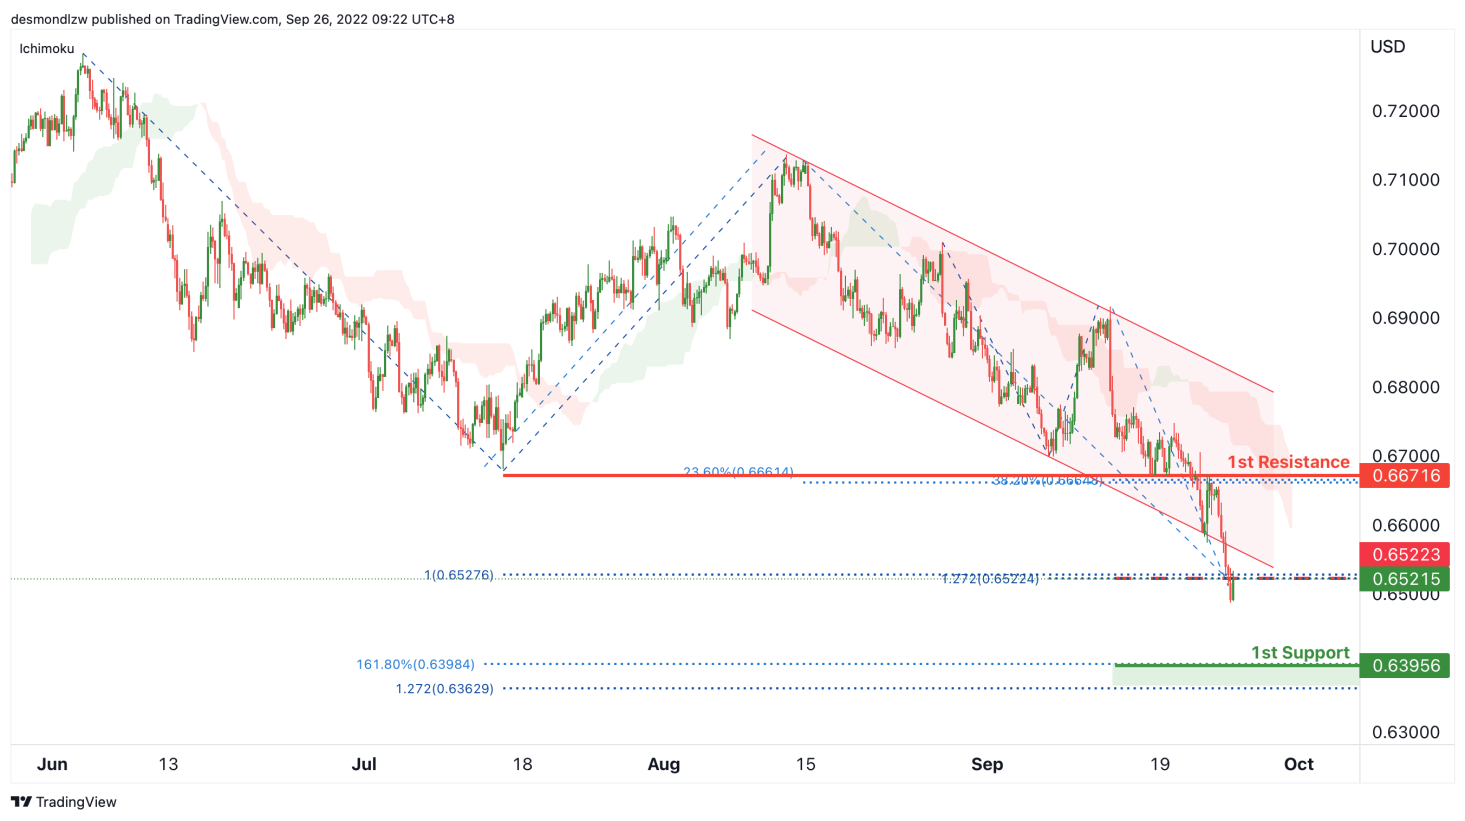
AUD/USD:
On the H4, with the price breaking the lower bound of descending channel, below ichimoku cloud and breaking the previous key support level at 0.65223, we have a bearish bias that the price may drop to the 1st support at 0.63965, which is in line with the 161.8% fibonacci extension and 127.2% fibonacci projection. Alternatively, the price may break the previous support level and rise to the 1st resistance at 0.66716, which is in line with 23.6% and 38.2% fibonacci retracement.
Areas of consideration
- H4, current price
- H4, 1st support at 0.63965
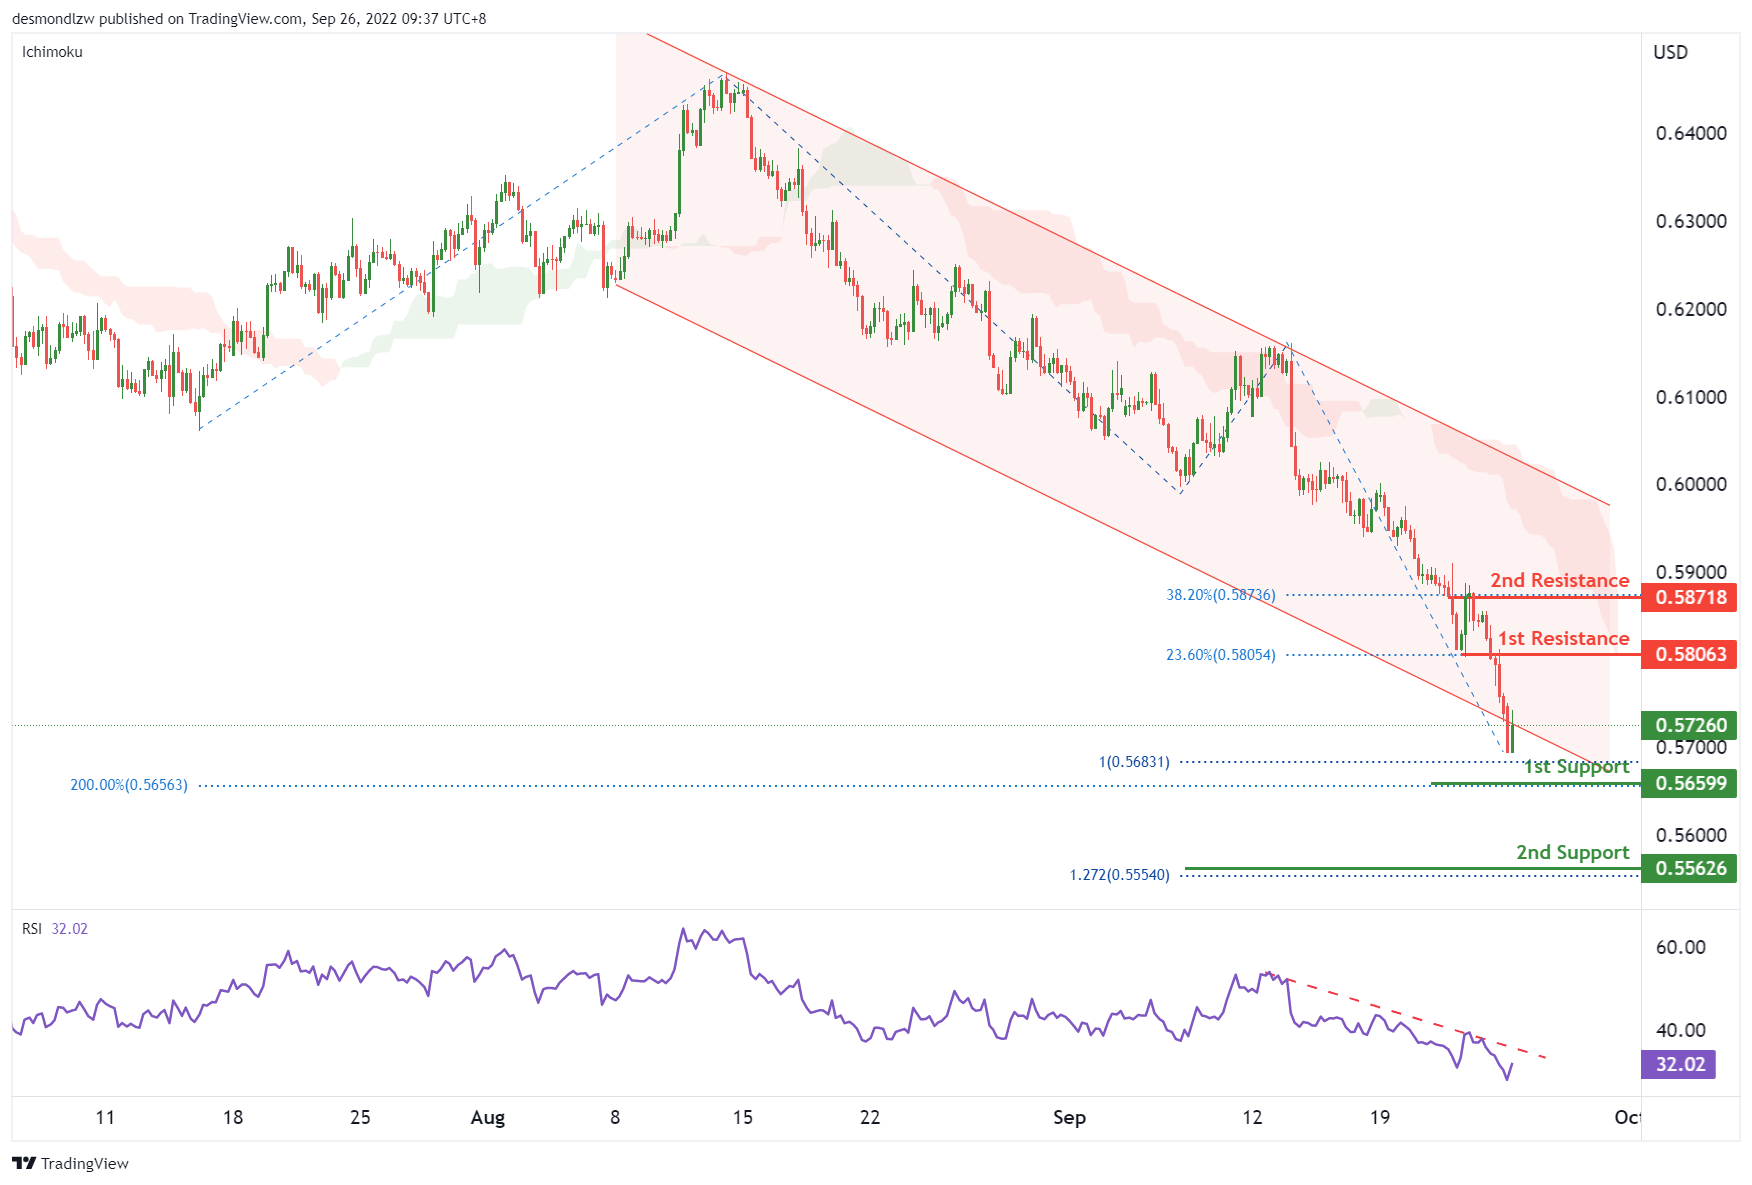
NZD/USD:
On the H4, with the price moving within the descending channel, below ichimoku cloud, we have a bearish bias that the price may drop to the 1st support at 0.56599, which is in line with the 100% fibonacci extension and 200% fibonacci extension. If the 1st support is broken, the 2nd support could be at 0.55626, which is in line with the 127.2% fibonacci extension. Alternatively, the price may pull back to the 1st resistance at 0.58063, which is in line with the 23.6% fibonacci retracement , if the 1st resistance is broken, the 2nd resistance could be at 0.58718, where the 38.2% fibonacci retracement is.
Areas of consideration:
- H4 time frame, 1st support at 0.56599
- H4 time frame, 2nd support at 0.55626
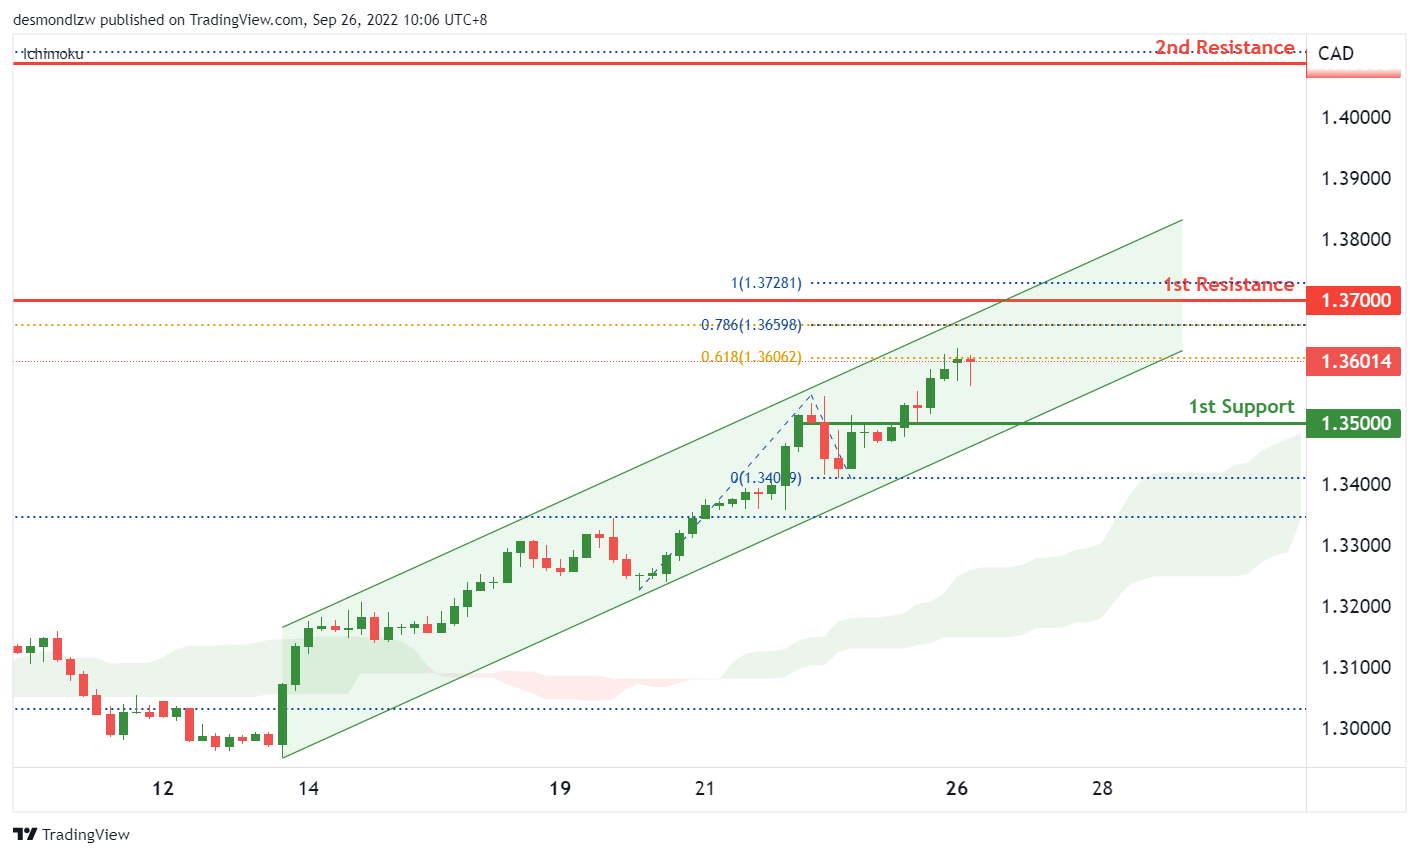
USD/CAD:
On the H4, with the price having trading within the ascending channel and staying above the ichimoku cloud, we have a bullish bias that the price may rise to the 1st resistance at 1.37, major swing high from June 2020 and also slightly above a major 61.8% fibonacci retracement. There is a risk level at 1.36 which is where our intermediate resistance and the 61.8% fibonacci extension, this level needs to be broken to trigger the next move up to our resistance level. Beyond the 1st resistance, the 2nd resistance is at 1.41, major swing high from May 2020 and also at the 78.60% fibonacci retracement.
Areas of consideration:
- H4 time frame, 1st resistance at 1.37
- H4 time frame, 2nd resistance 1.40
- H4 time frame, 1st support at 1.35
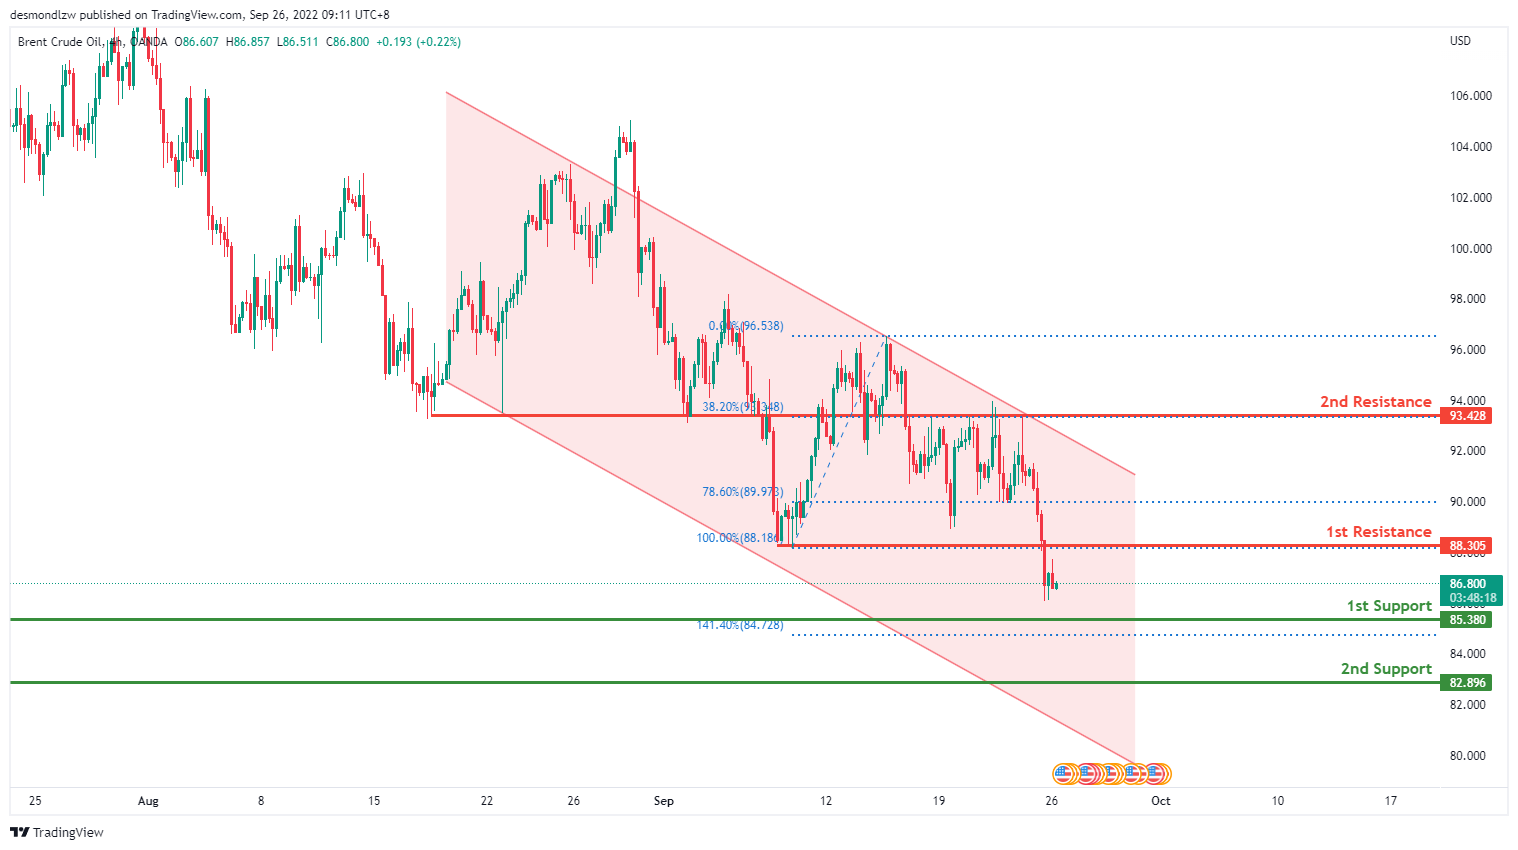
OIL:
On the H4, the overall bias with oil is bearish since the price is moving within the bearish channel. Price broke through the 1st resistance at 88.305 where the 100% Fibonacci line and previous swing low are. Price could possibily continue bearish and head towards the 1st support at 85.380 where the 141.4% Fibonacci extension line lies.
Areas of consideration:
- H4 time frame, 1st resistance at 88.305
- H4 time frame, 1st support at 85.380
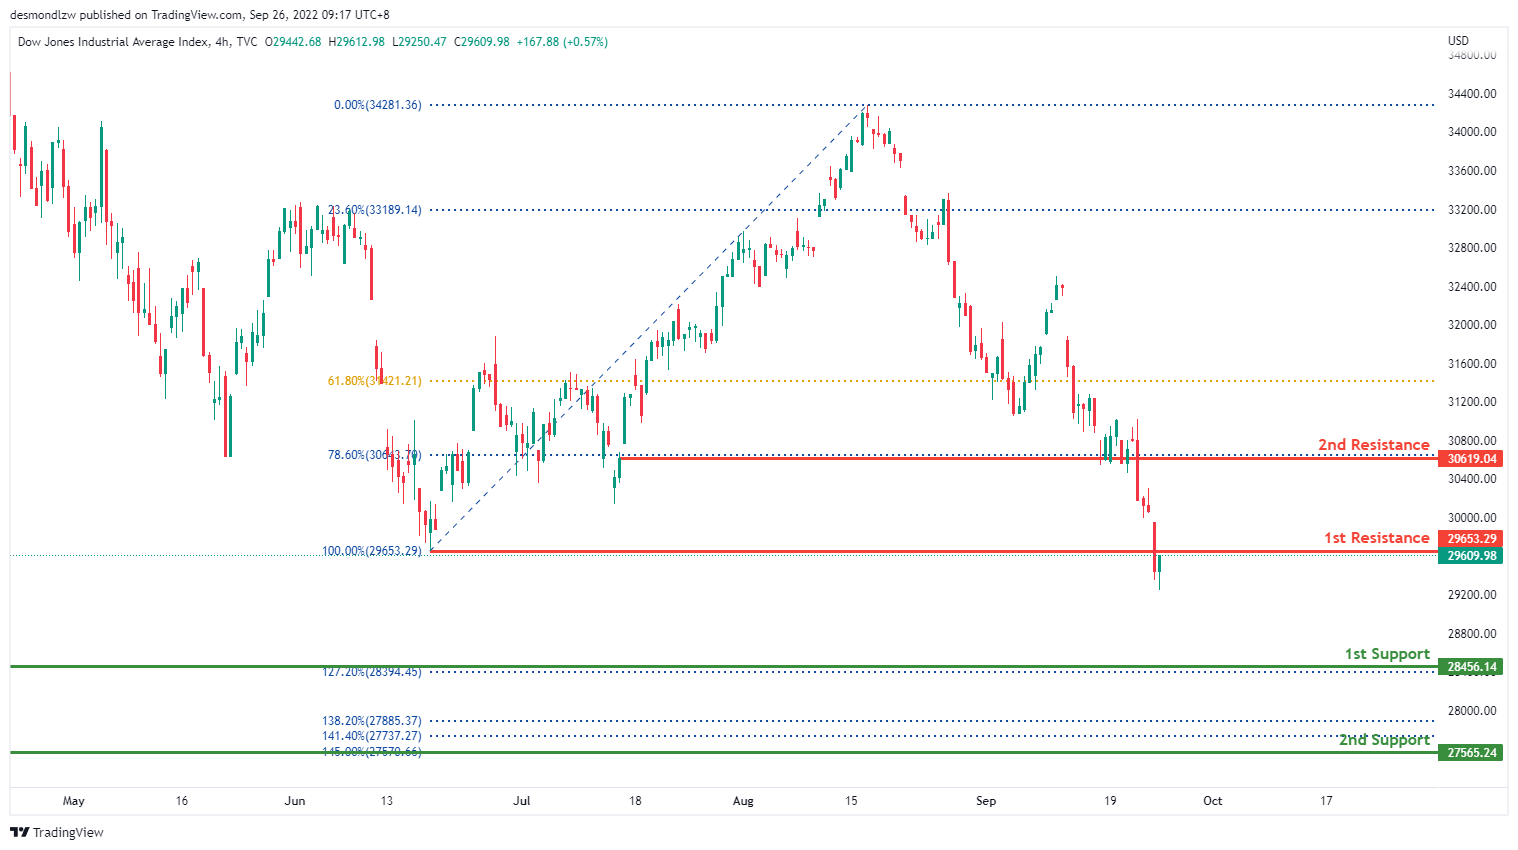
Dow Jones Industrial Average:
On the H4, price is on a very bearish trend. Price has broke through the 1st resistance at 29653.29, where the 100% Fibonacci line and previous swing low lies. Price might continue heading downwards towards the 1st support at 28456.14 where the 127.2% Fibonacci extension line is.
Areas of consideration:
- H4 time frame, 1st support at 28456.14
- H4 time frame, 1st resistance at 29653.29
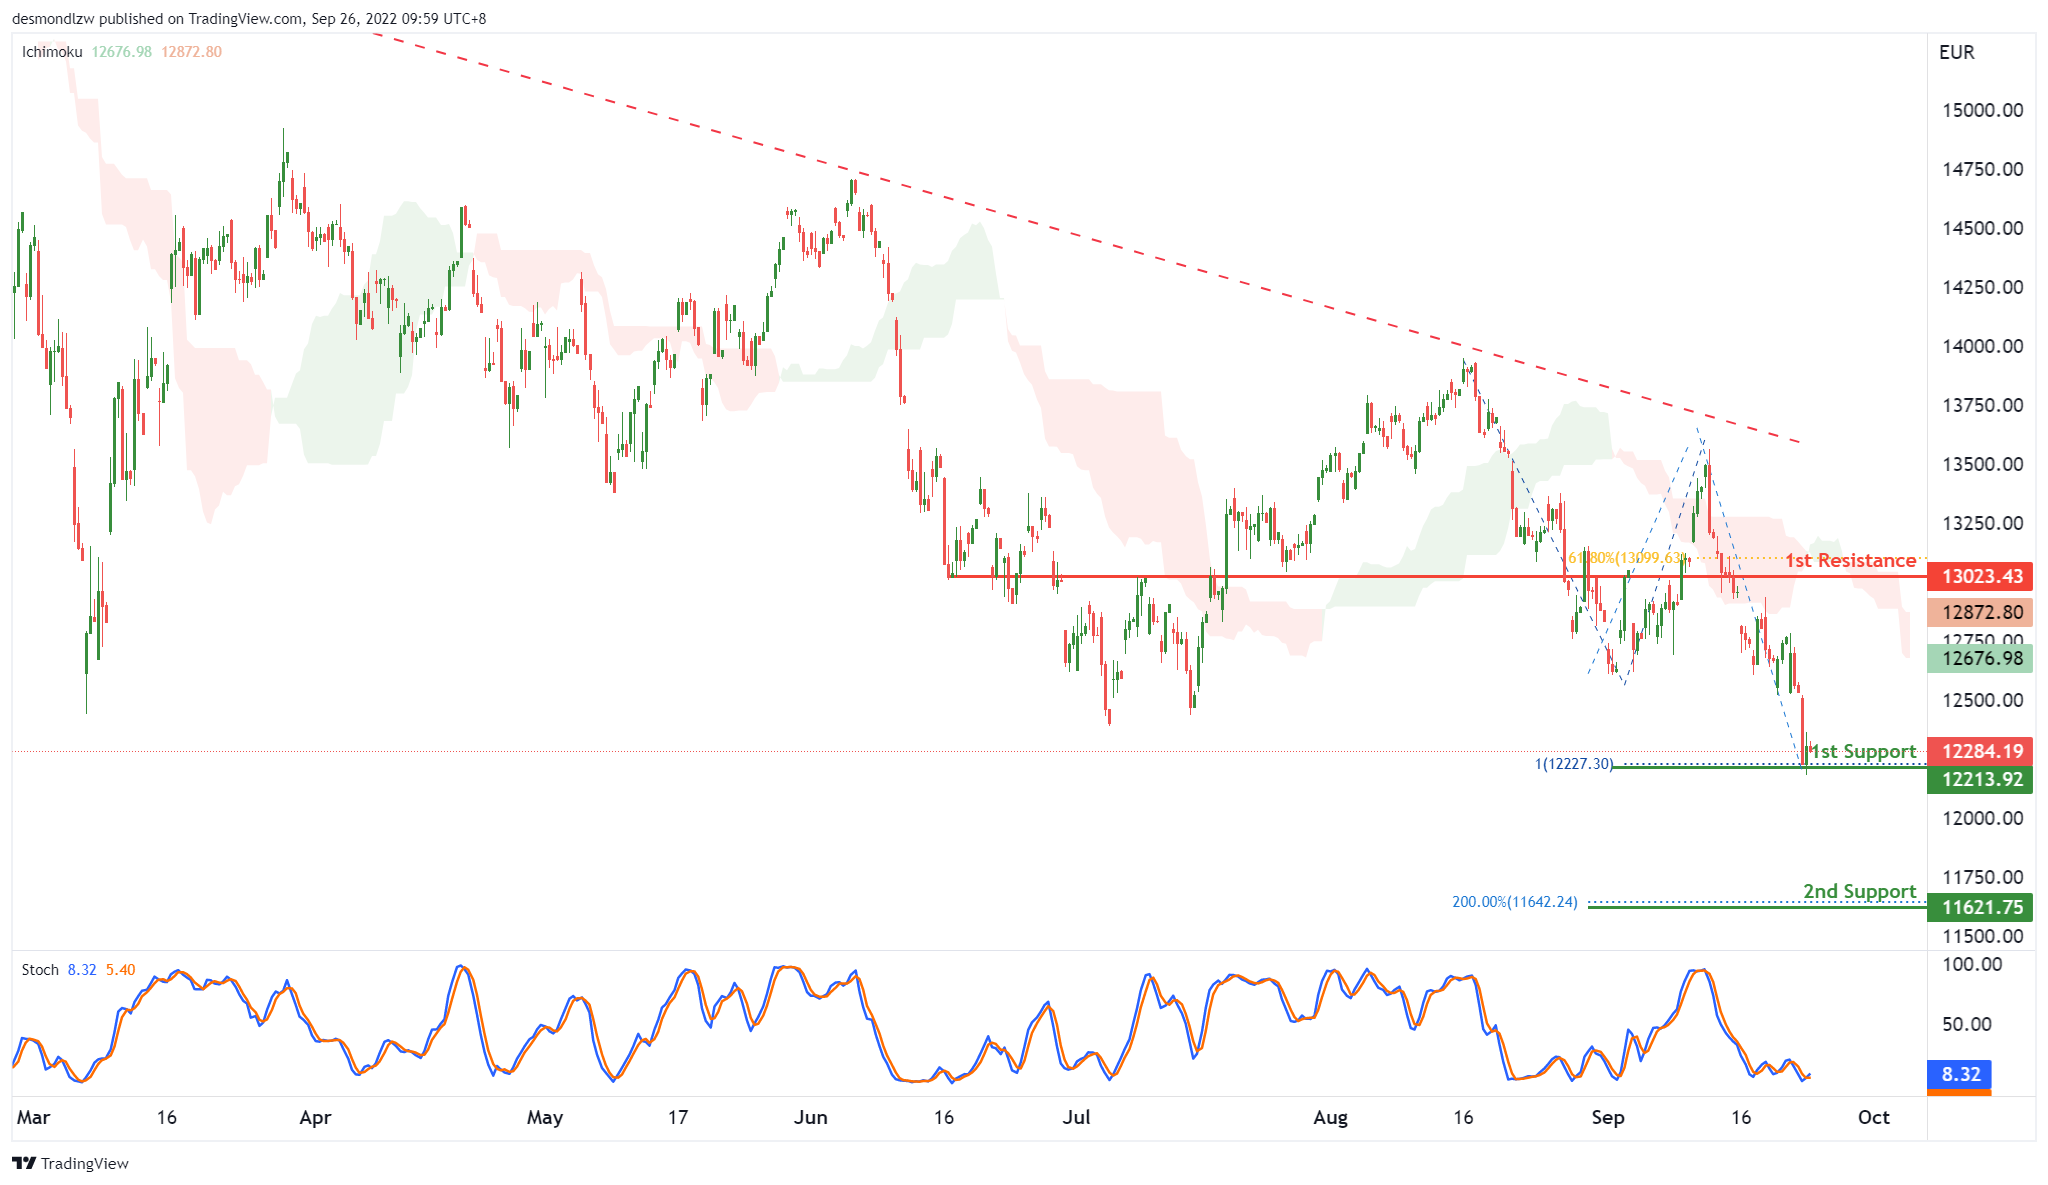
DAX:
On the H4, with the price moving below the descending trendline and below ichimoku cloud, we have a bearish bias that the price may drop from the 1st support at 12213.92, which is in line with the swing lows and 100% fibonacci projection. If the 1st support is broken, the next support level could be at 11621.75, where the 200% fibonacci extension is. Alternatively, the price may rise to the 1st resistance at 13023.43, where the 61.8% fibonacci retracement and overlap resistance are.
Areas of consideration:
- H4 time frame, 1st support at 12213.92
- H4 time frame, 2nd support at 11621.75
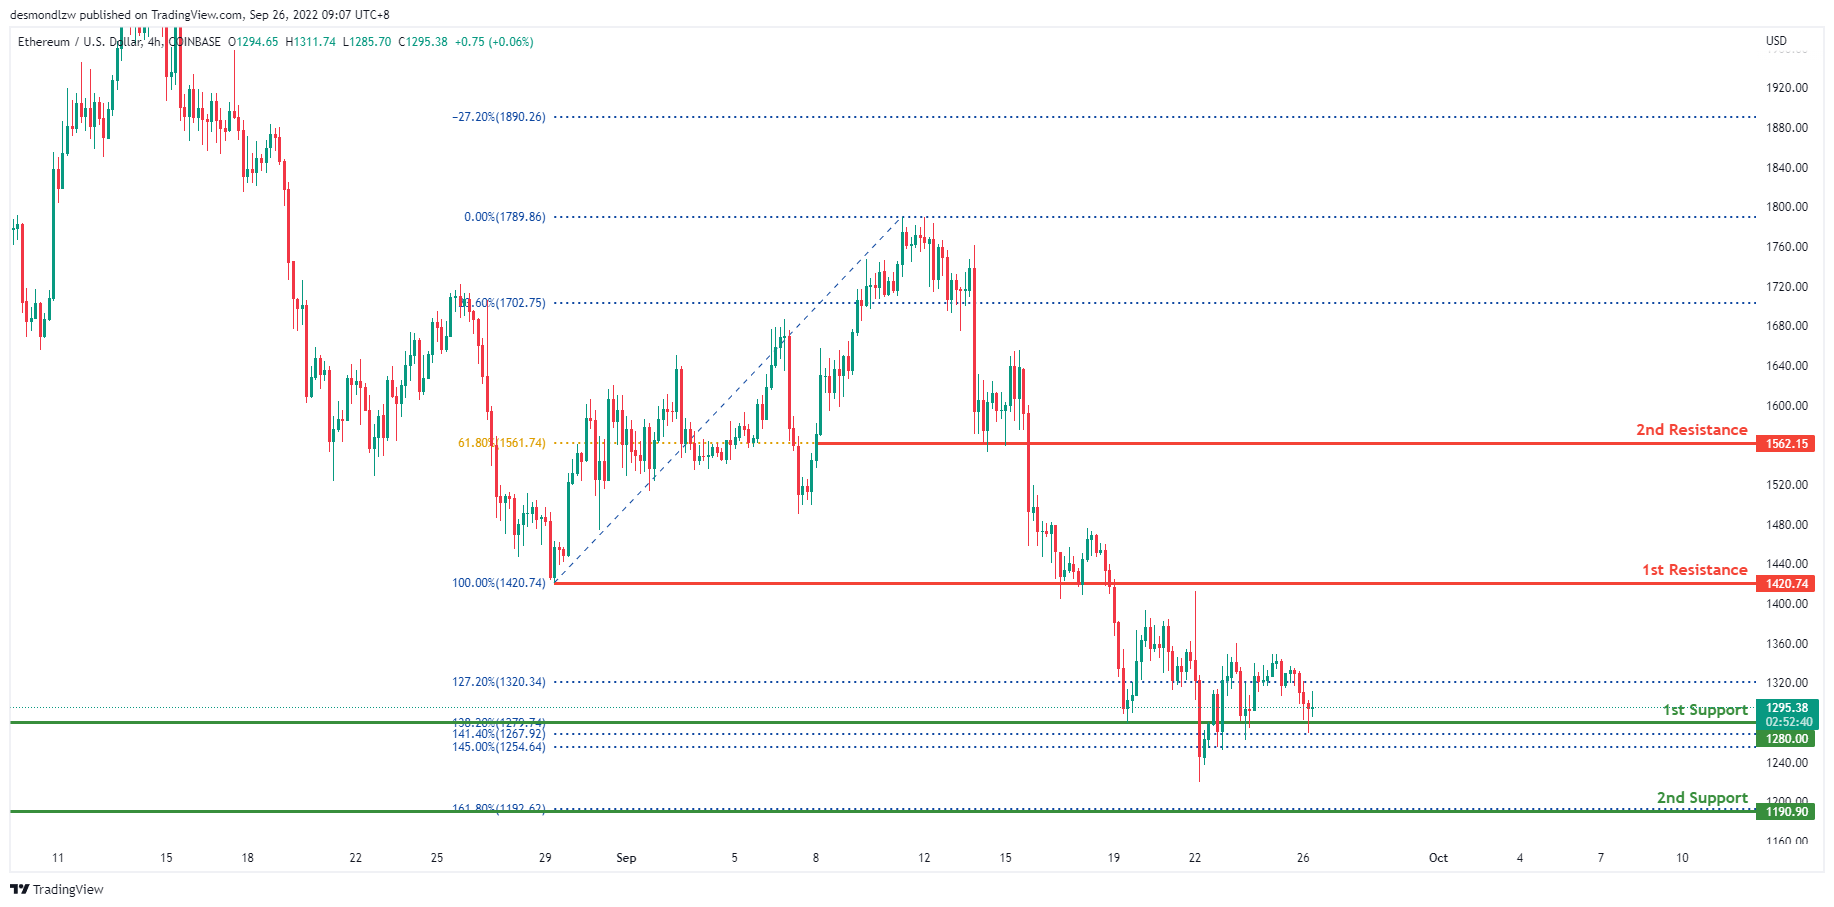
ETHUSD:
On the H4, overall price is very bearish on ETHUSD. Price has broken through the 1st Support at 1280.00 where the 138.2% Fibonacci extension line is, and went back up having price close nicely resting on it. Price could possible head back up to the 1st resistance for retracement and then head lower back down towards the 2nd support area.
Areas of consideration:
- H4 time frame, 1st resistance of 1420.74
- H4 time frame, 1st support at 1280.00
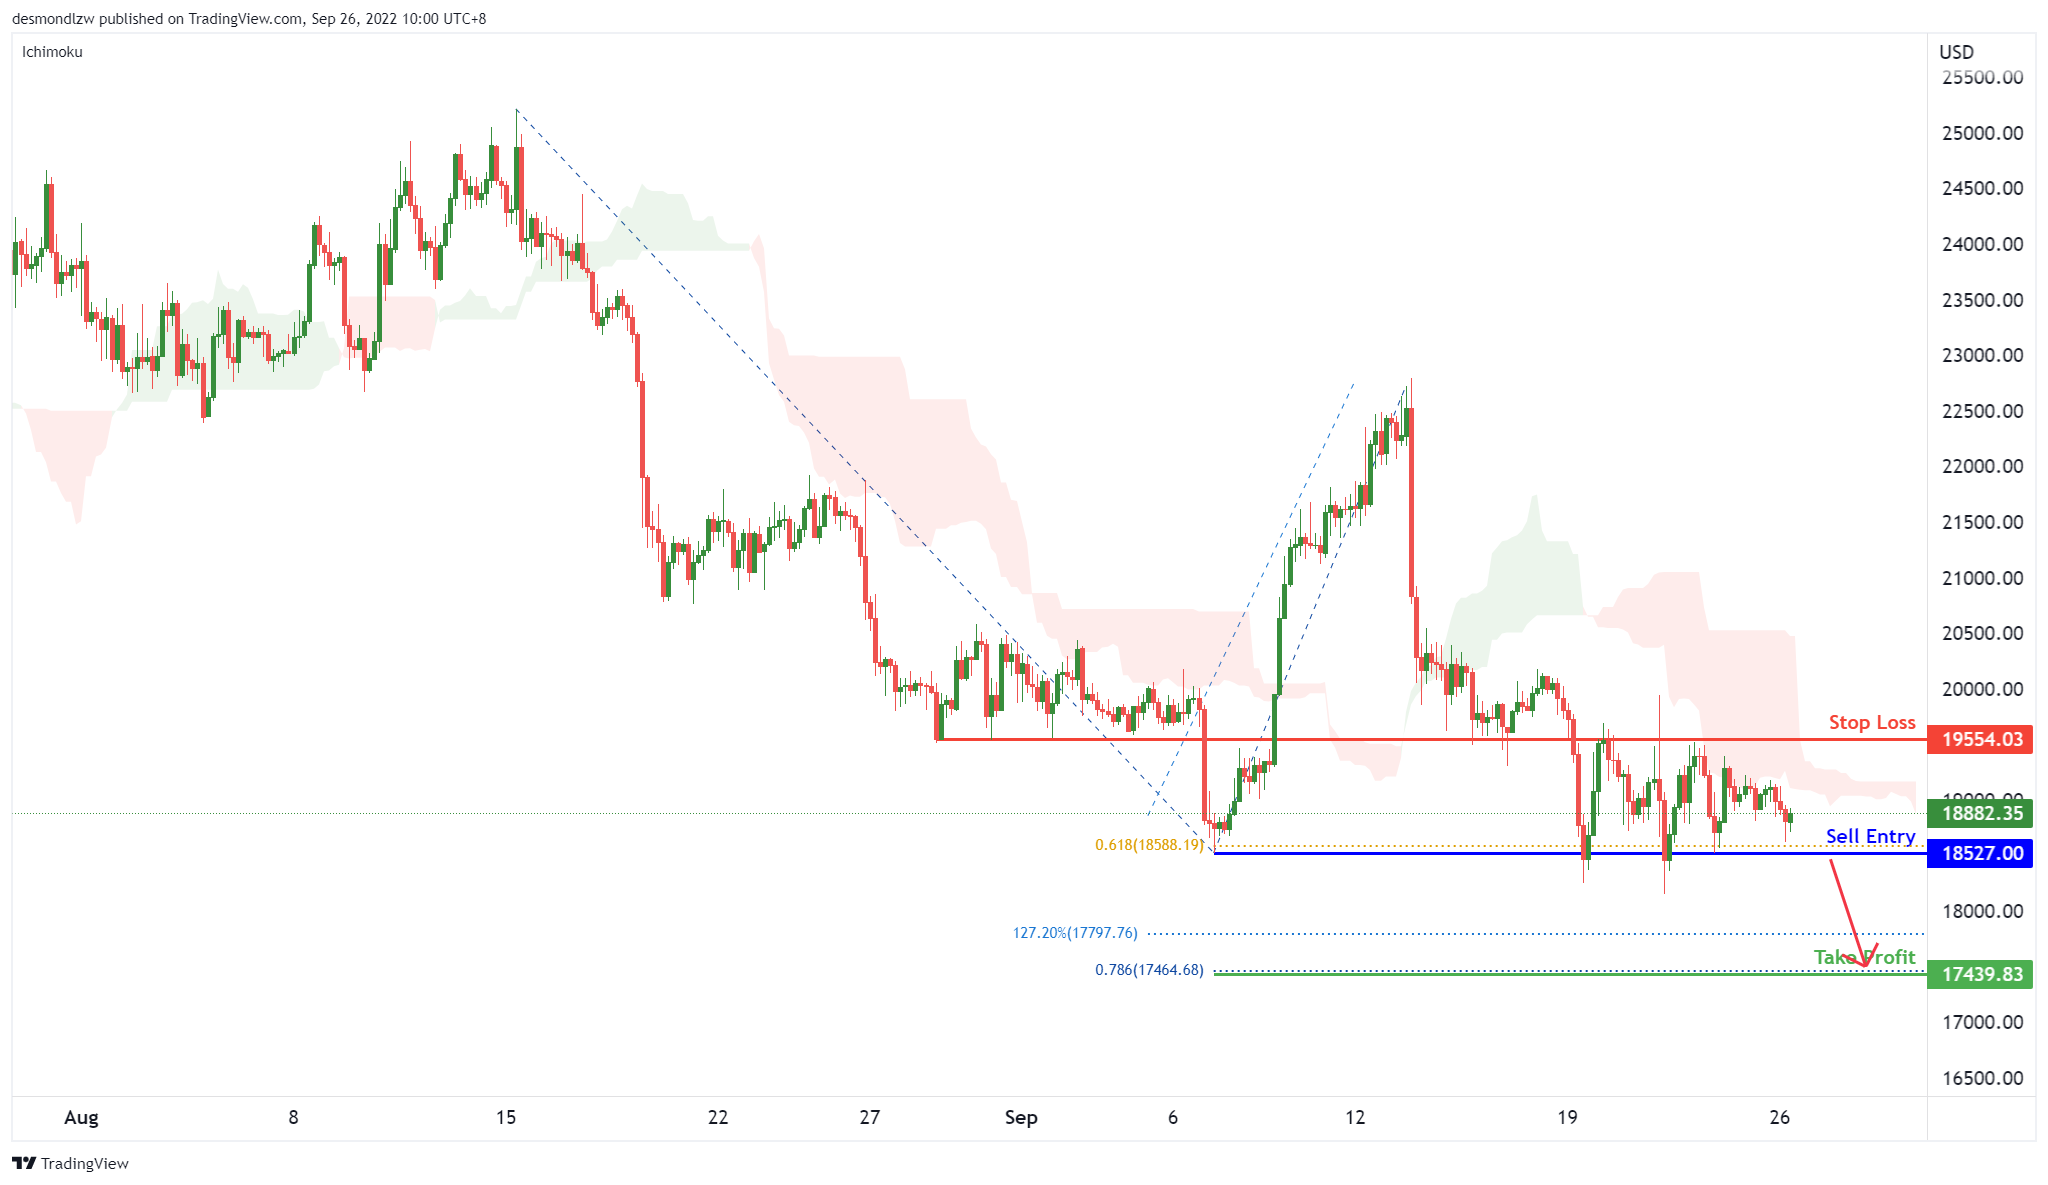
BTCUSD:
On the H4, with the price moving below the ichimoku cloud, we have a bearish bias that the price may drop to the 1st support at 18527, which is in line with the swing lows and 61.8% fibonacci projection, if the 1st support is broken, the 2nd support could be at 2nd support at 17439.83, where the 127.2% fibonacci extension and 78.6% fibonacci projection are. Alternatively, the price may rise to the 1st resistance at 19554.03, where the overlap resistance is.
Areas of consideration:
- H4 time frame, 1st support at 18527
- H4 time frame, 2nd support at 17439.83
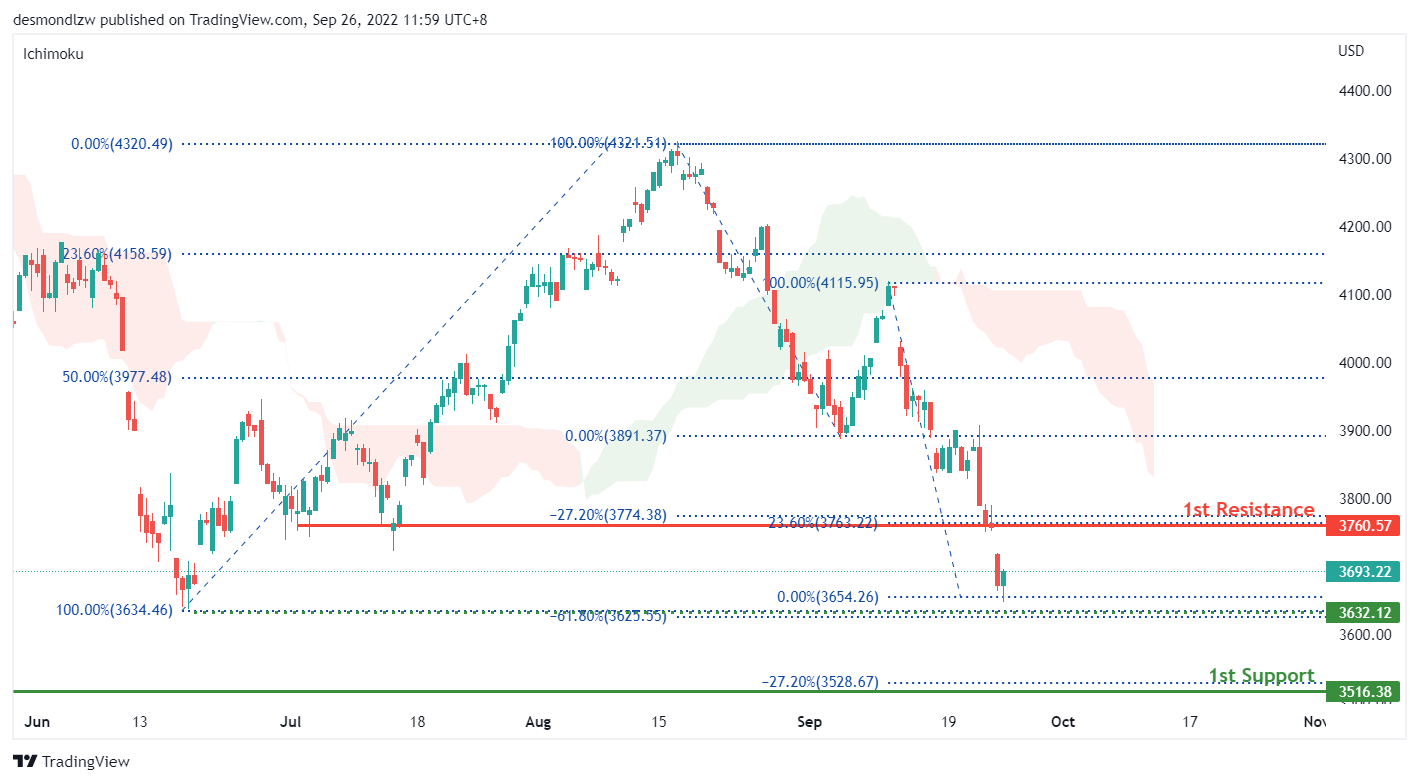
S&P 500:
On the H4, with the price on a strong bearish trend and below the ichimoku cloud, we have a bearish bias that price may drop to the 1st support of 3516.38, which is in line with the -27.2% fibonacci expansion and previous swing low. There is a risk level at 3632.12 which is where our intermediate support and -61.8% expansion is, this level needs to be broken to trigger the next move down to our support level. Alternatively, price could pull back to test the first resistance at 3760.57 where the 23.6% retracement and -27.2% expansion sits
Areas of consideration:
- H4 time frame, 1st resistance at 3760.57
- H4 time frame, 1st support at 3516.38


