
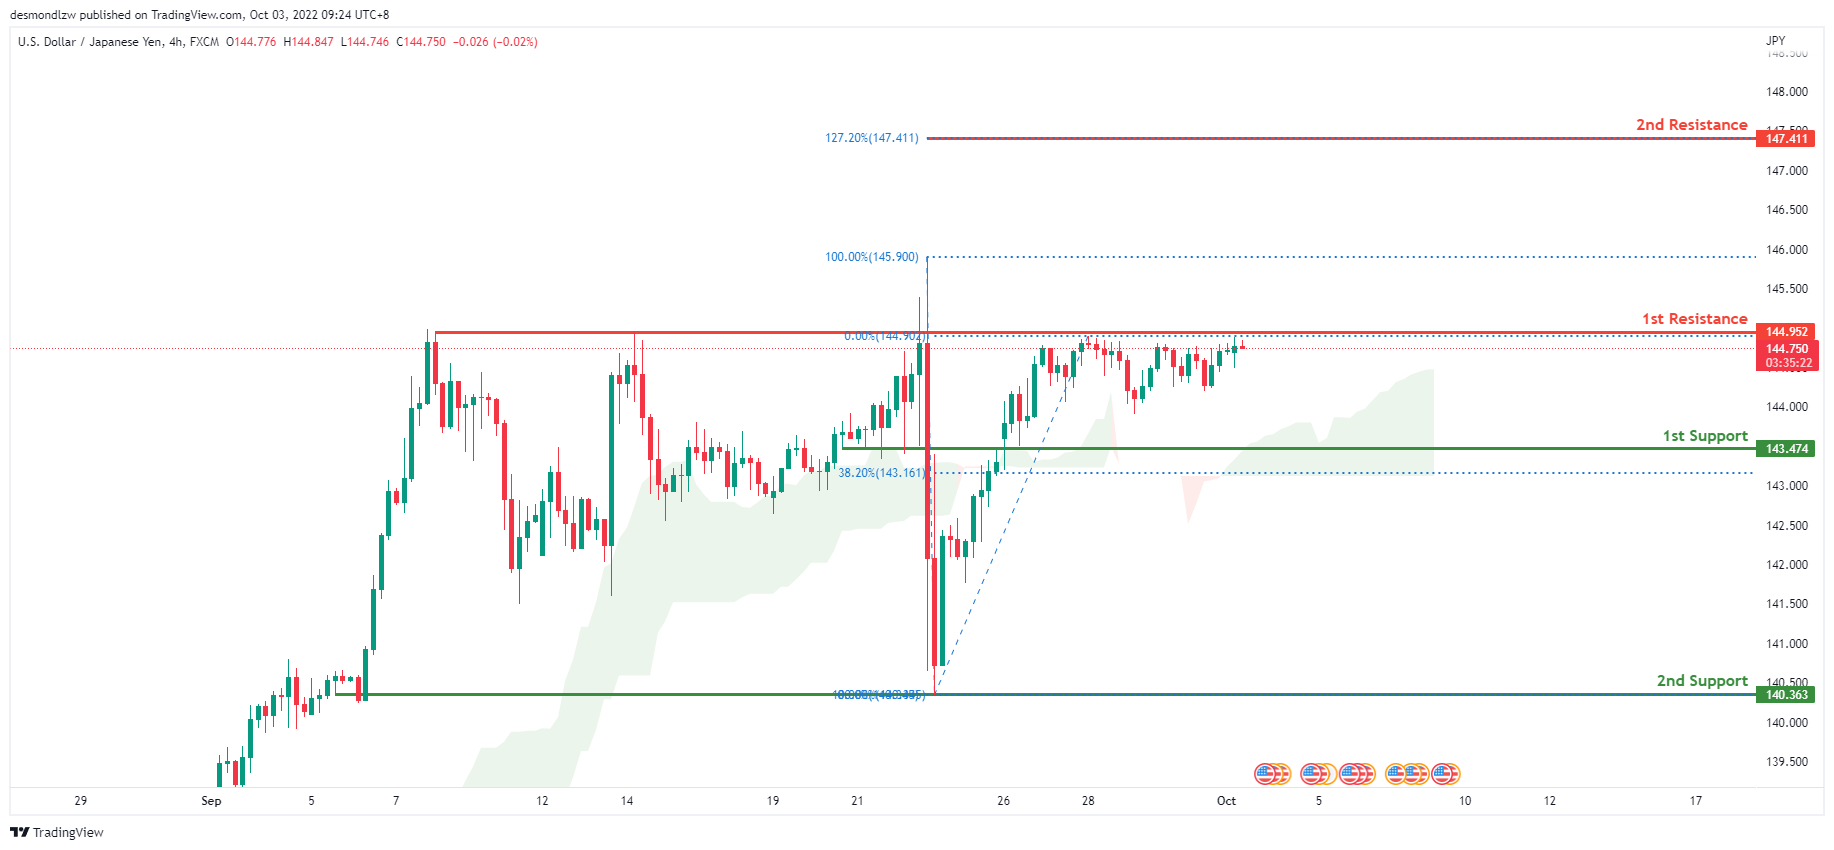
USD/JPY:
Price is in a strong bullish trend on the H4 chart. In addition, the price is above the ichimoku cloud, indicating a bullish market. Price has been consolidating near 144.952, the 0% Fibonacci line, for the past week following the Bank of Japan’s intervention. Price is expected to break through the first resistance and move towards the second resistance at 147.411 where the 127.2% Fibonacci expansion extension line is located.
Areas of consideration:
- H4 time frame, 1st resistance at 144.952
- H4 time frame, 1st support at 143.474
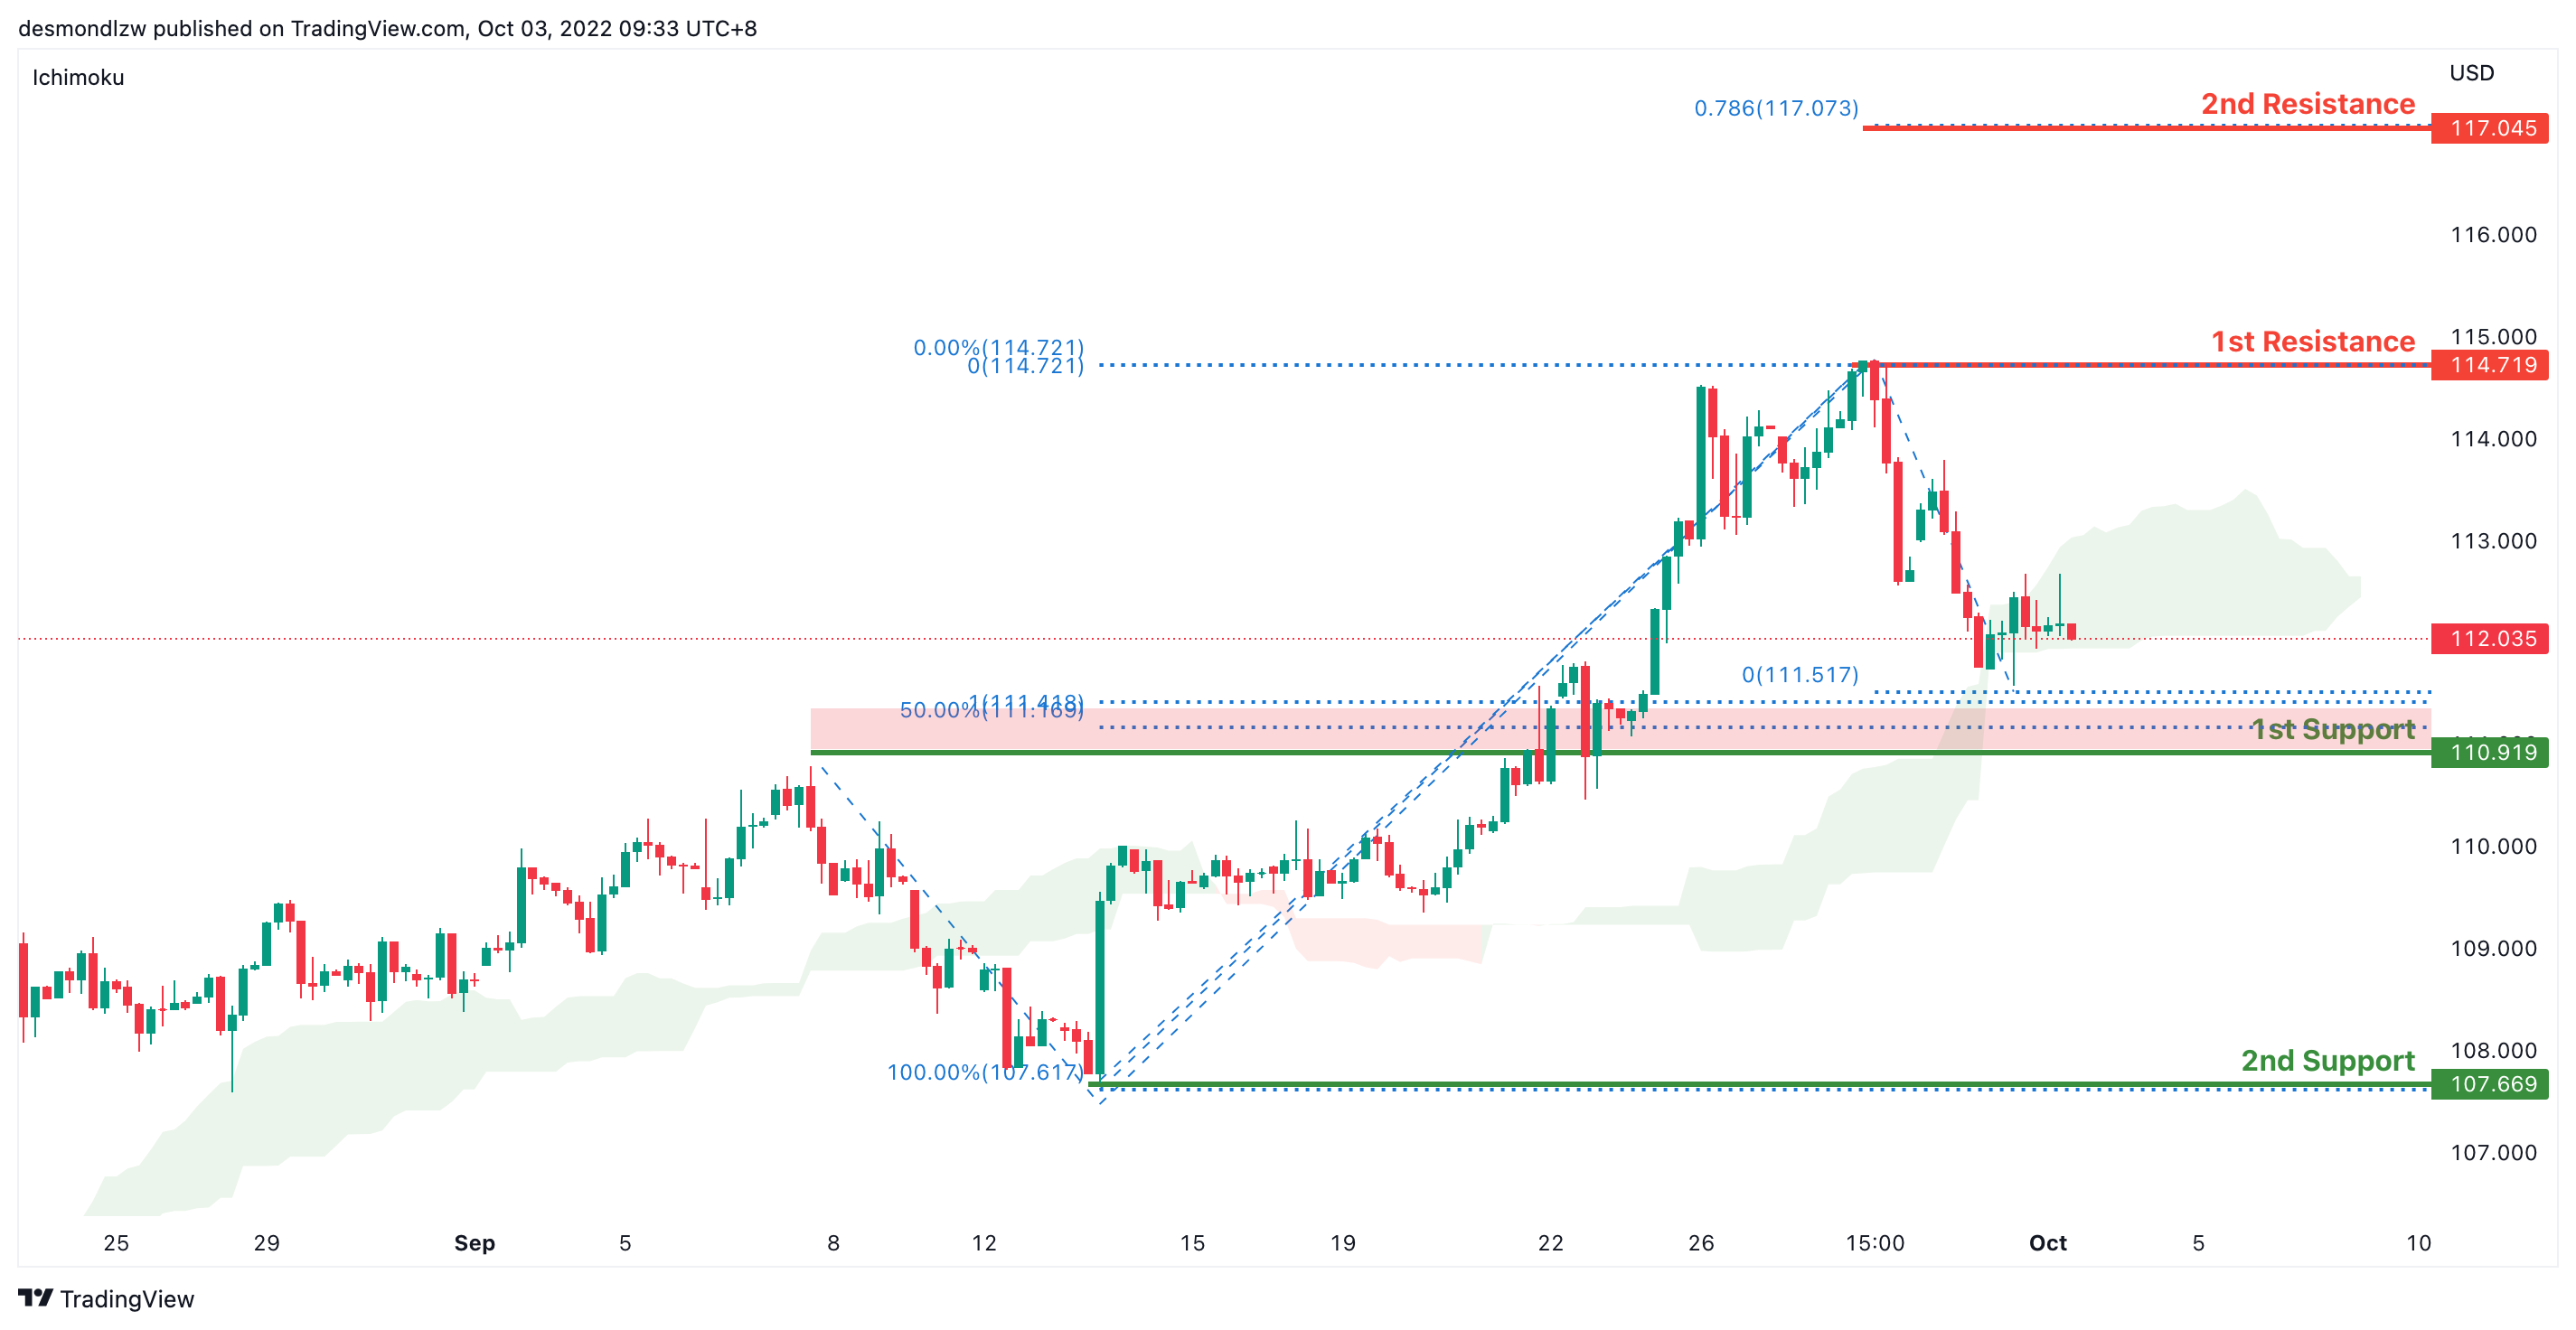
DXY:
On the H4, price has broken the ichimoku and has pulled back slightly forming a double top- we are bearish bias. Price has rejected the first resistance and pulled back to test the first support at 110.919 where the 50% retracement and 100% projection sits. If price breaks this support it should test the second support at 107.669 where the previous swing low sits. Alternatively price could test the first resistance again at 114.719 levels where the previous swing high sits and if it breaks this level, price might test the second resistance at 117.045 where the 78.6% projection sits.
Areas of consideration:
- H4 time frame, 1st resistance at 114.719
- H4 time frame, 1st support at 110.919
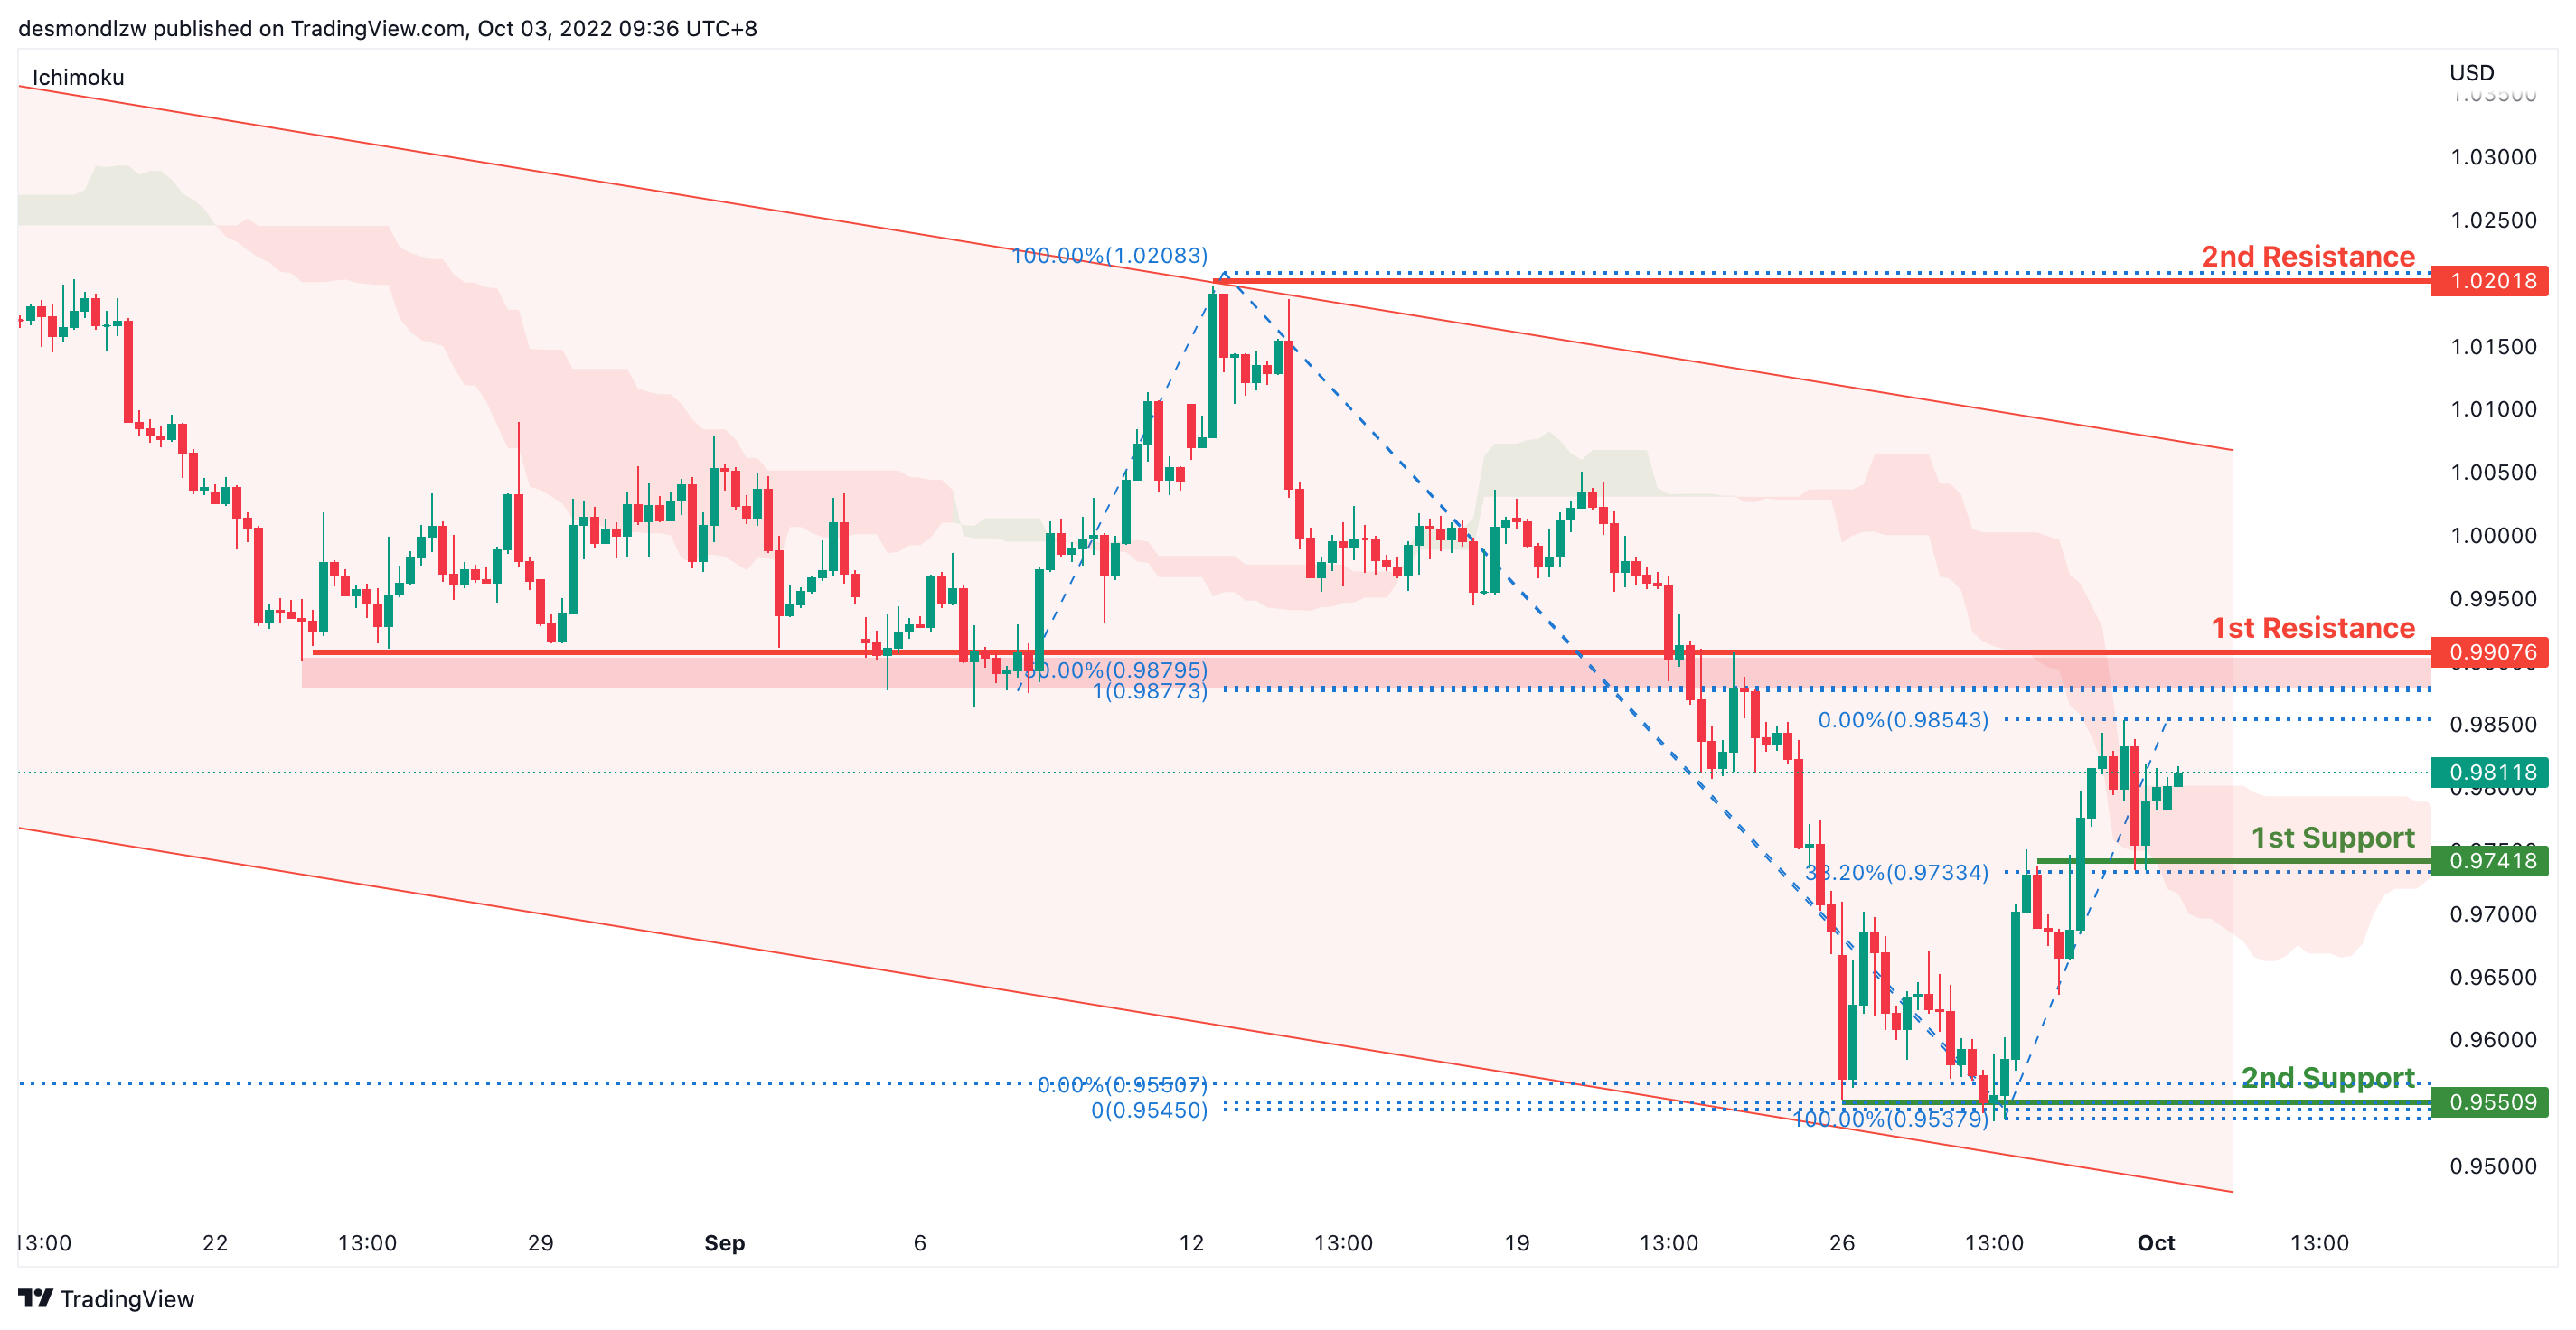
EUR/USD:
On the H4, price is moving within the channel but in an ascending manner- we are slightly bullish biased. Price has bounced off the first support and is moving toward the first resistance at 0.990 where the 100% projection and 50% retracement sits. If price breaks this level, it will test the second resistance at 1.0201 where the previous swing high sits. Alternatively, the overall bearish momentum could bring price back to test the first support at 0.9741 where the previous swing low and 38.2% retracement sits. If it breaks this level, we have a strong bearish confirmation to bring price down to 0.9550 where the 161.8% extension and swing low sits
Areas of consideration :
- H4 1st resistance at 0.9907
- H4 1st support at 0.9741
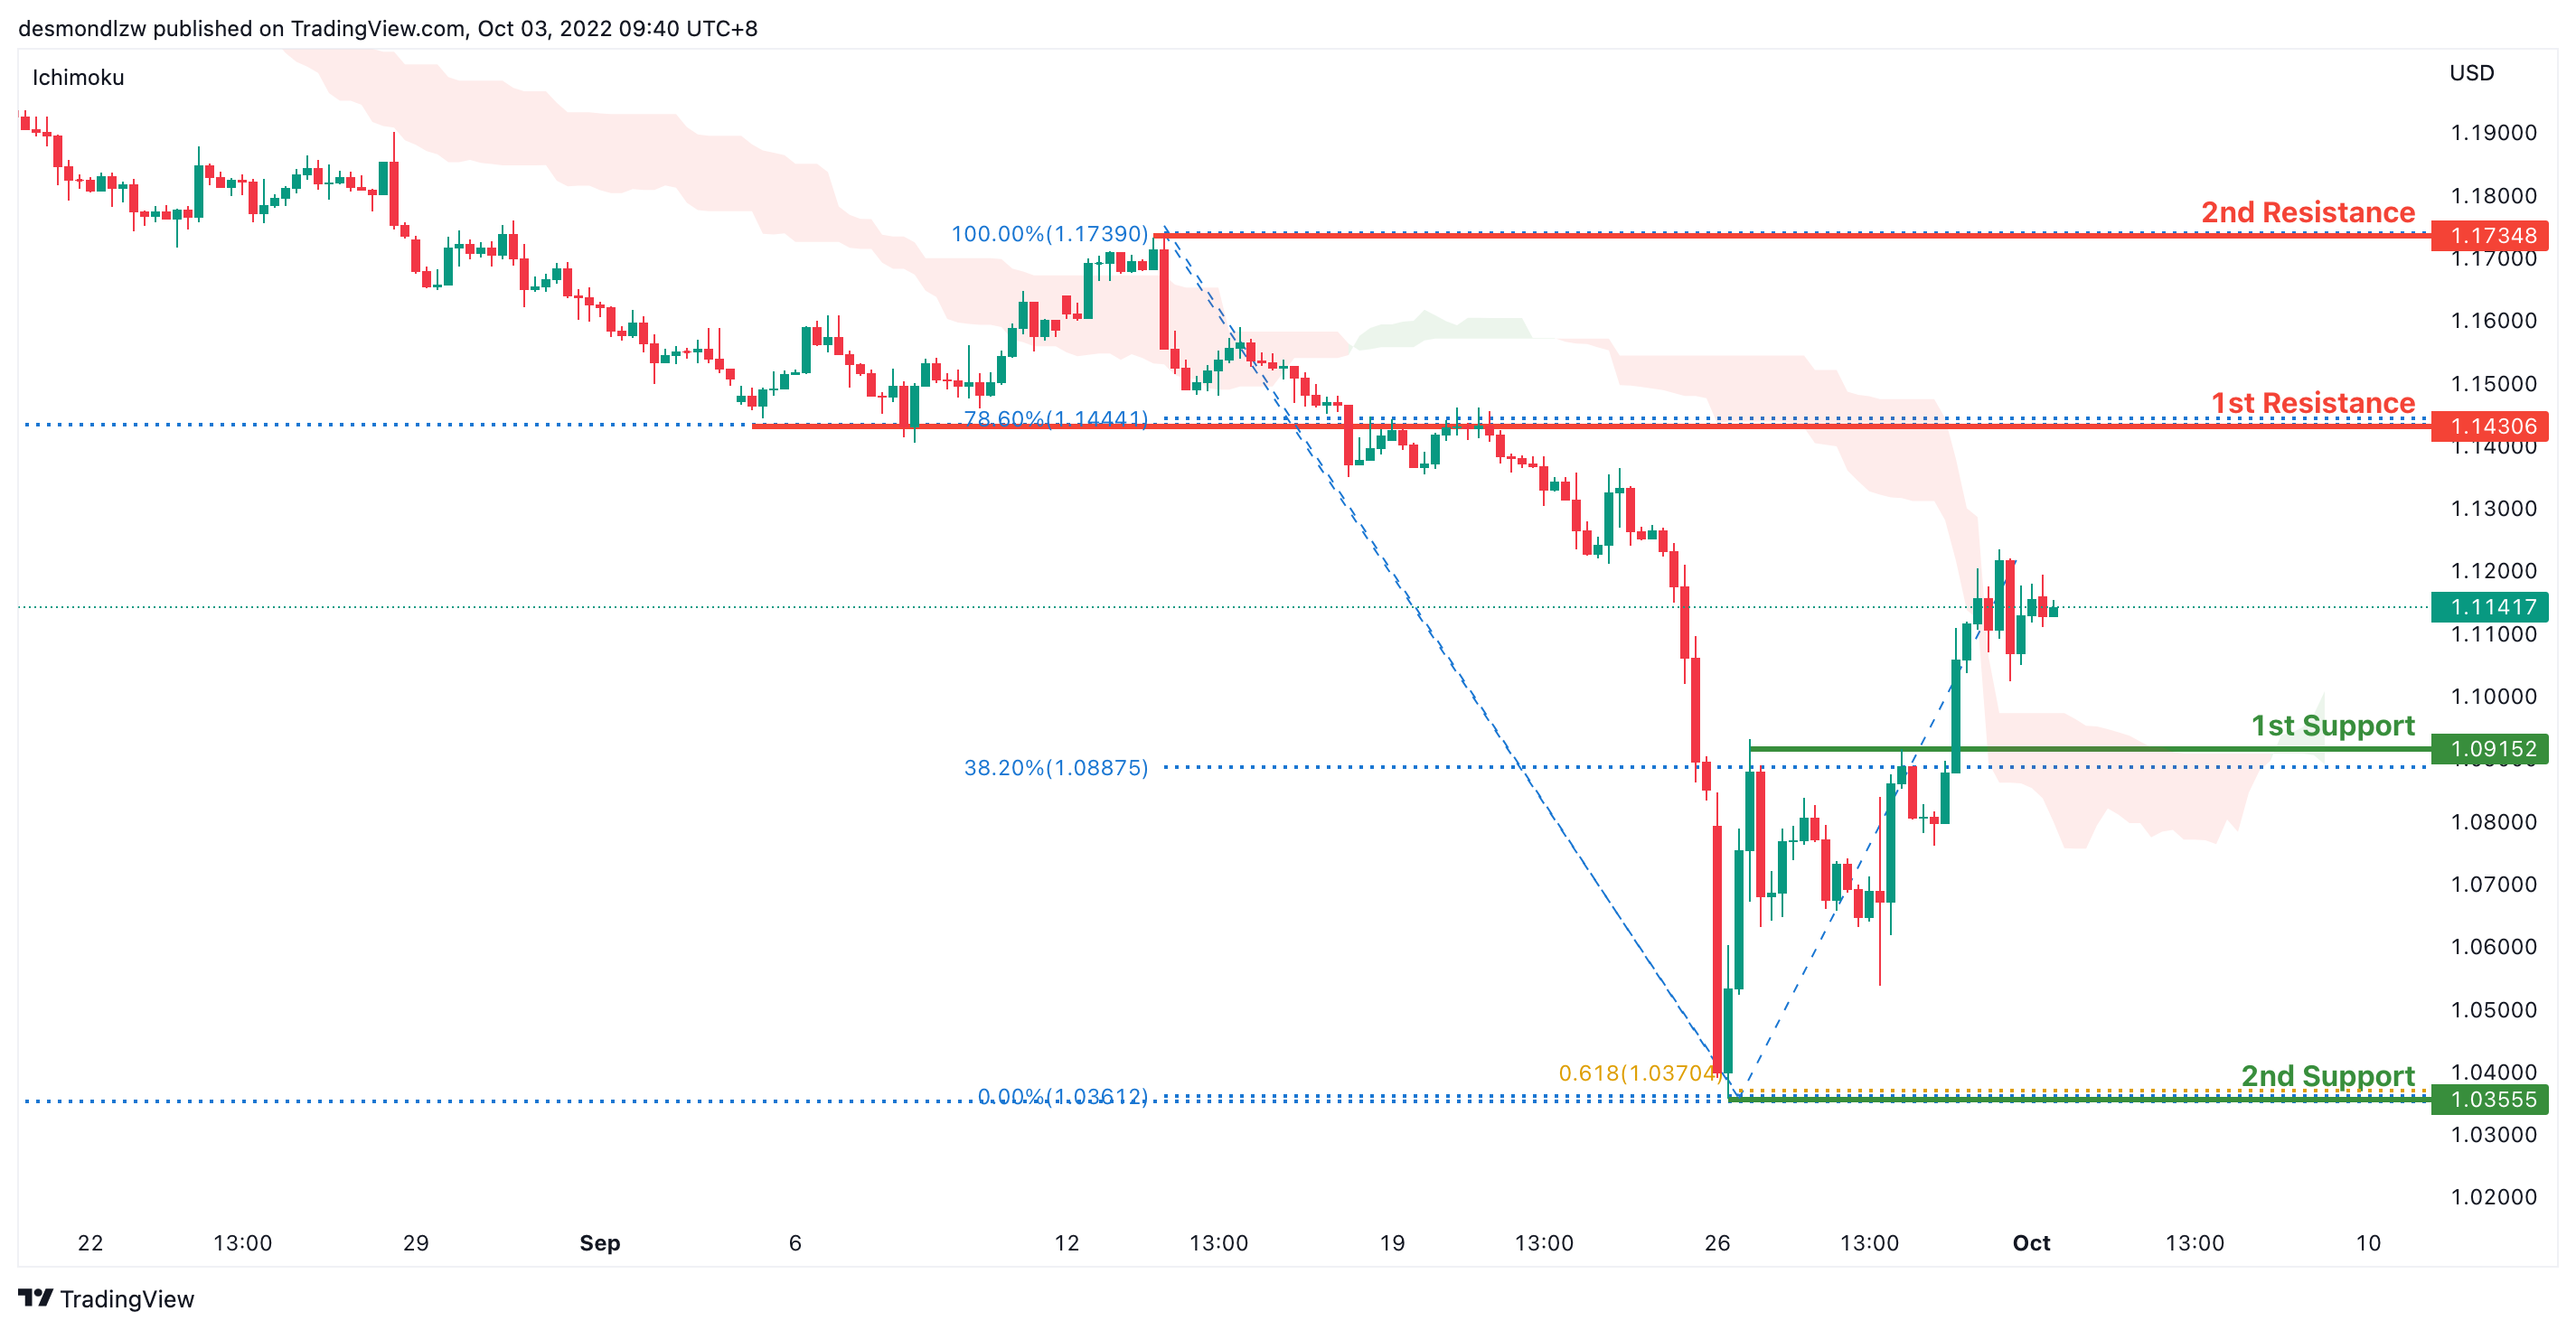
GBP/USD:
On the H4 time frame, prices have bounced off the support level and are moving in an ascending manner, we are slightly bullish. Price is moving toward the first resistance at 1.1430 where the 78.6% retracement and overlap support sits. If it breaks this level, its bullish momentum will bring price to second resistance at 1.1734 where the previous swing high sits. Alternatively, price could pull back to test the first support at 1.0915 where the 38.2% retracement sits then the second support at 1.0355 where the previous swing low and 138.2% extension and 61.8% projection sits
Areas of consideration:
- H4 1st resistance at 1.1430
- H4 1st support at 1.0915
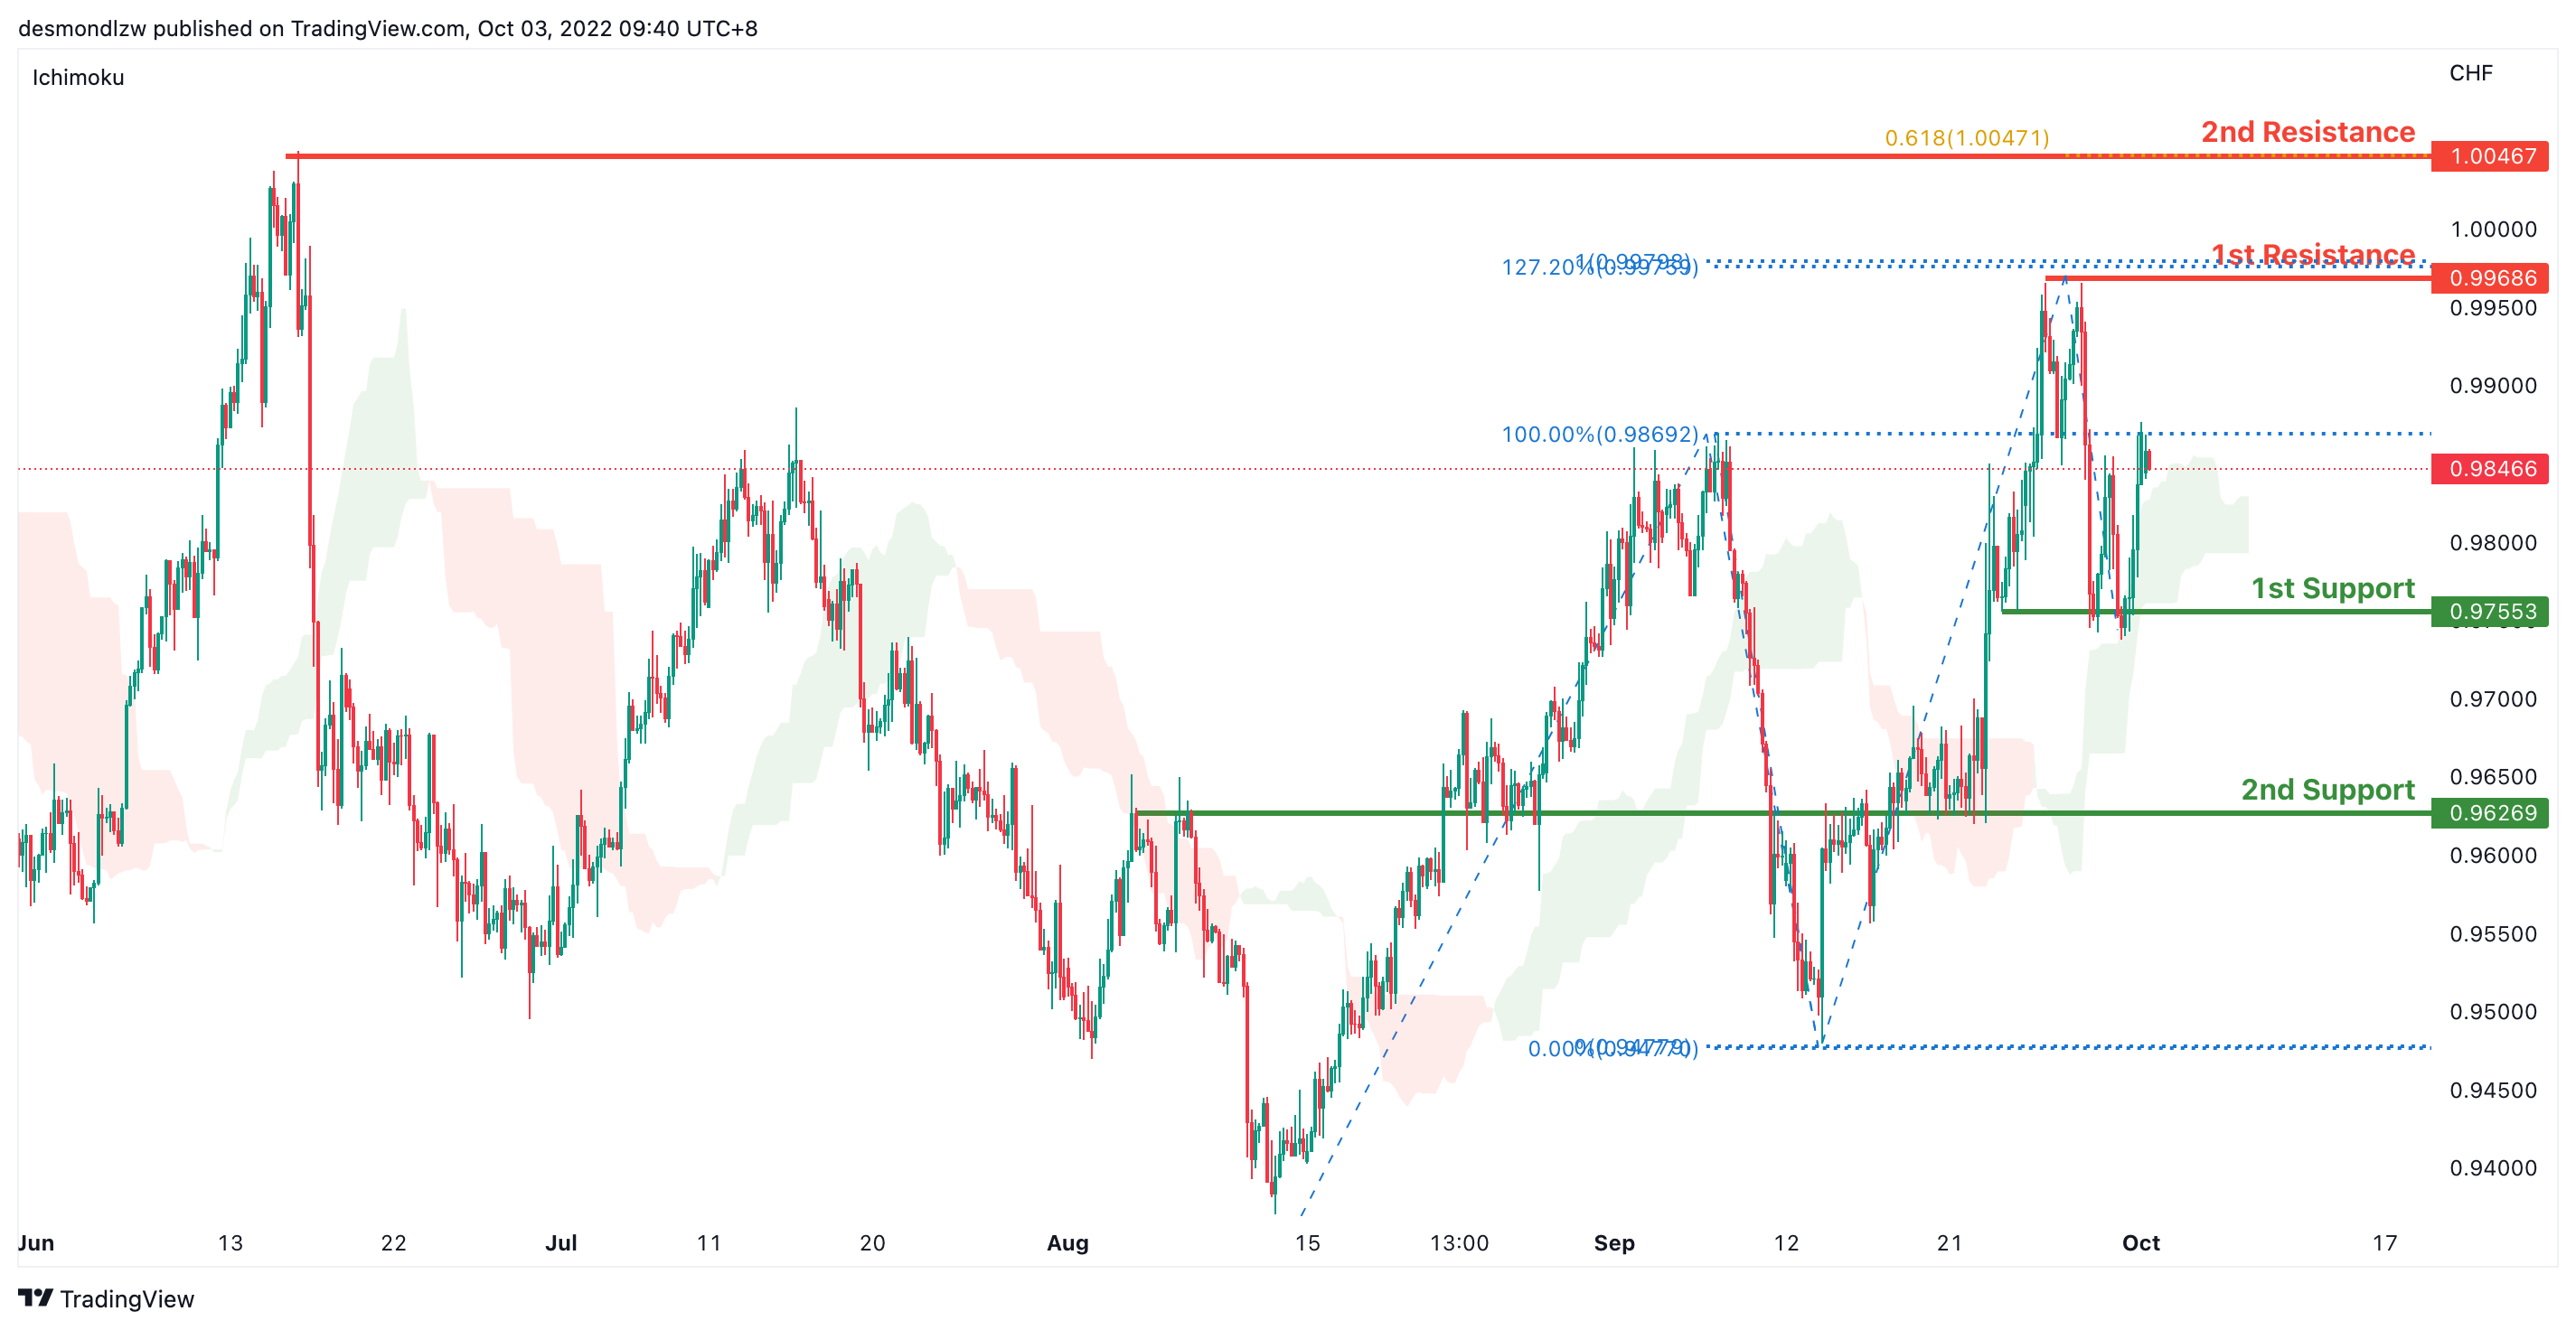
USD/CHF:
On the H4, prices are above the ichimoku and in an ascending trend we are bullish bias. Price has rejected the support twice and it’s moving toward the first resistance at 0.9968 where the 100% projection,127.2% extension and swing high sits. If bullish momentum continues, it should bring price to the second resistance at 1.0046 where the 61.8% projection and previous swing high sits. Alternatively, price could pull back to test 0.9755 where the first support sits if it breaks this level, we have a bearish confirmation to bring price further down to the second support at 0.9626 where the key overlap support sits.
Areas of consideration
- H4 1st support at 0.9755
- H4 1st resistance at 0.9968
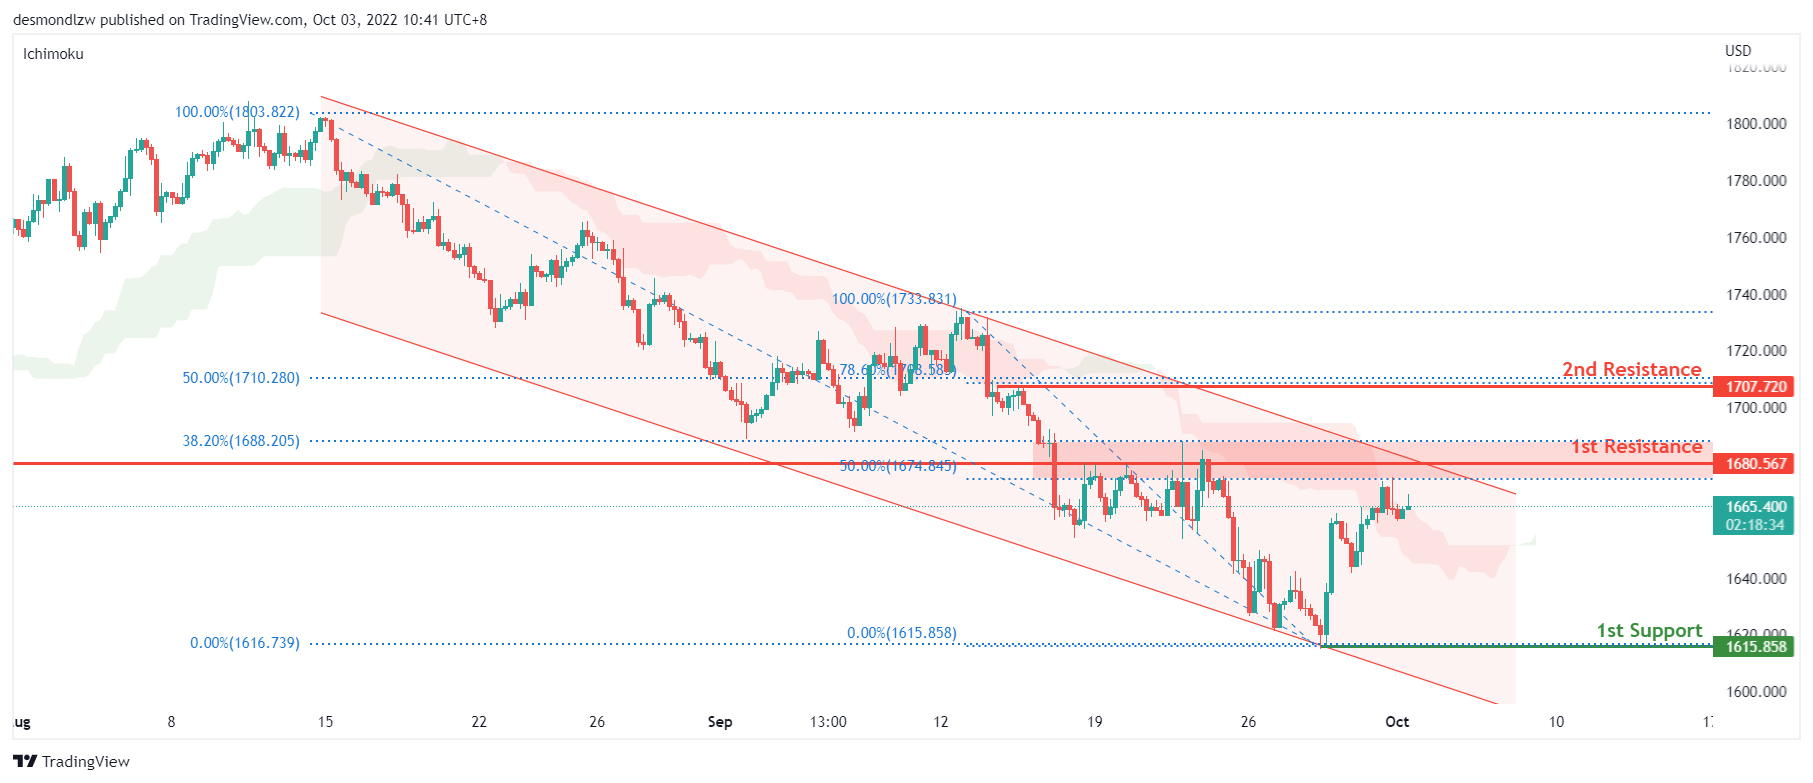
XAU/USD (GOLD):
On the H4, price is showing a rejection of the 1st resistance of 1680, which is inline with the 50% and 38.2% fibonacci retracement level, swing low from July 2022 and within the bearish channel. With price in the ichimoku cloud, we have a neutral bias. However, price may trade lower towards the 1st support of 1615.85 with a risk level at 1640. Alternatively, price could break above the 1st resistance to trade higher towards the 2nd resistance of 1707 which is inline with the 50% and 78.6% fibonacci retracement level.
Areas of consideration:
- H4 time frame, 1st resistance at 1680.56
- H4 time frame, 2nd resistance at 1707.72
- H4 time frame, 1st support at 1615.85
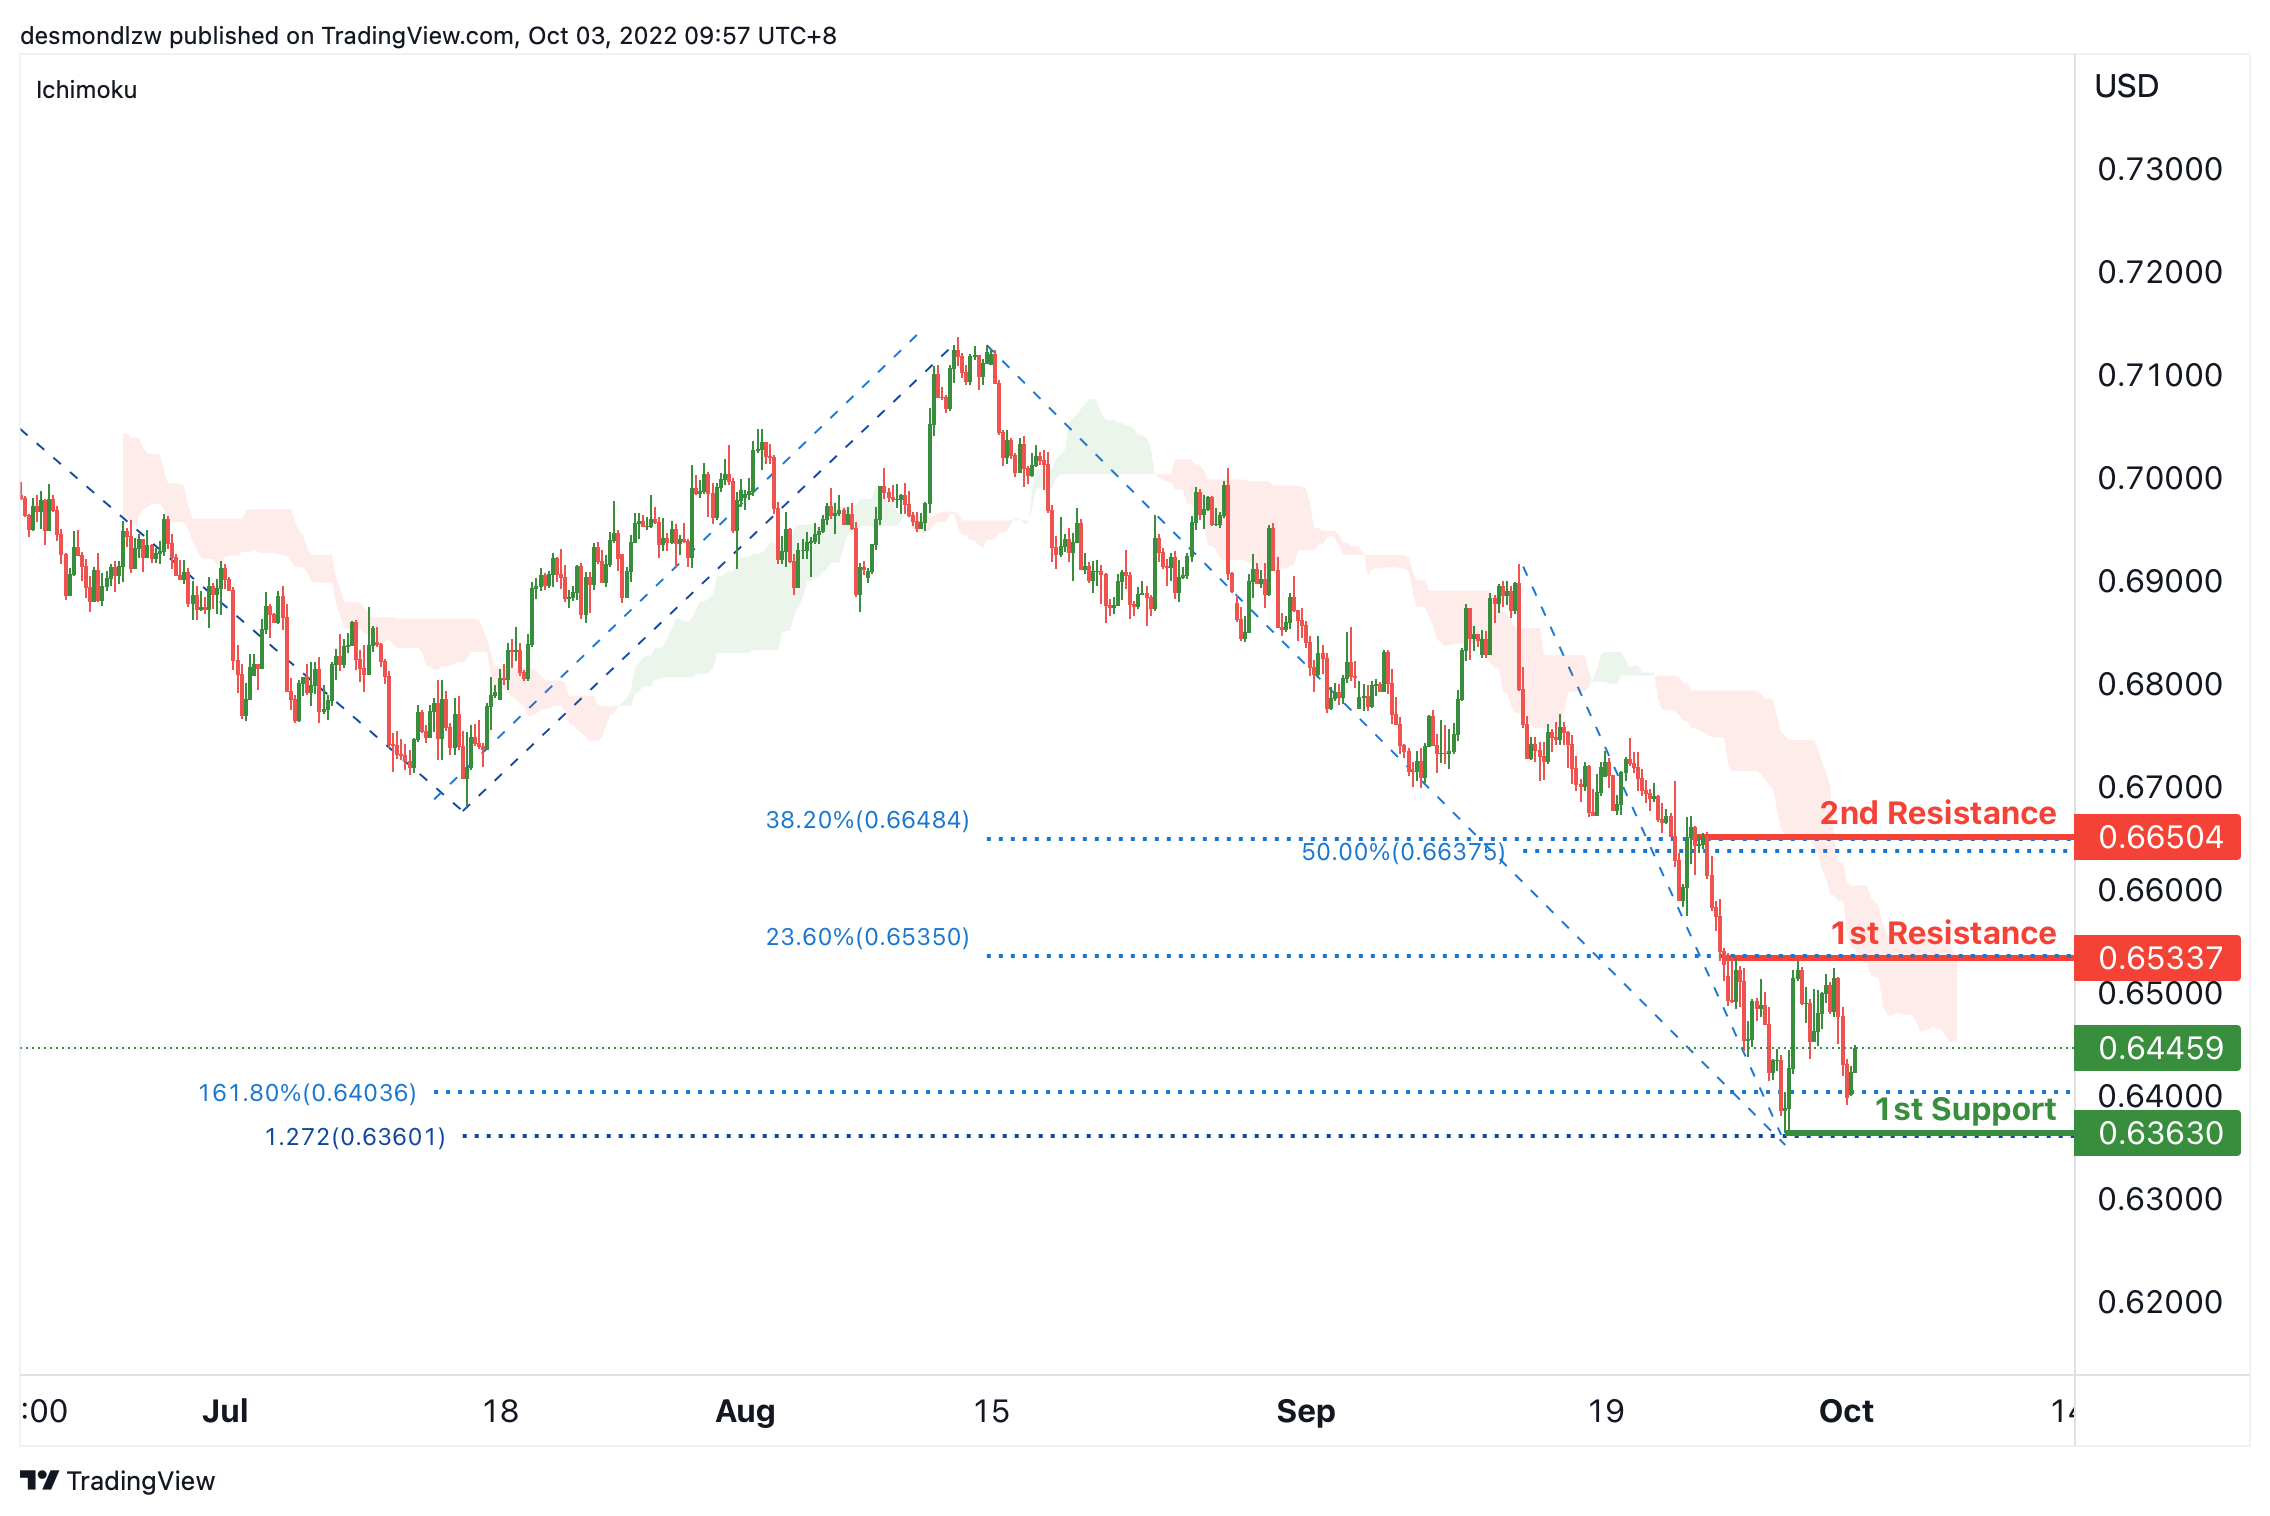
AUD/USD:
On the H4, the price is bouncing from the 1st support, we can expect the price test the 1st resistance at 0.65337, which is in line with the 23.6% fibonacci retracement, if the price can break the 1st resistance, we can expect the price rise to the 2nd resistance at 0.66504, where the pullback resistance, 50% and 38.2% fibonacci retracement are. Alternatively, as the price is still below ichimoku cloud, the price may drop to the 1st support again at 0.63630, which is in line with the swing low, 161.8% fibonacci extension and 127.2% fibonacci projection.
Areas of consideration
- H4, 1st resistance at 0.65337
- H4, 1st support at 0.63630
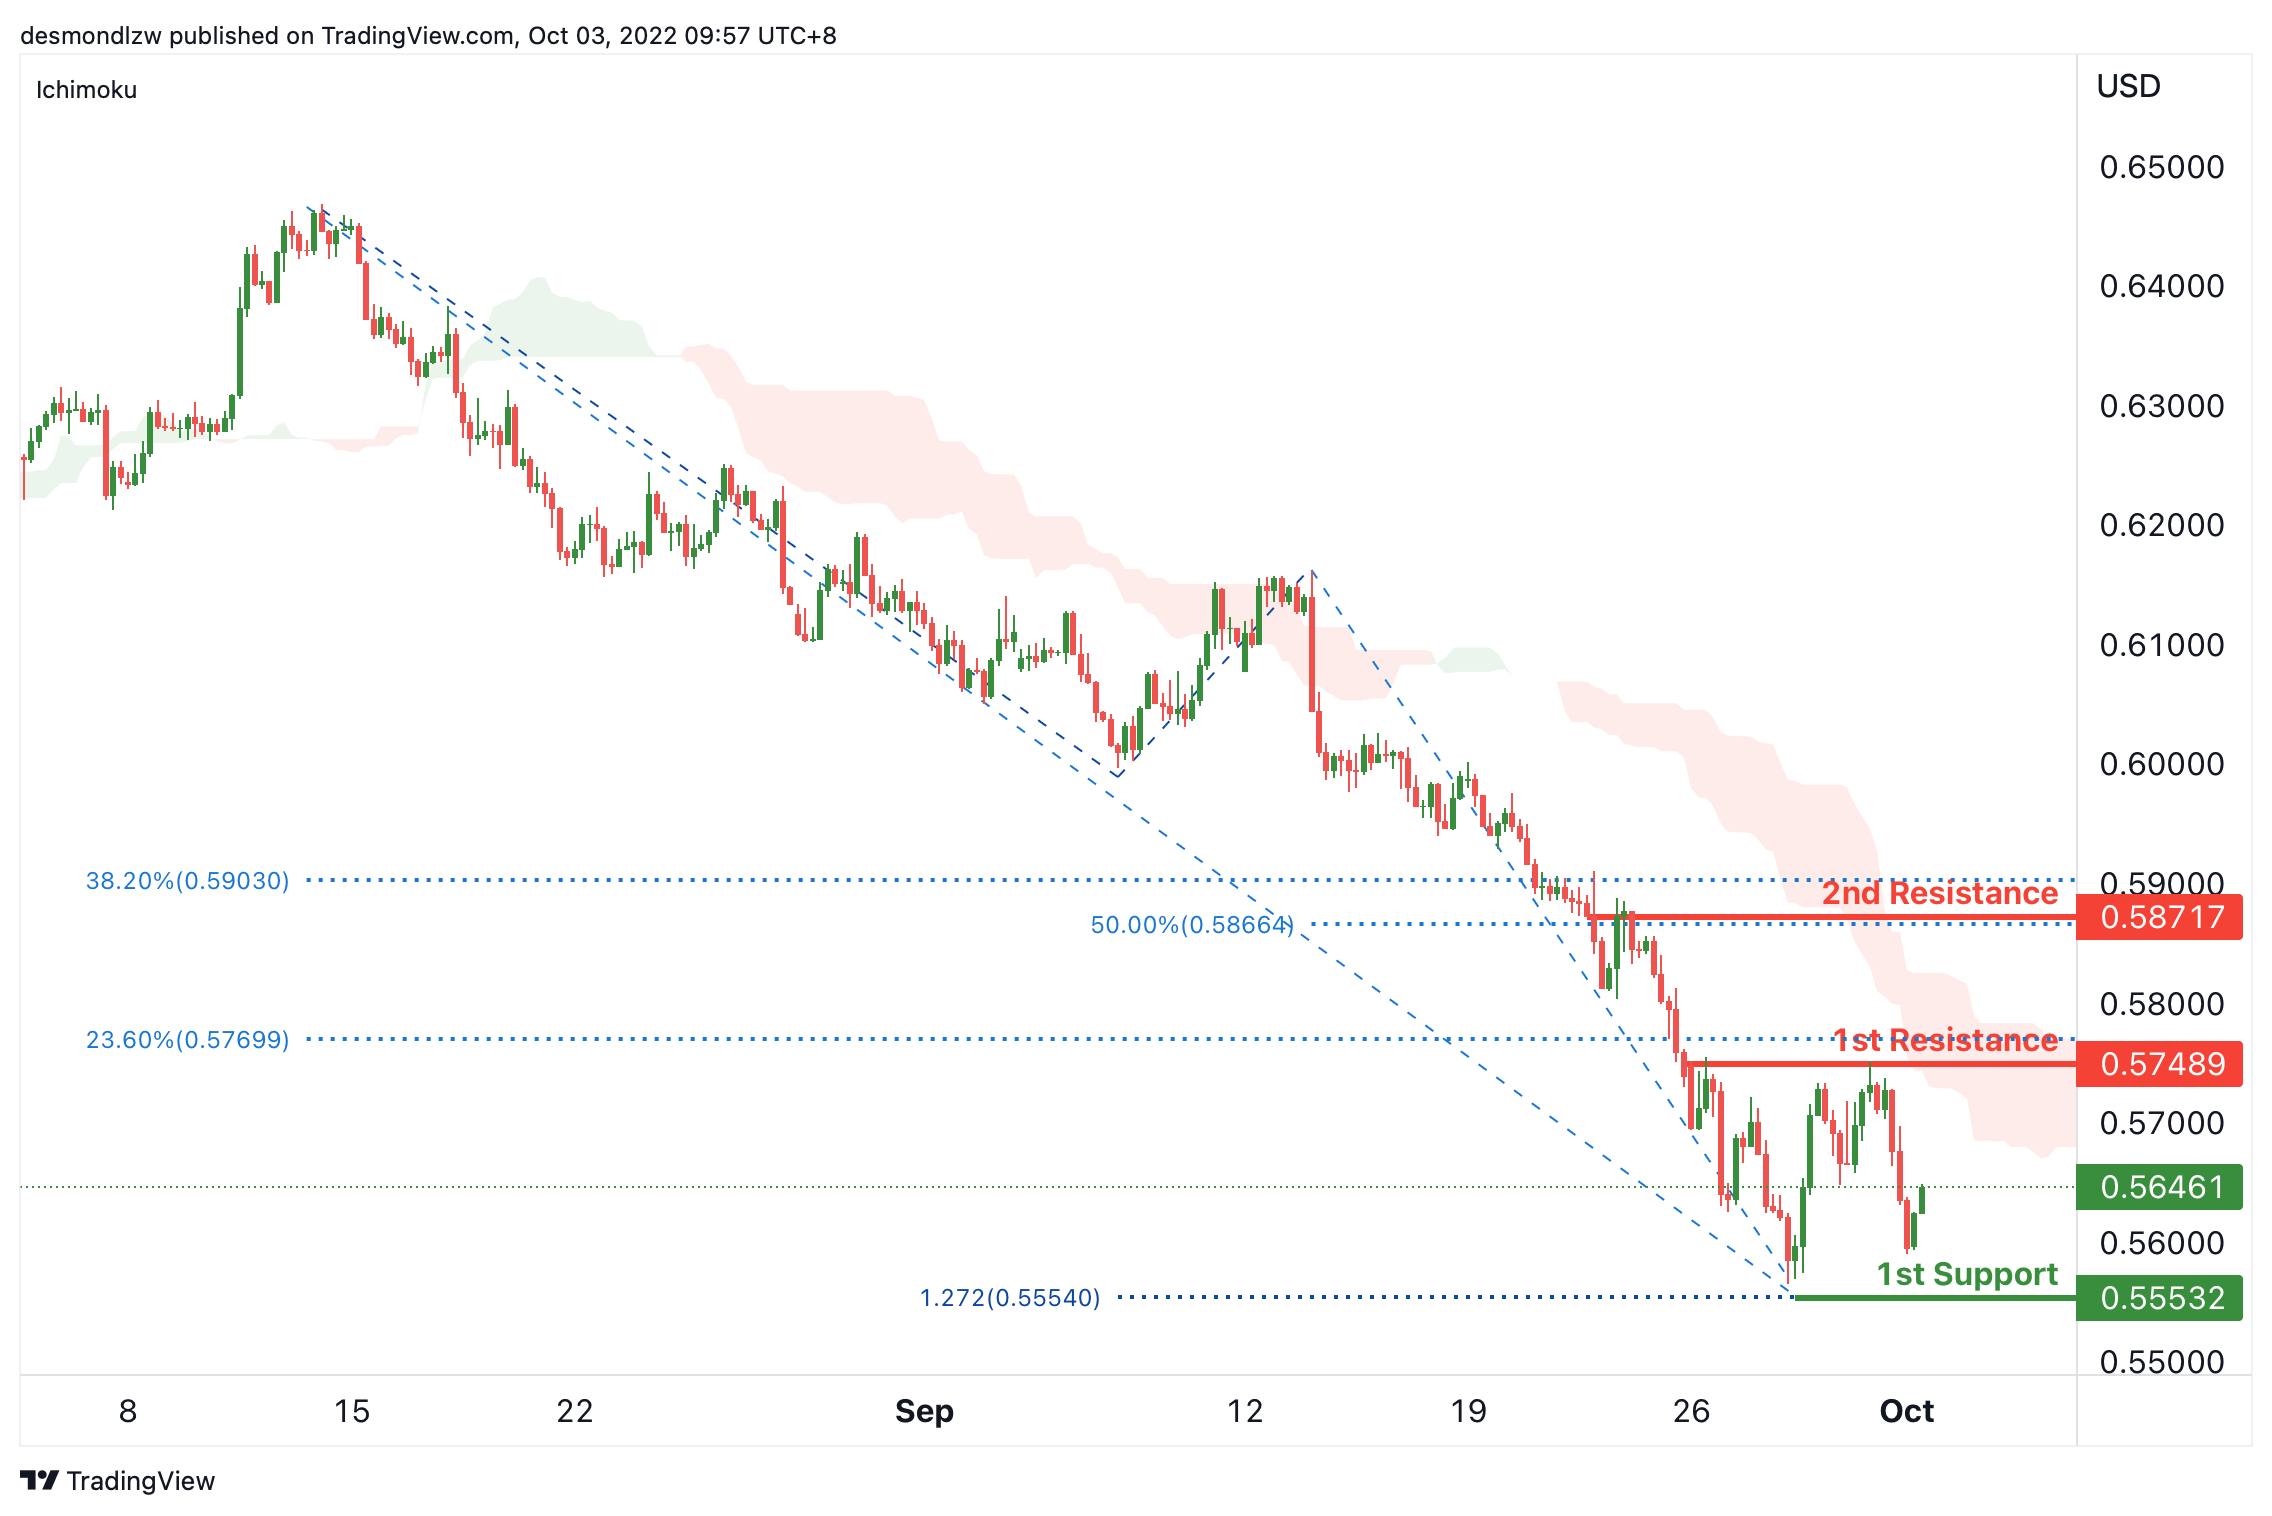
NZD/USD:
On the H4, with the price bouncing from the 1st support, we can expect the price test the 1st resistance at 0.57489, which is in line with the 23.6% fibonacci retracement, if the 1st resistance is broken, the price may break the 1st resistance and rise to the 2nd resistance at 0.58717, where the 38.2% and 50% fibonacci retracement are. Alternatively, the price may drop to the 1st support at 0.55532, where the swing low and 127.2% fibonacci projection are.
Areas of consideration:
- H4 time frame, 1st resistance at 0.57489
- H4 time frame, 1st support at 0.55532
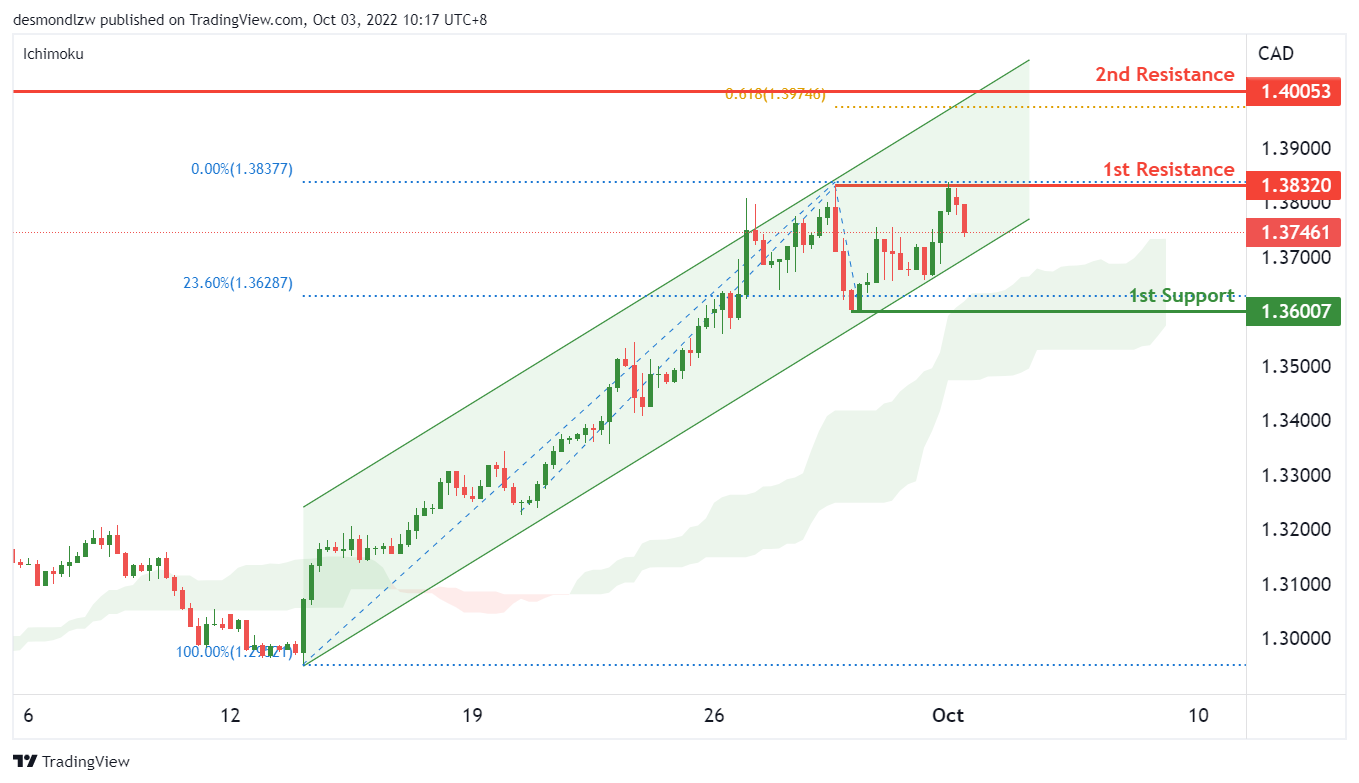
USD/CAD:
On the H4, the price fails to break above the 1st resistance of 1.3832 but maintains within the ascending channel and above the ichimoku cloud. We continue to have a bullish bias that price may rise to the 2nd resistance at 1.40, which is in line with the 61.8% fibonacci extension level and previous swing high from June 2020. However, price could first fall to test the 23.6% fibonacci retracement level before a continuation to the upside.
Areas of consideration:
- H4 time frame, 1st resistance at 1.3832
- H4 time frame, 2nd resistance at 1.40
- H4 time frame, 1st support at 1.36
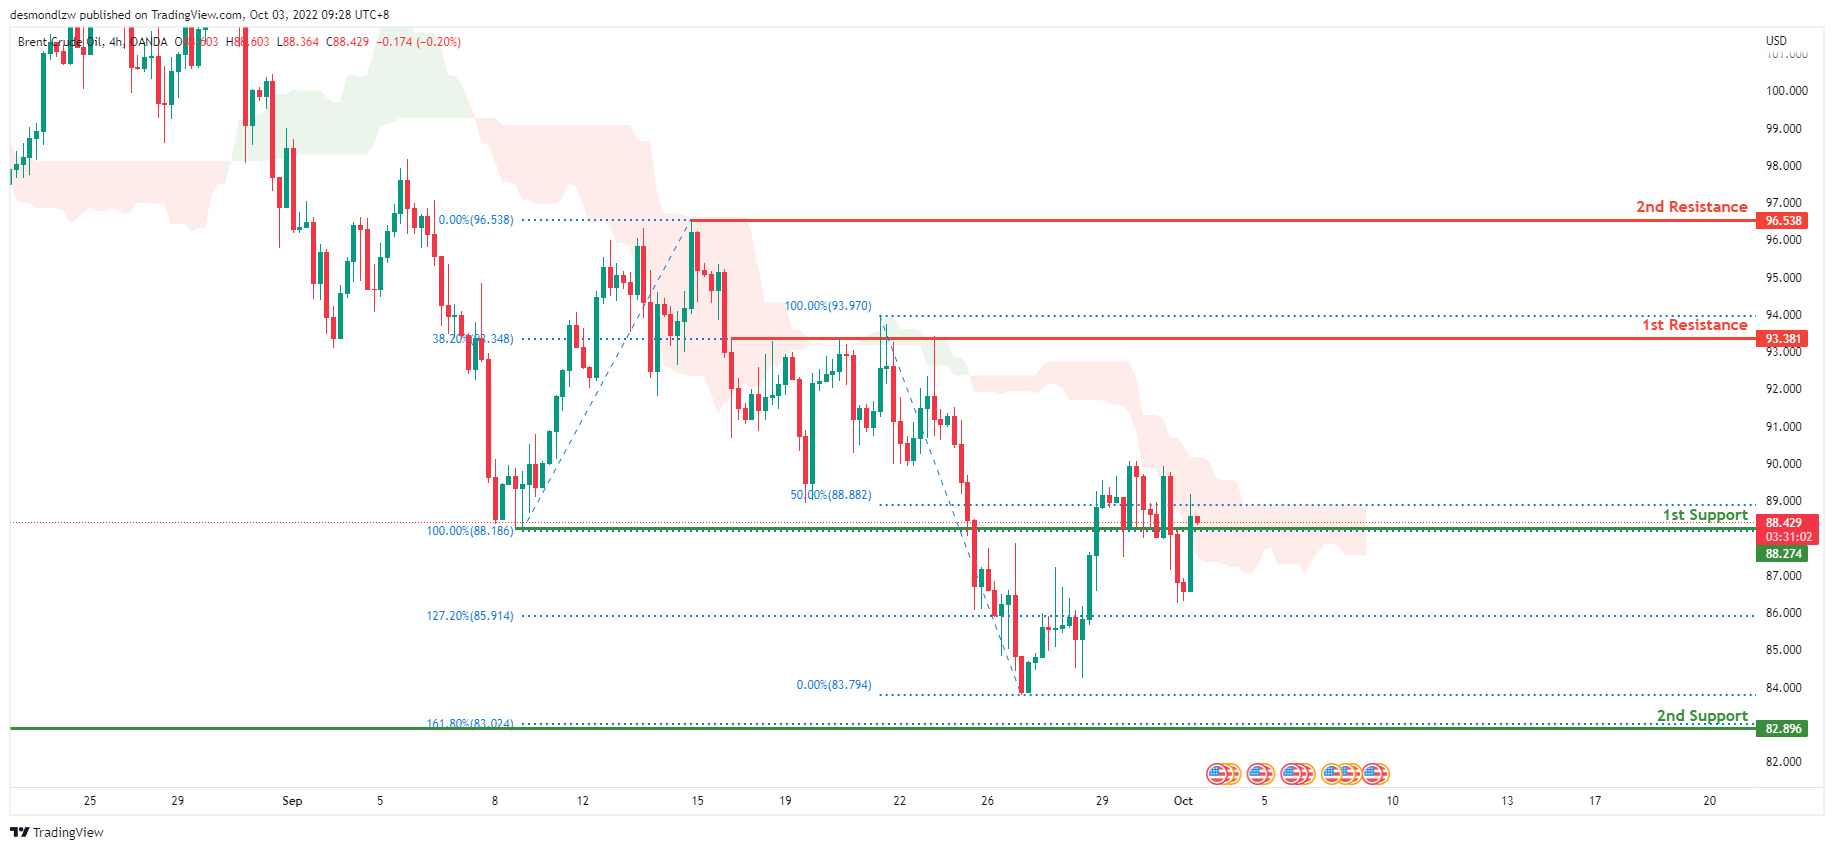
OIL:
On the 4-hour chart, oil is in a bearish trend. Price is currently consolidating near the first support level at 88.788, which has a 100% Fibonacci extension and served as the previous swing low. Price has rejected and broken back up this level several times in the last week, indicating that it is a strong level. Price is expected to move towards the first resistance level, which is the 38.2% Fibonacci extension line, at 93.381.
Areas of consideration:
- H4 time frame, 1st resistance at 93.381
- H4 time frame, 1st support at 88.366
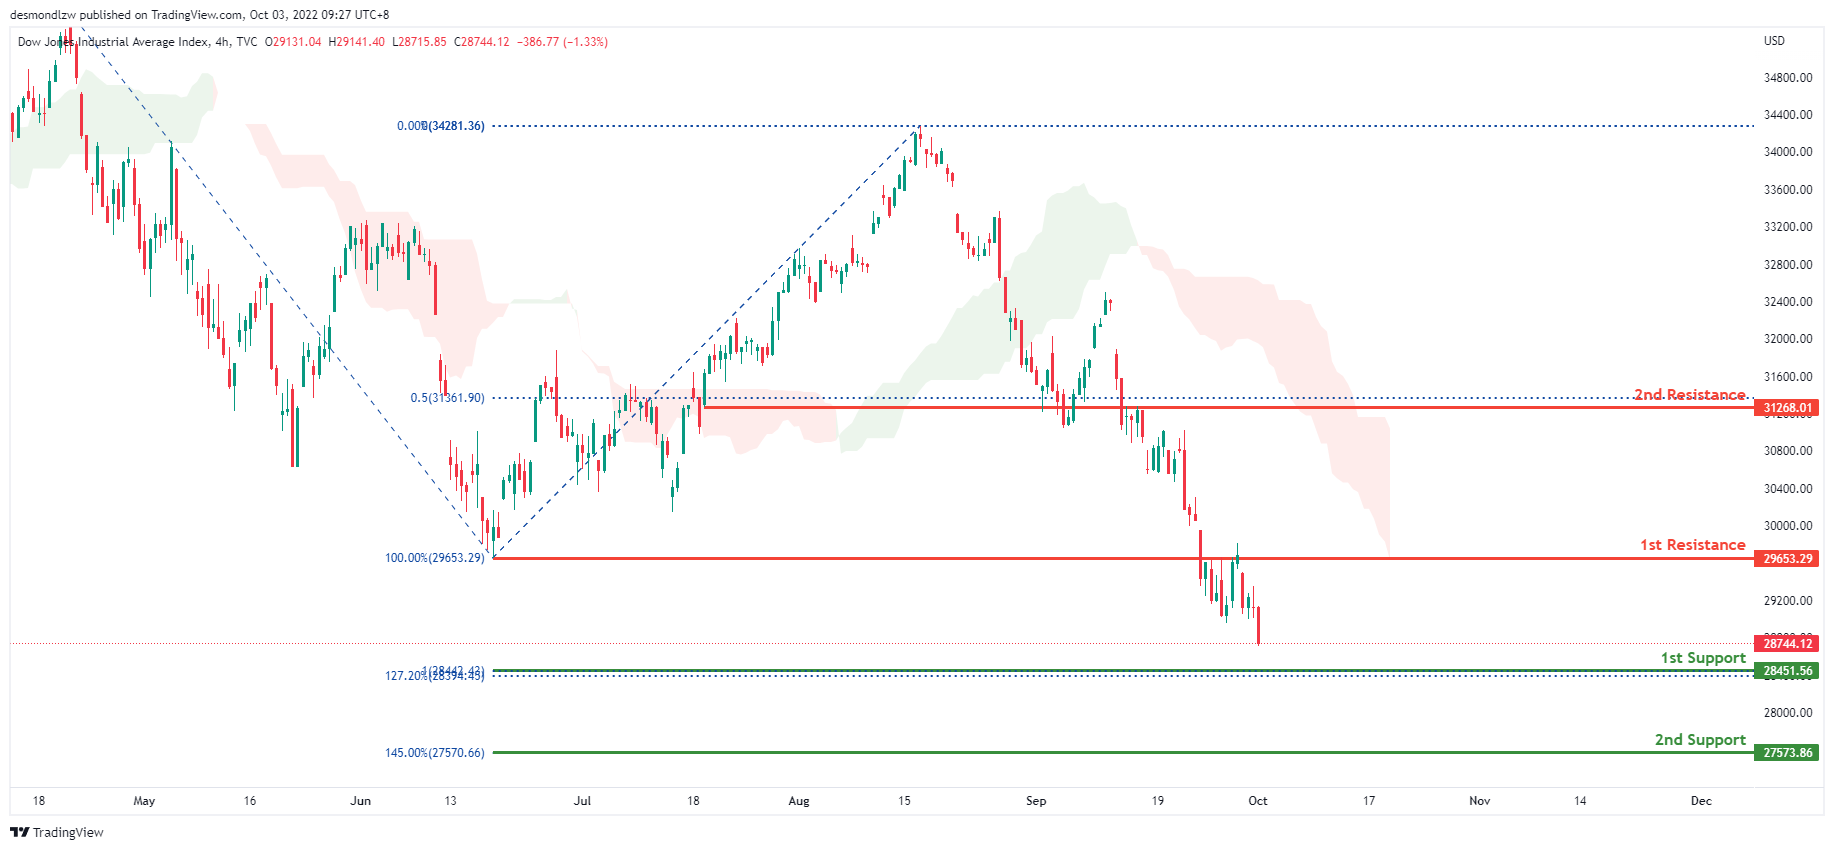
Dow Jones Industrial Average:
The price is in a bearish trend on the H4. Furthermore, the price is lower than the ichimoku cloud, indicating a bearish market. Price has also broken through the first resistance level, which contains the 100% Fibonacci line and the previous swing low, at 29653.29. Given the current bearish momentum, price is expected to move towards the first support level at 28422.42, which contains the 100% Fibonacci projection line and the 127.2% Fibonacci extension line.
Areas of consideration:
- H4 time frame, 1st support at 28408.73
- H4 time frame, 1st resistance at 29653.29
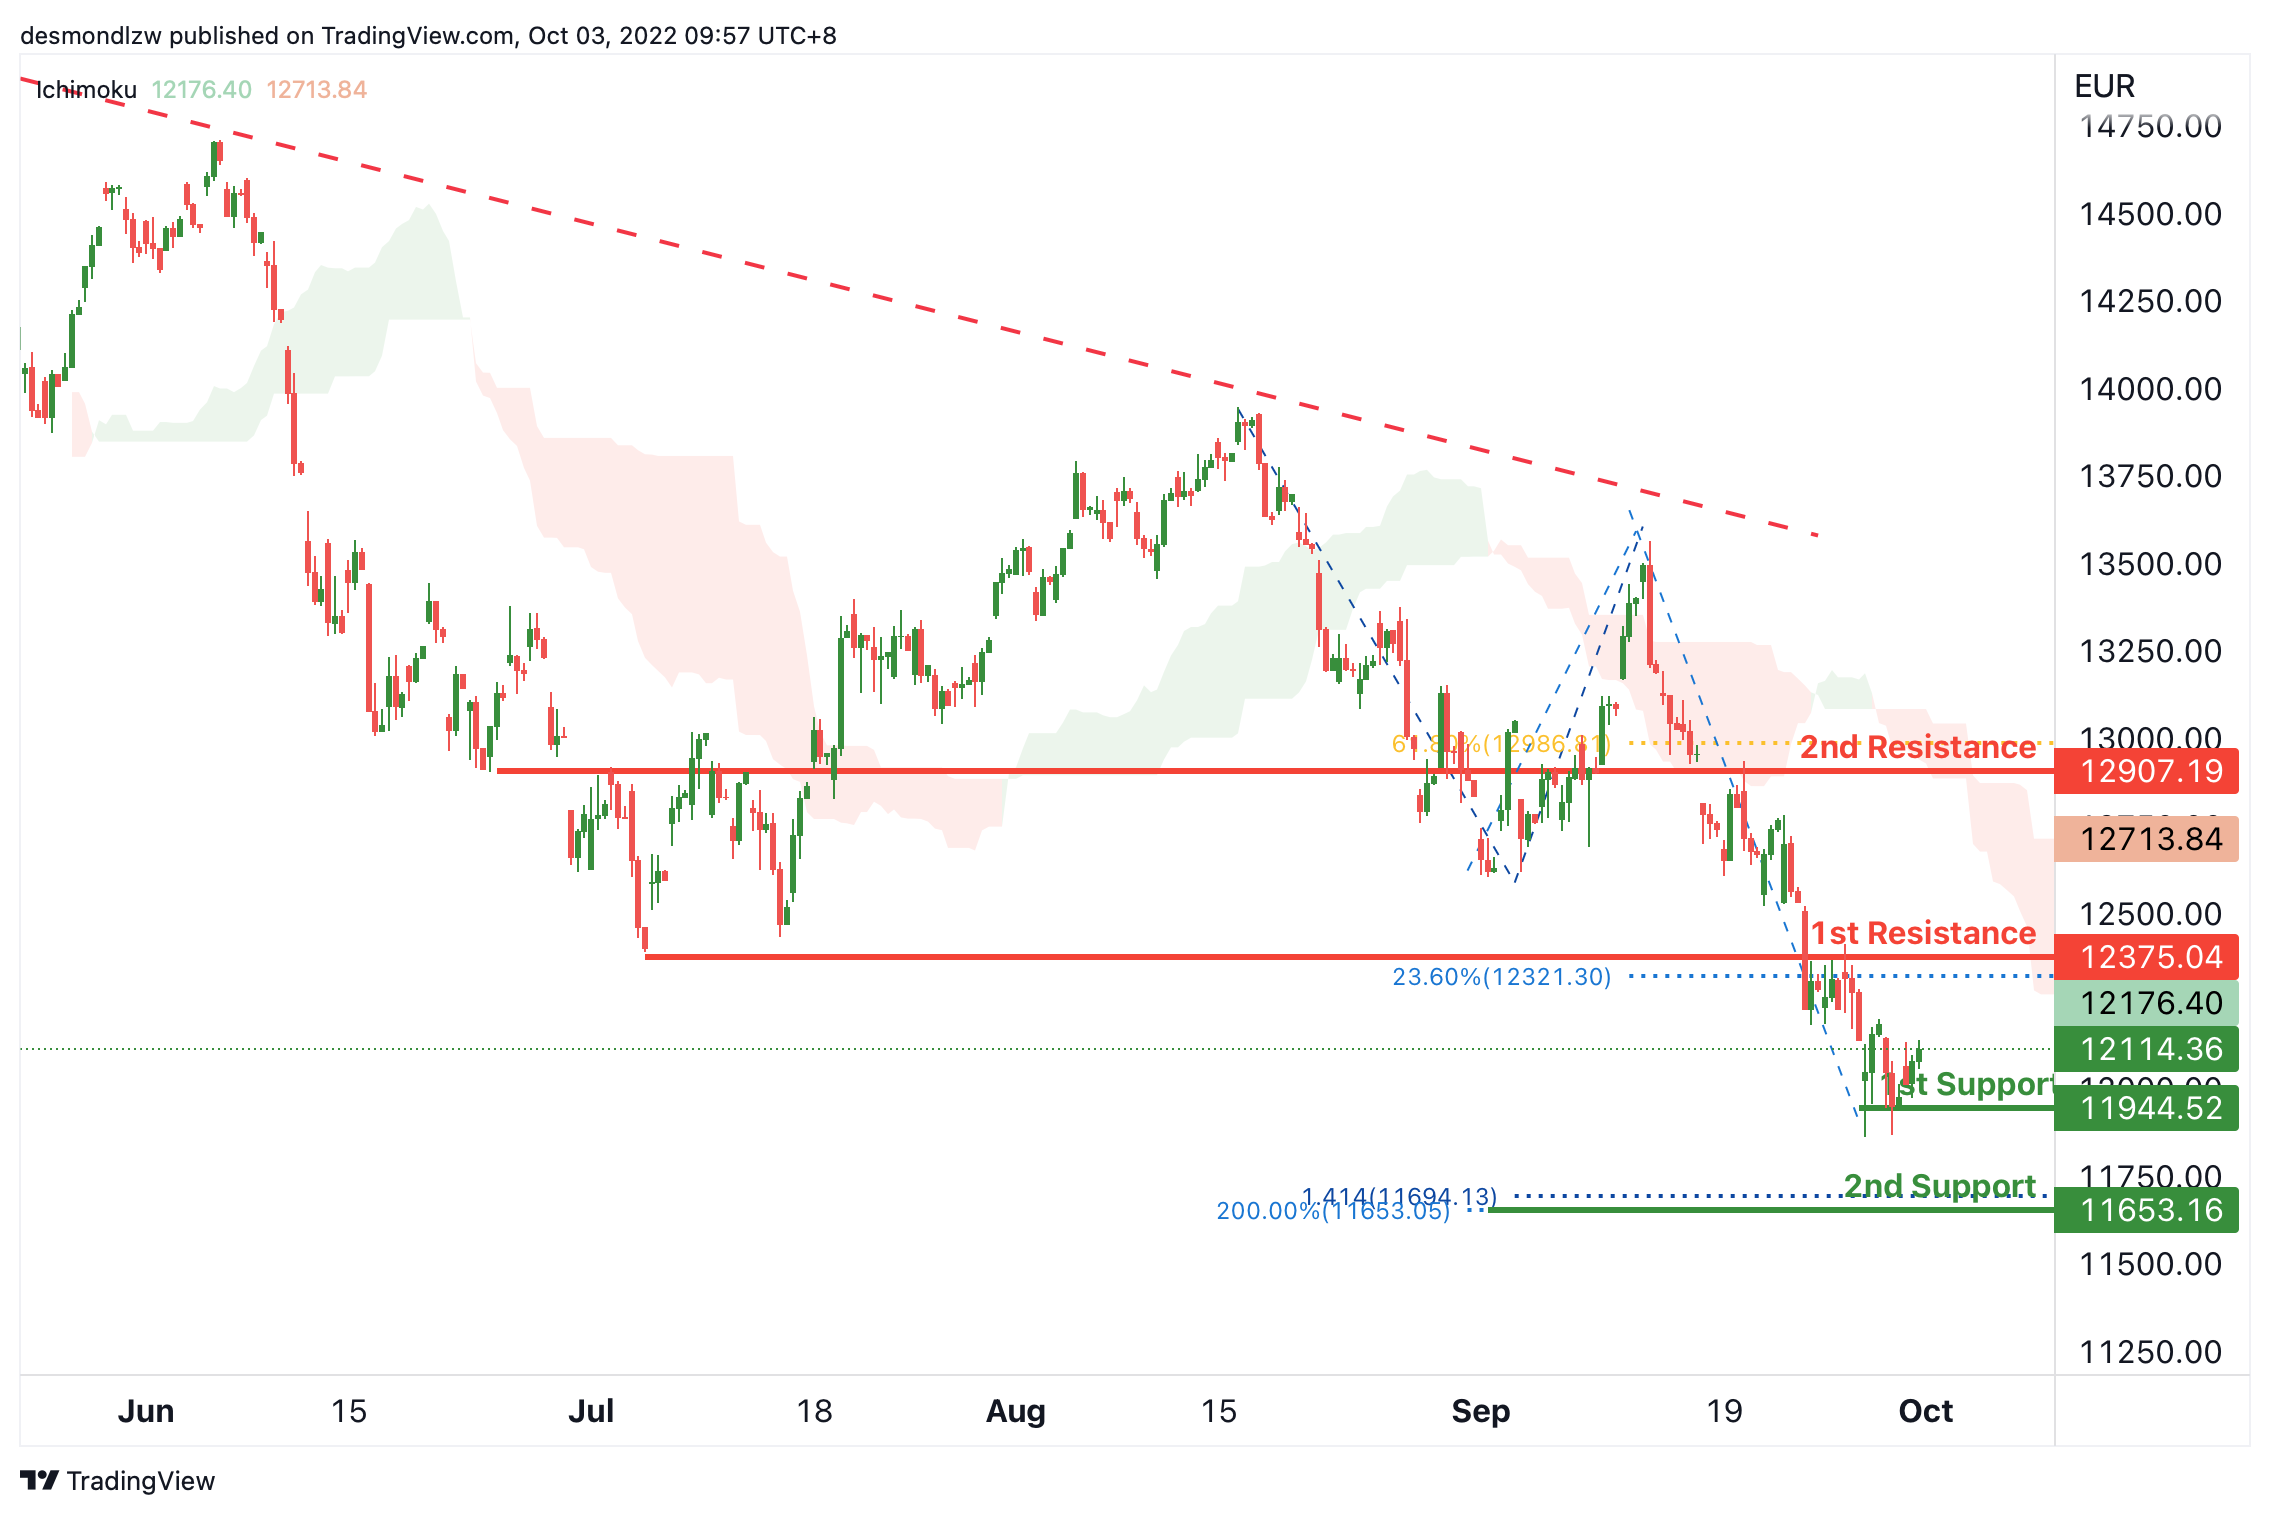
DAX:
On the H4, with the price bouncing from the 1st support at 11944.52, the price may test the 1st resistance at 12375.04, which is in line with the overlap resistance and 23.6% fibonacci retracement. If the 1st resistance is broken, the price may rise to the 2nd resistance at 12907.19, where the 61.8% fibonacci retracement is. Alternatively, the price may break the 1st support and drop to the 2nd support at 11653.16, where where the 141.4% fibonacci projection and 200% fibonacci projection are.
Areas of consideration:
- H4 time frame, 1st resistance at 12375.04
- H4 time frame, 1st support at 11944.5
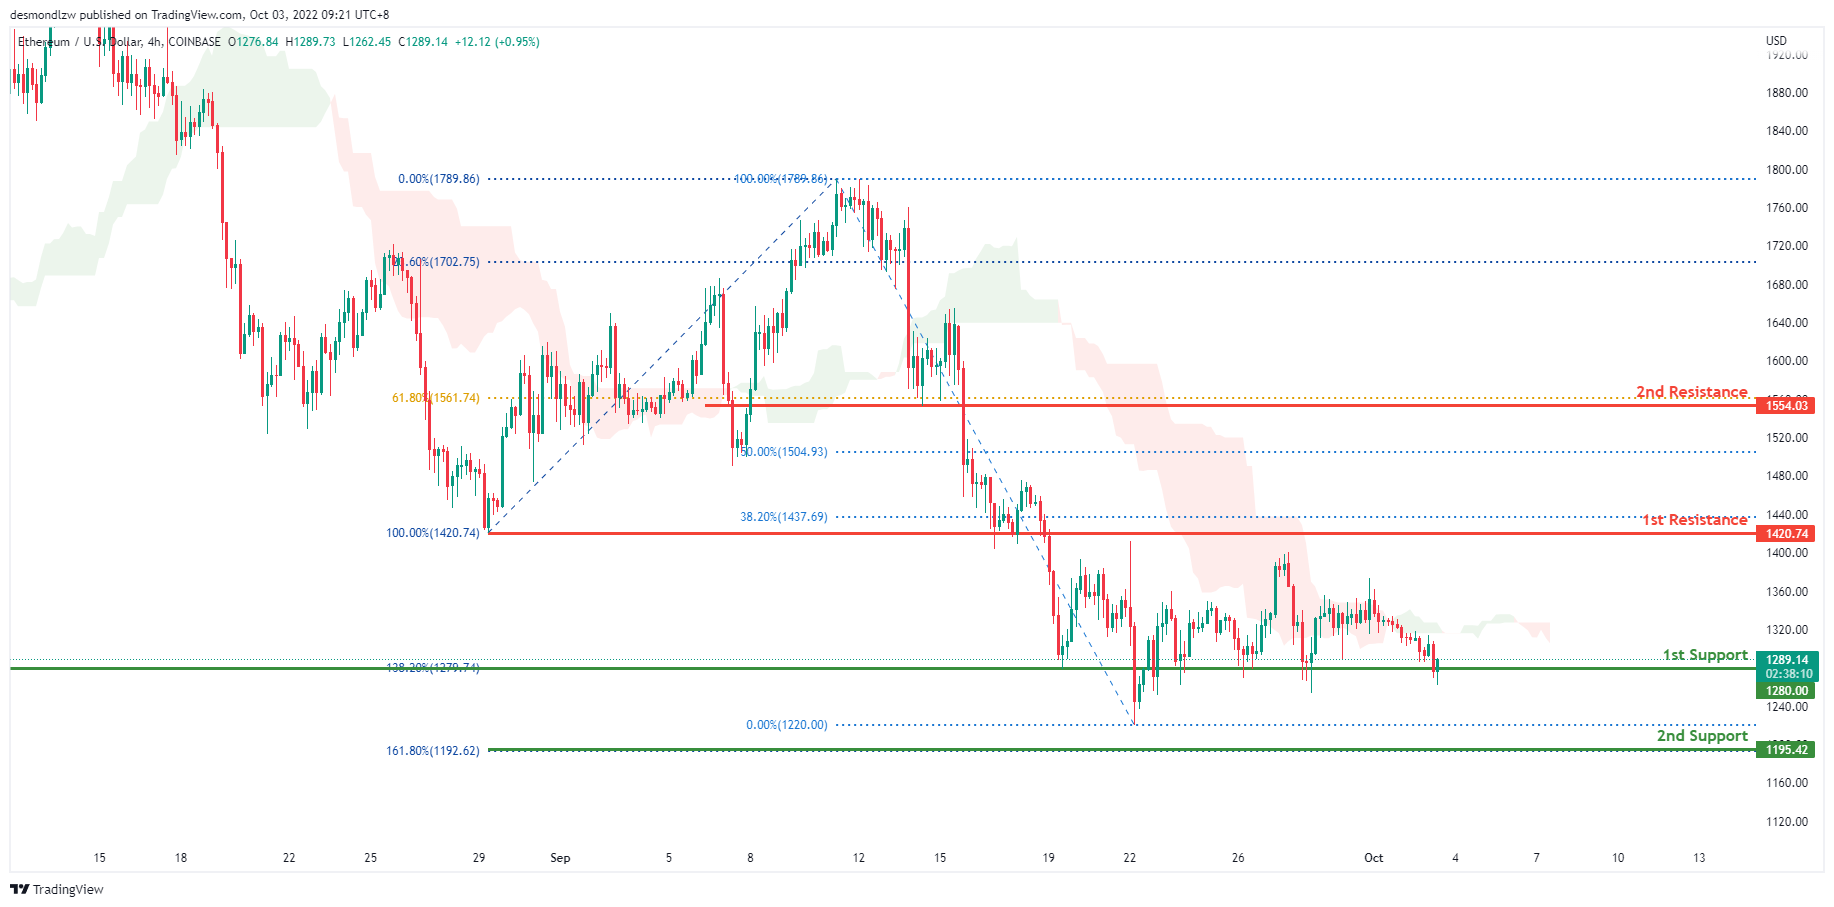
ETHUSD:
The overall price of ETHUSD on the H4 is very bearish. In addition, the price is below the ichimoku cloud, indicating a bear market. For the past two weeks, price has been consolidating above the first support line at 1270.74, which also happens to be the 138.2% Fibonacci line. Expect price to break through this support level and head towards the second support level at 1192.62, which contains the 161.8% Fibonacci extension line.
Areas of consideration:
- H4 time frame, 1st resistance of 1420.74
- H4 time frame, 1st support at 1280.00
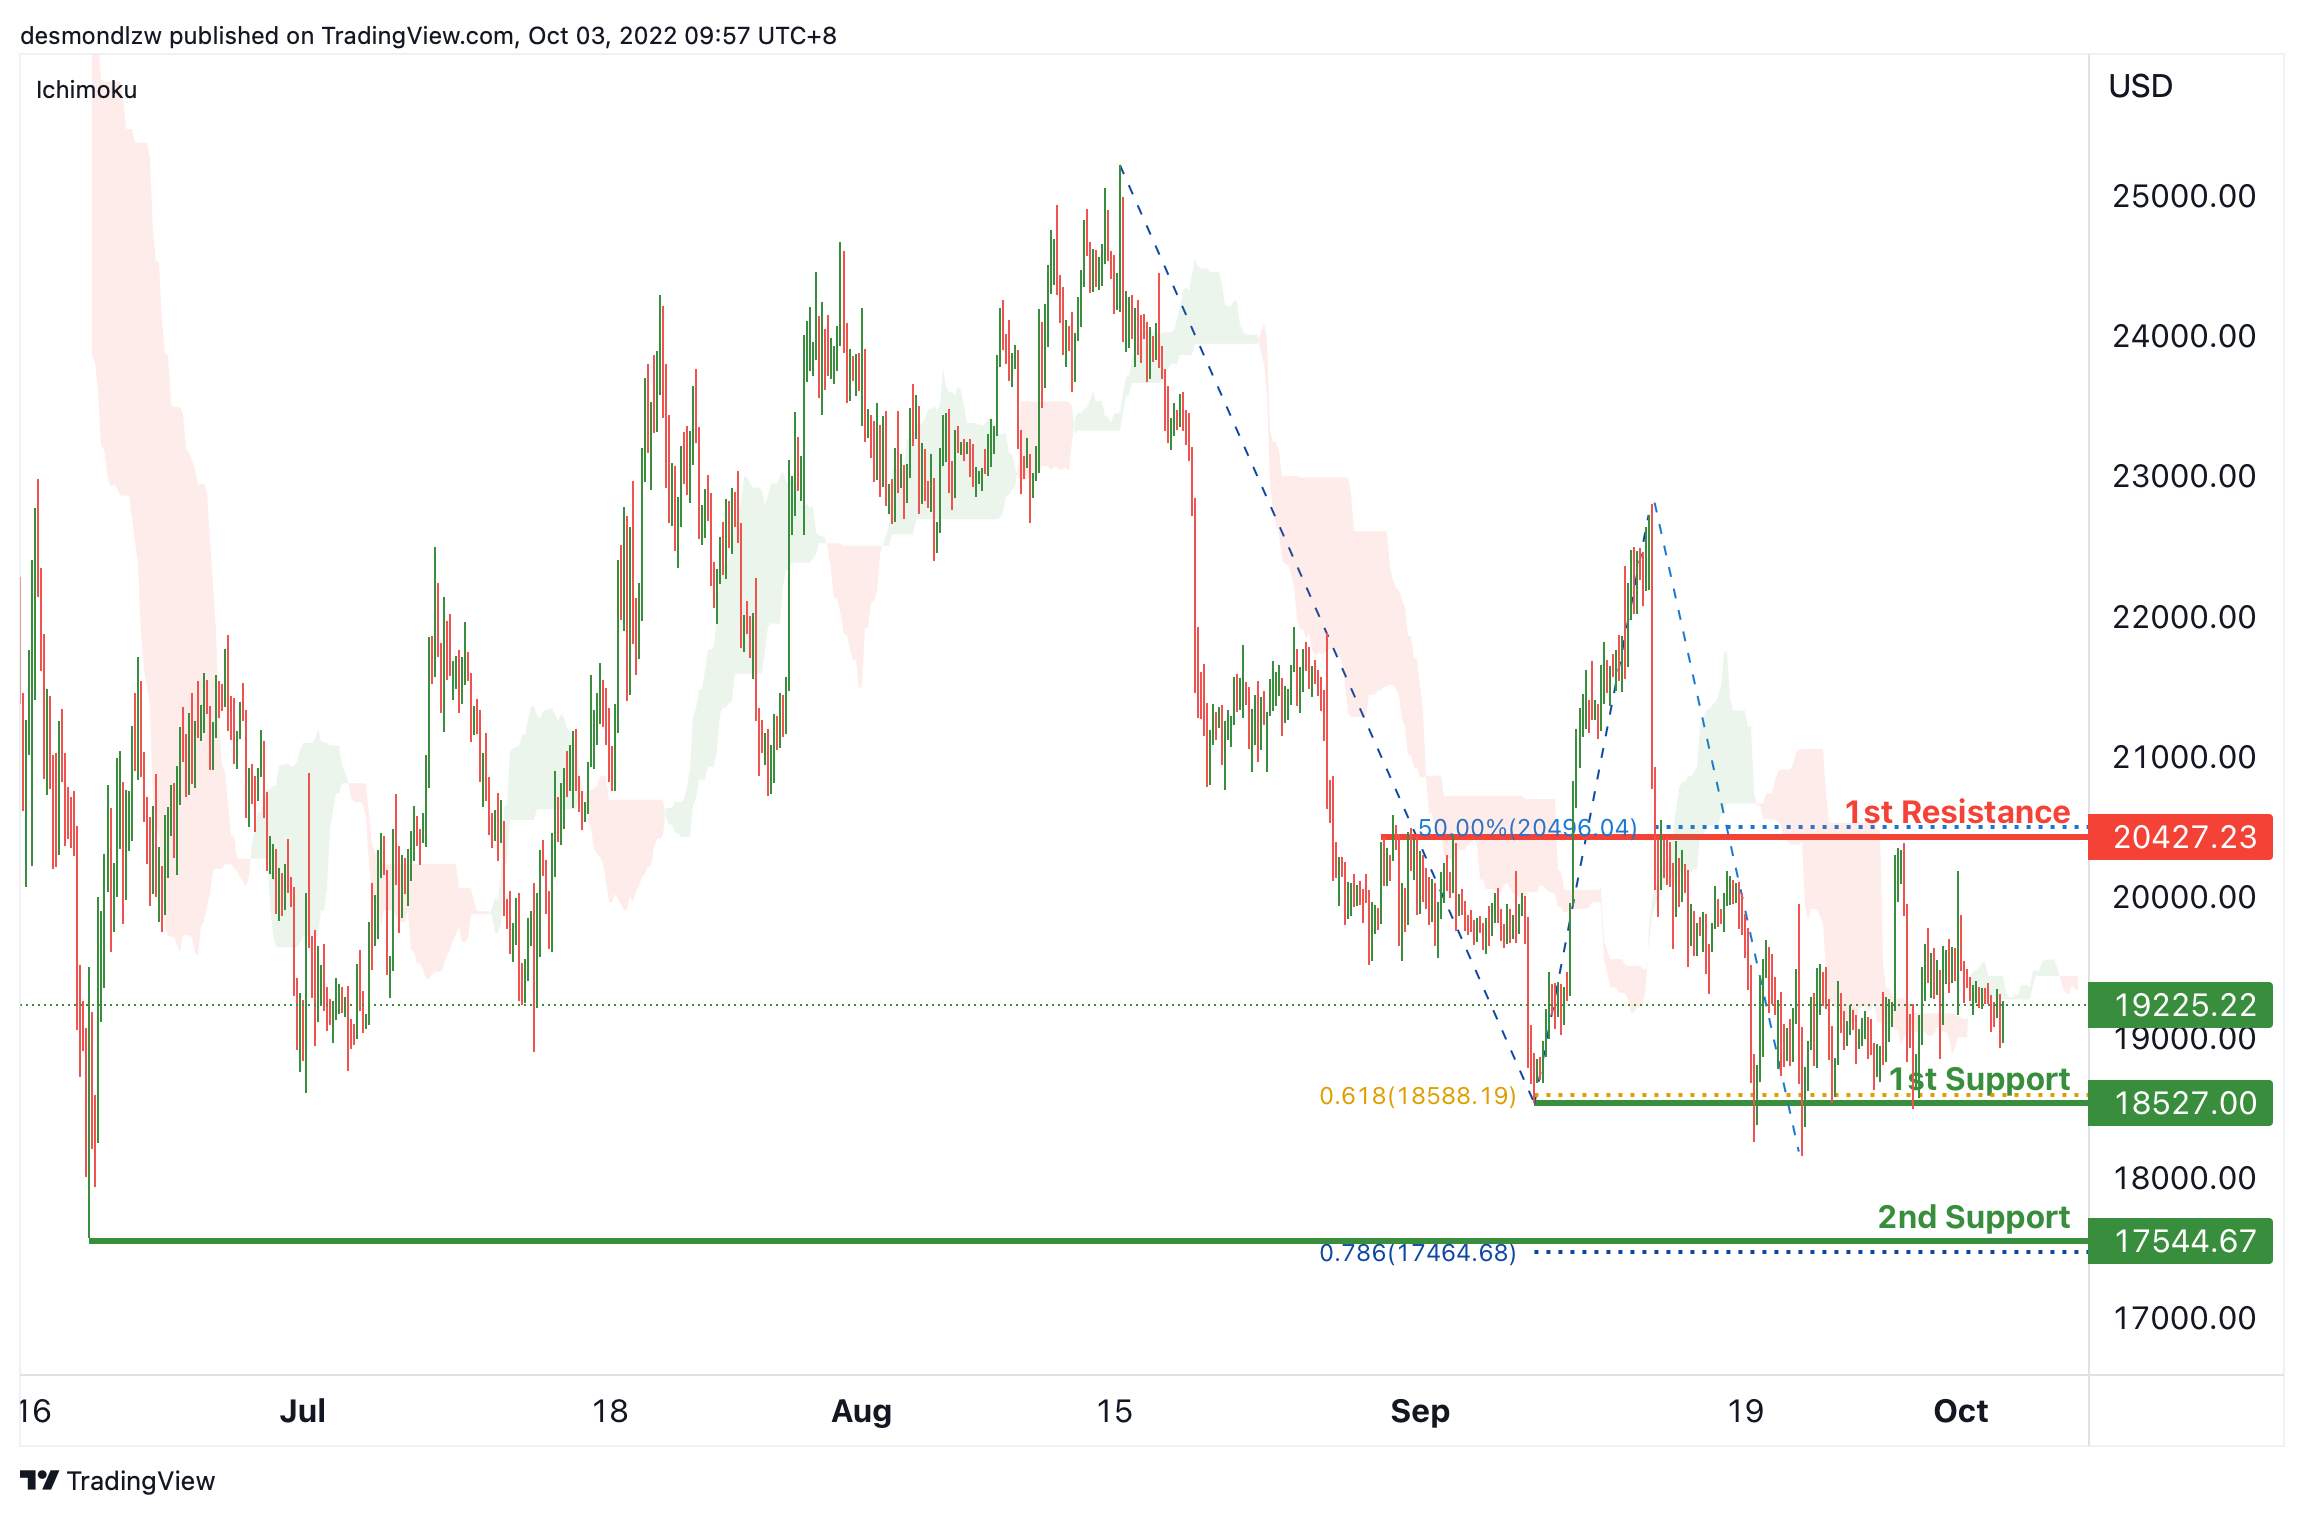
BTCUSD:
On the H4, price is consolidating. Currently the price is below the ichimoku cloud, the price may test the 1st the 1st support at 18527, which is in line with the swing lows and 61.8% fibonacci projection. If the 1st support is broken, the 2nd support could be at 17544.67, which is in line with the 78.6% fibonacci projection and swing low. Alternatively, the price may rise to test the resistance at 20427.23, where the overlap resistance and 50% fibonacci retracement are.
Areas of consideration:
- H4 time frame, 1st resistance at 20427.23
- H4 time frame, 1st support at 18527
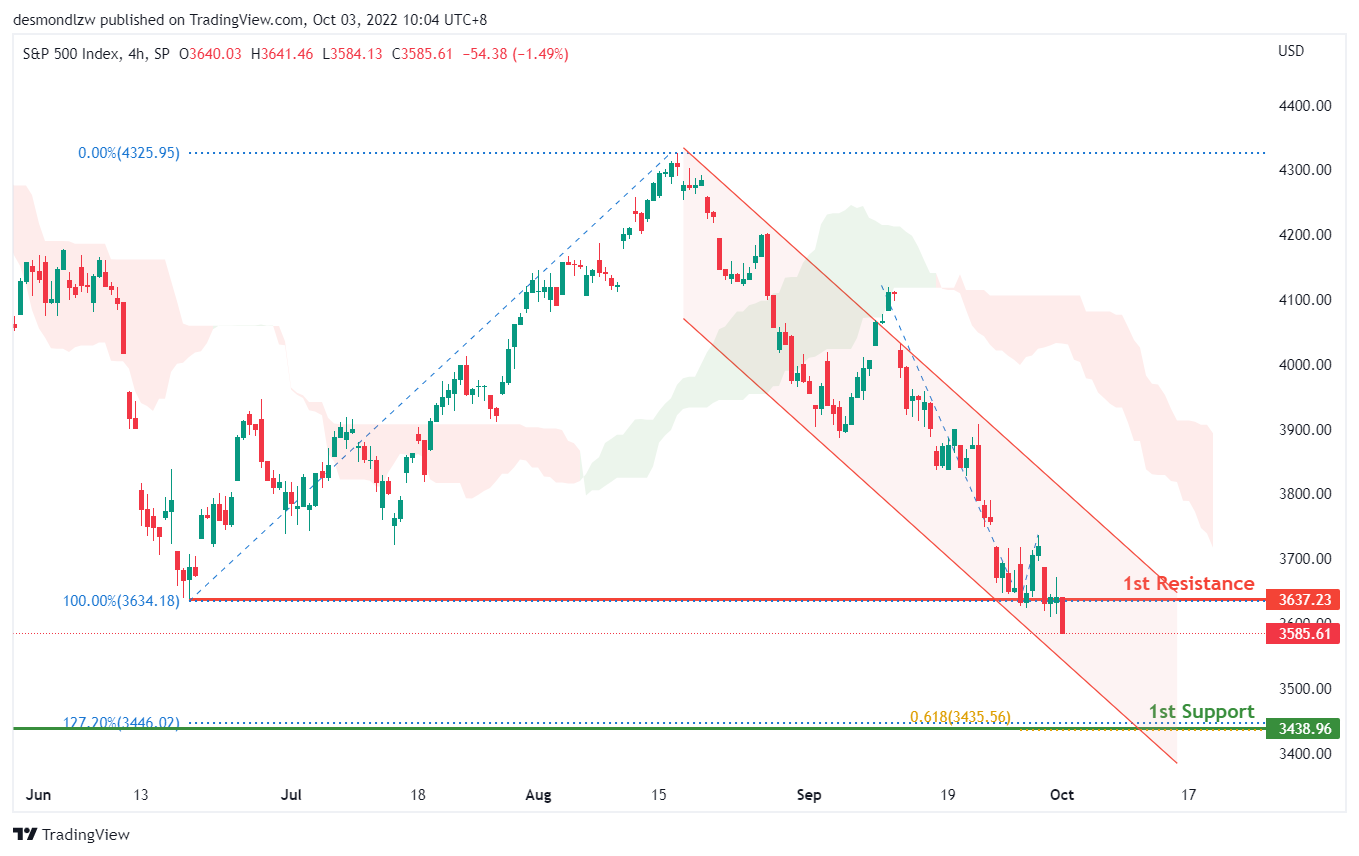
S&P 500:
On the H4, with the price trading lower from the 1st resistance, within the descending channel and below the ichimoku cloud, we continue to have a bearish bias. Look for a bearish continuation with the 1st support at 3438.96, which is in line with the previous swing low of October 2020, 127.20% fibonacci expansion and 61.8% fibonacci extension level.
Areas of consideration:
- H4 time frame, 1st resistance at 3637.23
- H4 time frame, 1st support at 3438.96


