
USD/JPY:
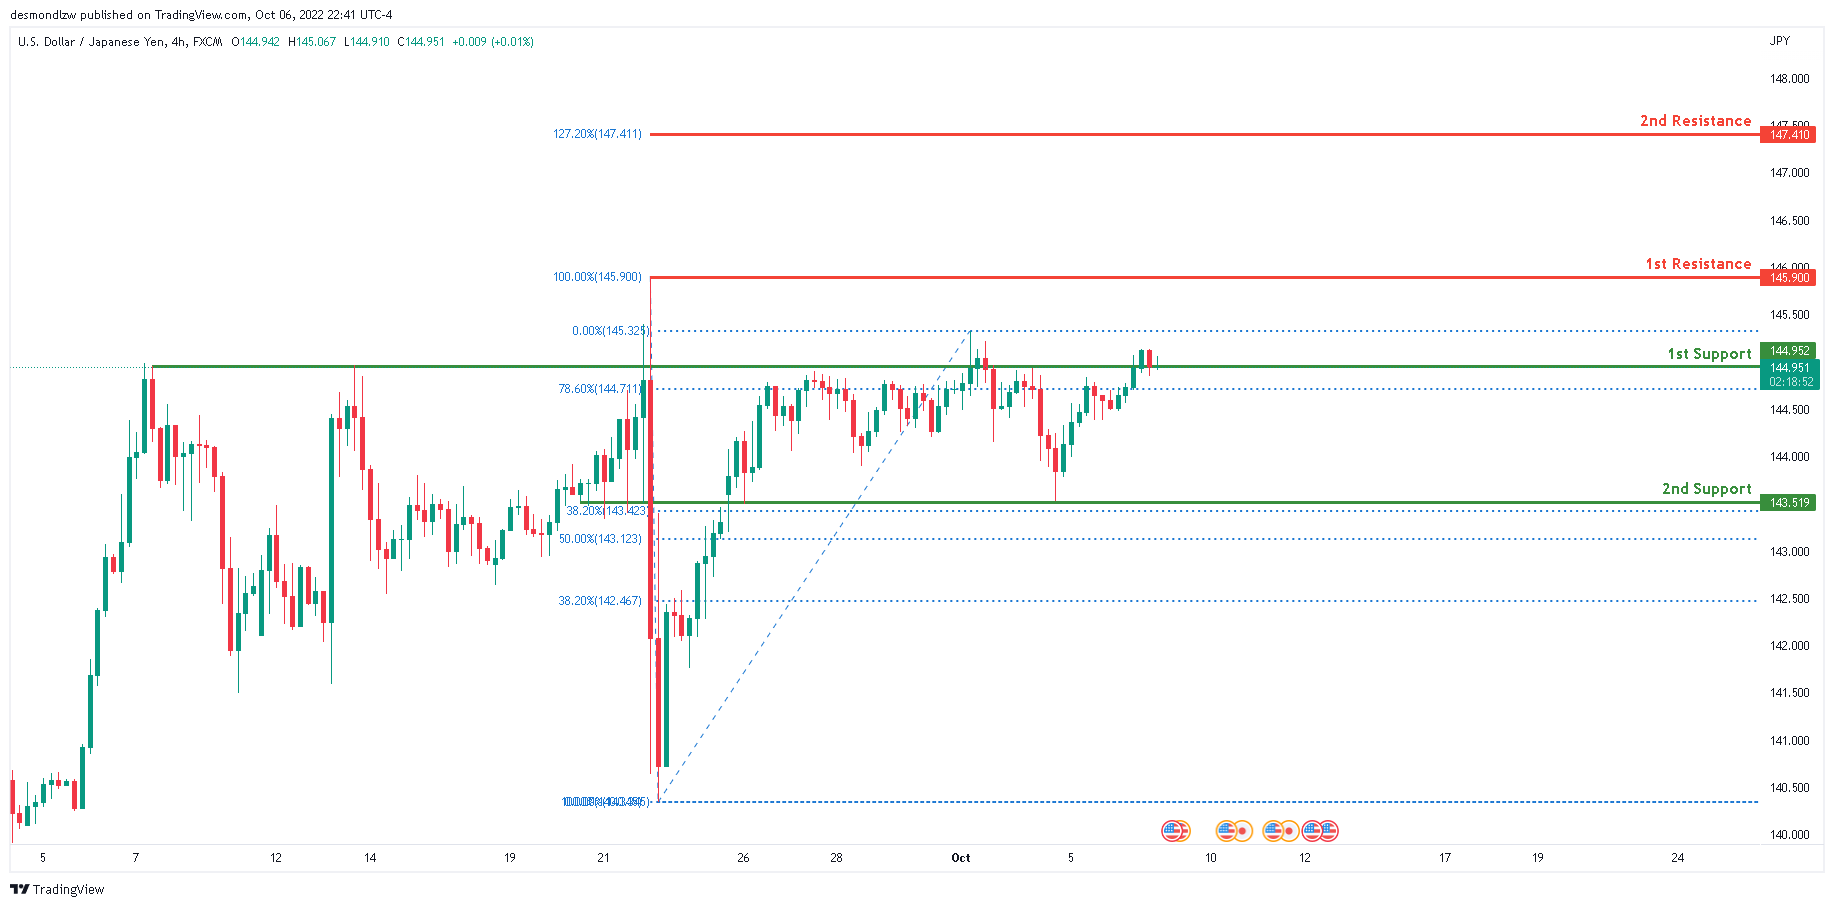
On the H4 chart, USDJPY is in a bullish trend. In addition, the price is above the ichimoku cloud, indicating that the market is bullish. Price bounced off the second support level at 143.519, which also happens to coincide with the 38.2% Fibonacci line. Price broke over the first resistance level at 144.952, where the important 145 level is placed, overnight. Price may continue to rise towards the first resistance level at 145.900.
Areas of consideration:
- H4 time frame, 1st resistance at 145.900
- H4 time frame, 1st support at 144.952
DXY:
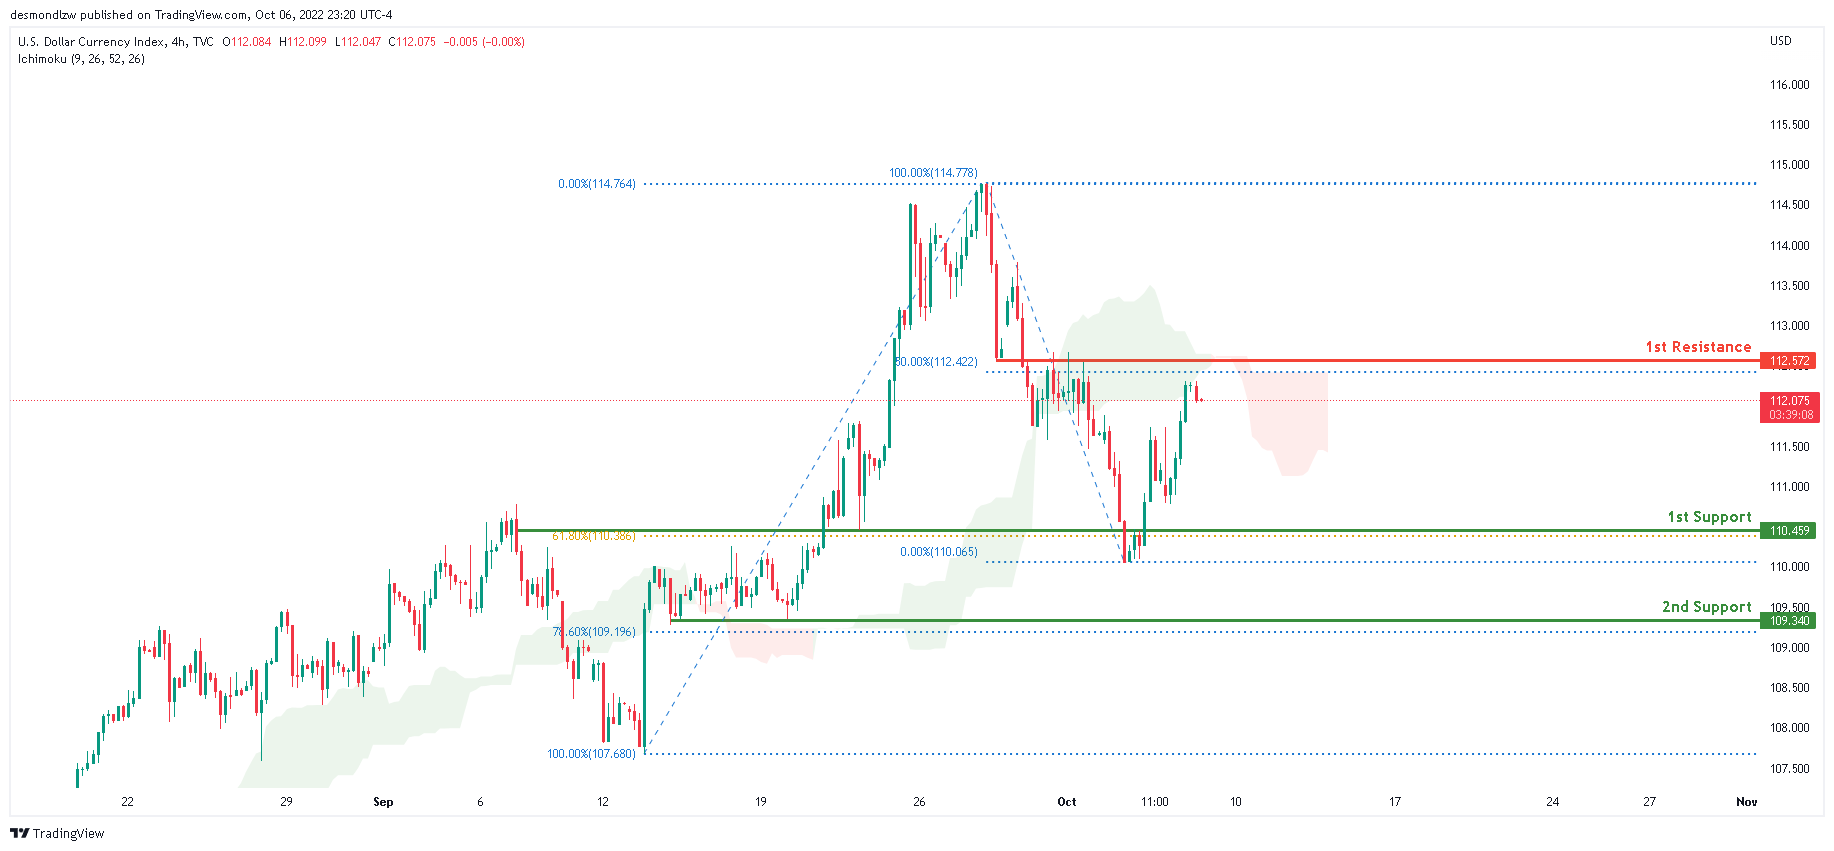
DXY has a bearish bias on the H4 chart. In addition, price has closed below the Ichimoku cloud, indicating a bearish market. Price has risen overnight, approaching the first resistance level at 122.572, where the 50% Fibonacci line is placed. Price is expected to test the first resistance level and may reverse to the downside.
Areas of consideration:
- H4 time frame, 1st resistance at 112.572
- H4 time frame, 1st support at 110.459
EUR/USD:
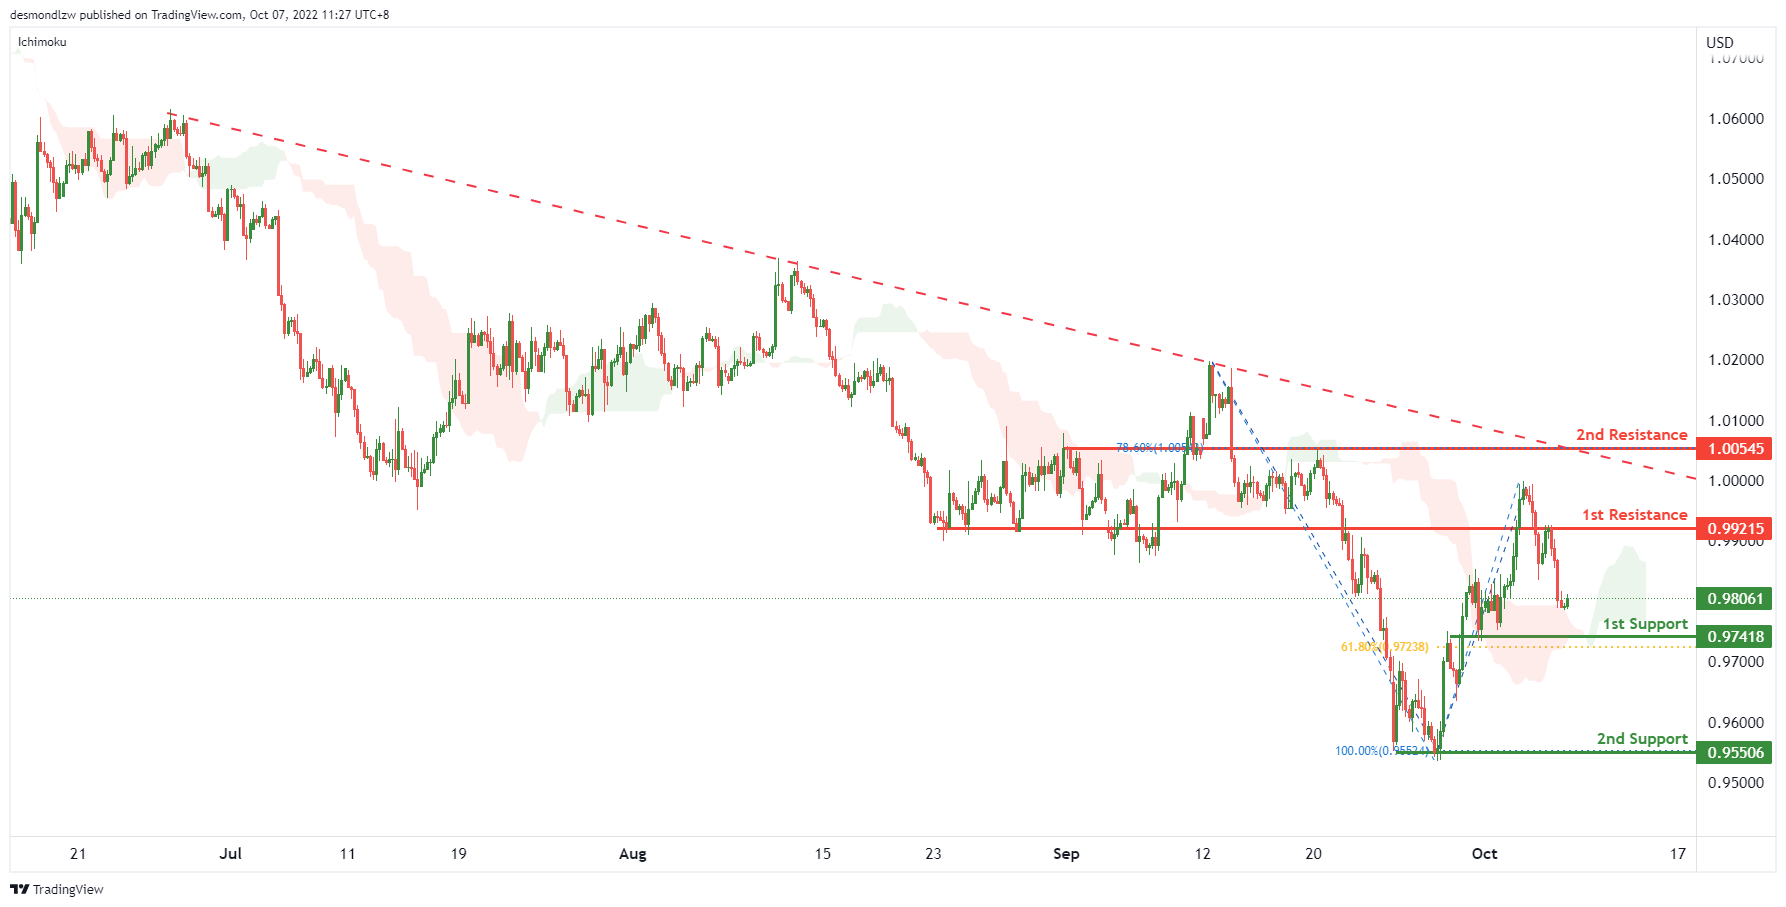
On the H4, price is moving within the descending trendline but in an ascending manner, with the price above ichimoku cloud,- we are slightly bullish biased. Price may test the first resistance at 0.99215 where the overlap resistance sits. If price breaks this level, it may test the second resistance at 1.00545, where the 78.6% fibonacci retracement sits. Alternatively, the overall bearish momentum could bring price back to test the first support at 0.97418 where the previous swing low and 38.2% retracement sits. If it breaks this level, we have a strong bearish confirmation to bring price down to 0.95506 where the swing low sits
Areas of consideration :
- H4 1st resistance at 0.99215
- H4 2nd resistance at 1.00545
GBP/USD:
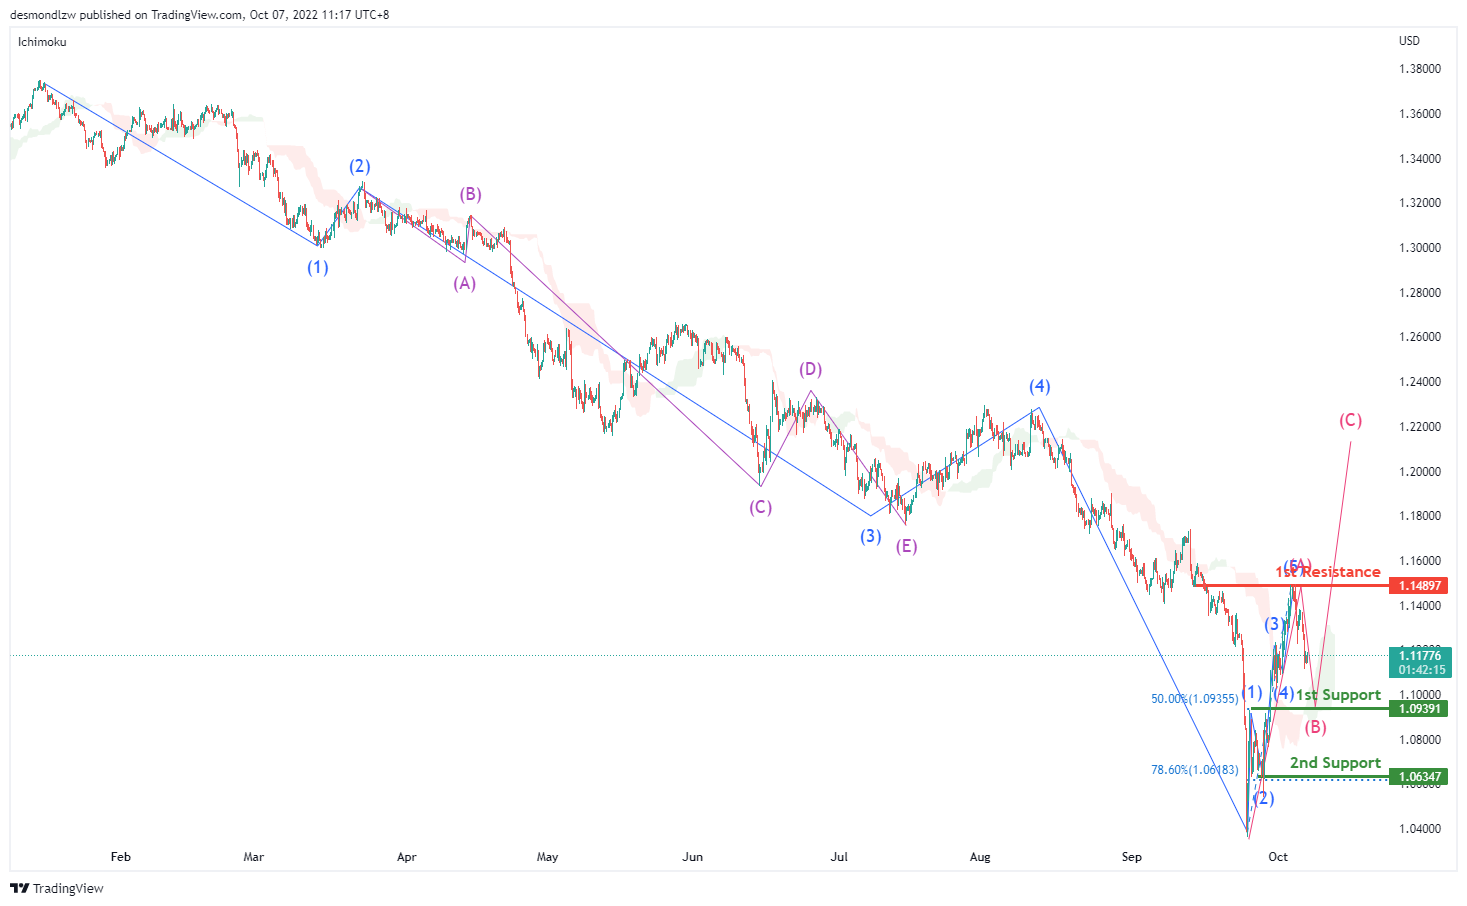
On H4, the price is at corrective wave B, and showing a retracing trend. With the price is above ichimoku cloud , we could expect the price drop to the 1st support at 1.09391, which is in line with the 50% fibonacci retracement , and then rise to the 1st resistance at 1.14897, where the swing high and the end of wave A sit. Alternatively, the price may break the 1st support and then drop to the 2nd support at 1.06347, where the 78.6% fibonacci retracement is.
Areas of consideration:
- H4 1st support at 1.09391
- H4 1st resistance at 1.14897
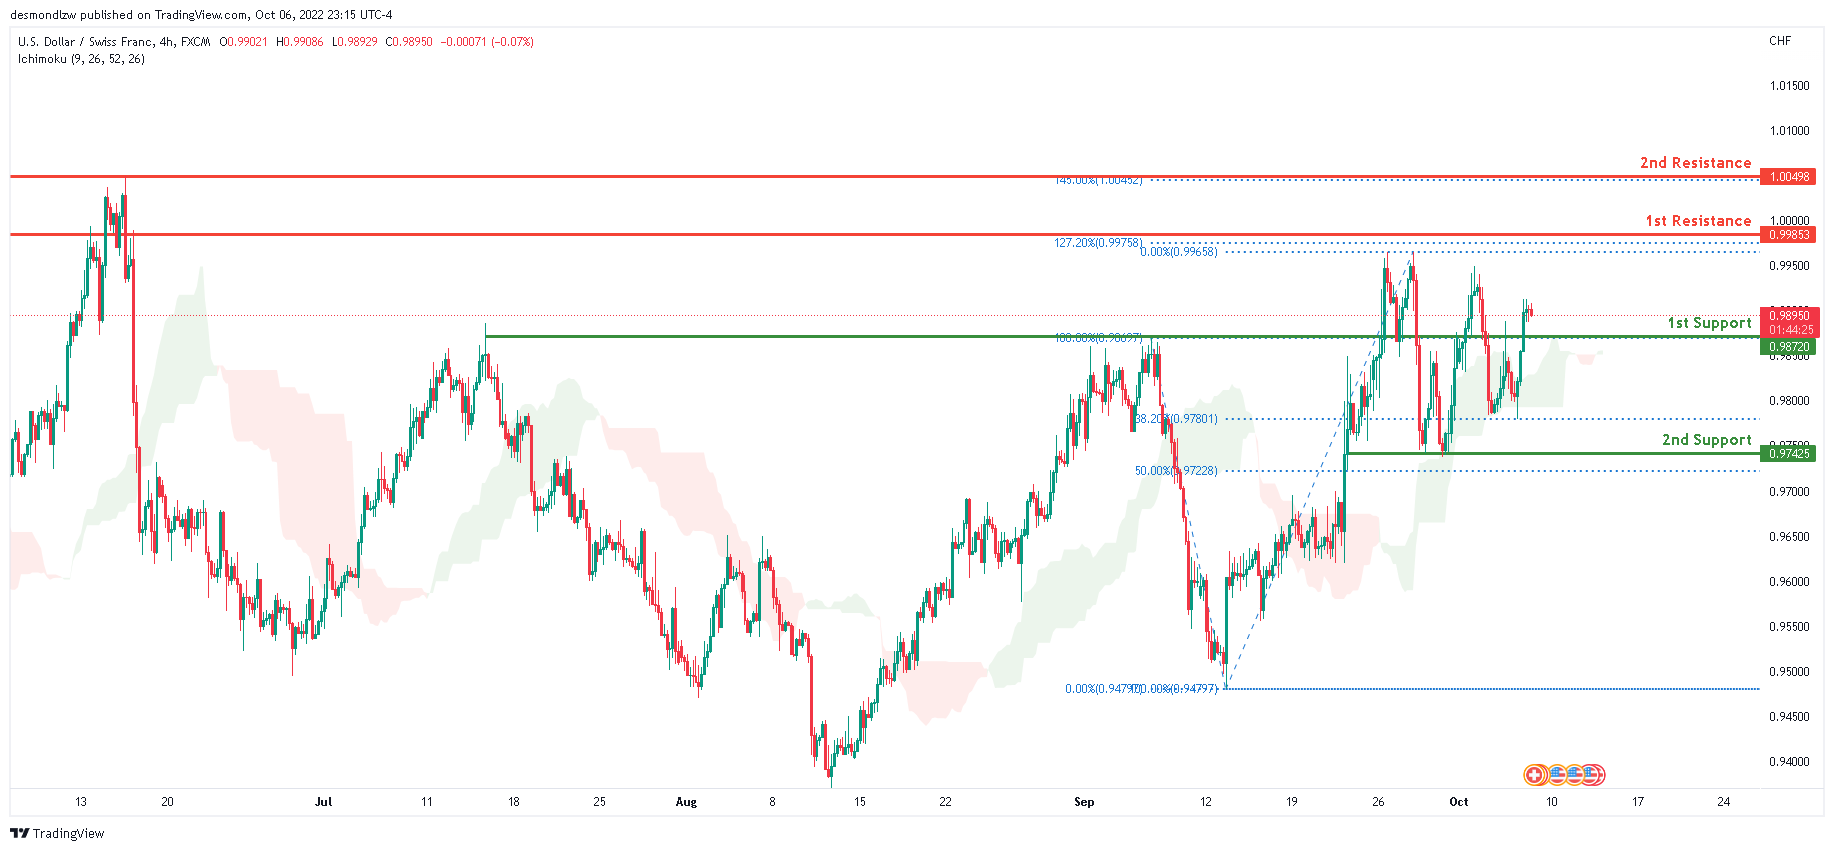
USD/CHF:
USDCHF is in a strong bullish trend on the H4 chart. To add to this bias, the price is above the Ichimoku cloud, indicating a bullish market. Price closed above the first support level at 0.98720, where the 100% Fibonacci line is placed, overnight. Price is expected to continue rising towards the first resistance level at 0.99853, which contains the 127.2% Fibonacci extension and the 0% Fibonacci line.
Areas of consideration
- H4 1st support at 0.98720
- H4 1st resistance at 0.99853
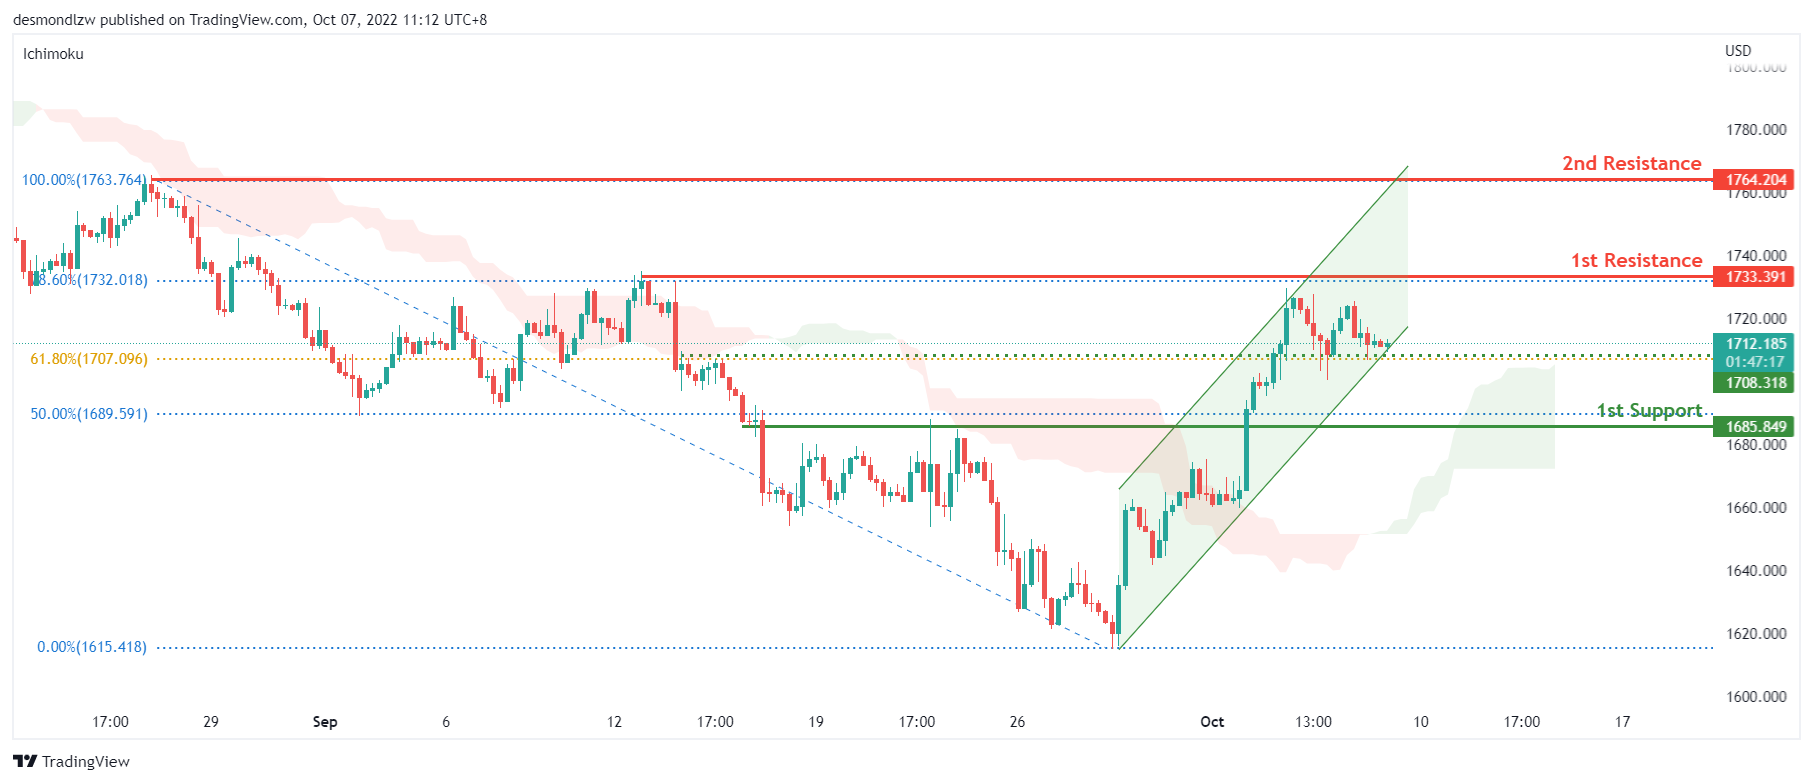
XAU/USD (GOLD):
On the H4, price continues to trade along the 1712 level which is the 61.8% fibonacci retracement level and maintains above the ichimoku cloud. We have a neutral bias, as price could trade lower to the 1st support of 1685, which is in line with the 50% fibonacci retracement level and previous swing high from 22 September. Alternatively, if the price trades higher to break above the 1st resistance of 1733, which is the 78.6% fibonacci retracement level and previous swing high, the price could rise towards the 2nd resistance of 1764, the previous swing high from August 2022.
Areas of consideration:
- H4 time frame, 1st resistance at 1733.39
- H4 time frame, 1st support at 1685
- H4 time frame, 2nd resistance at 1764
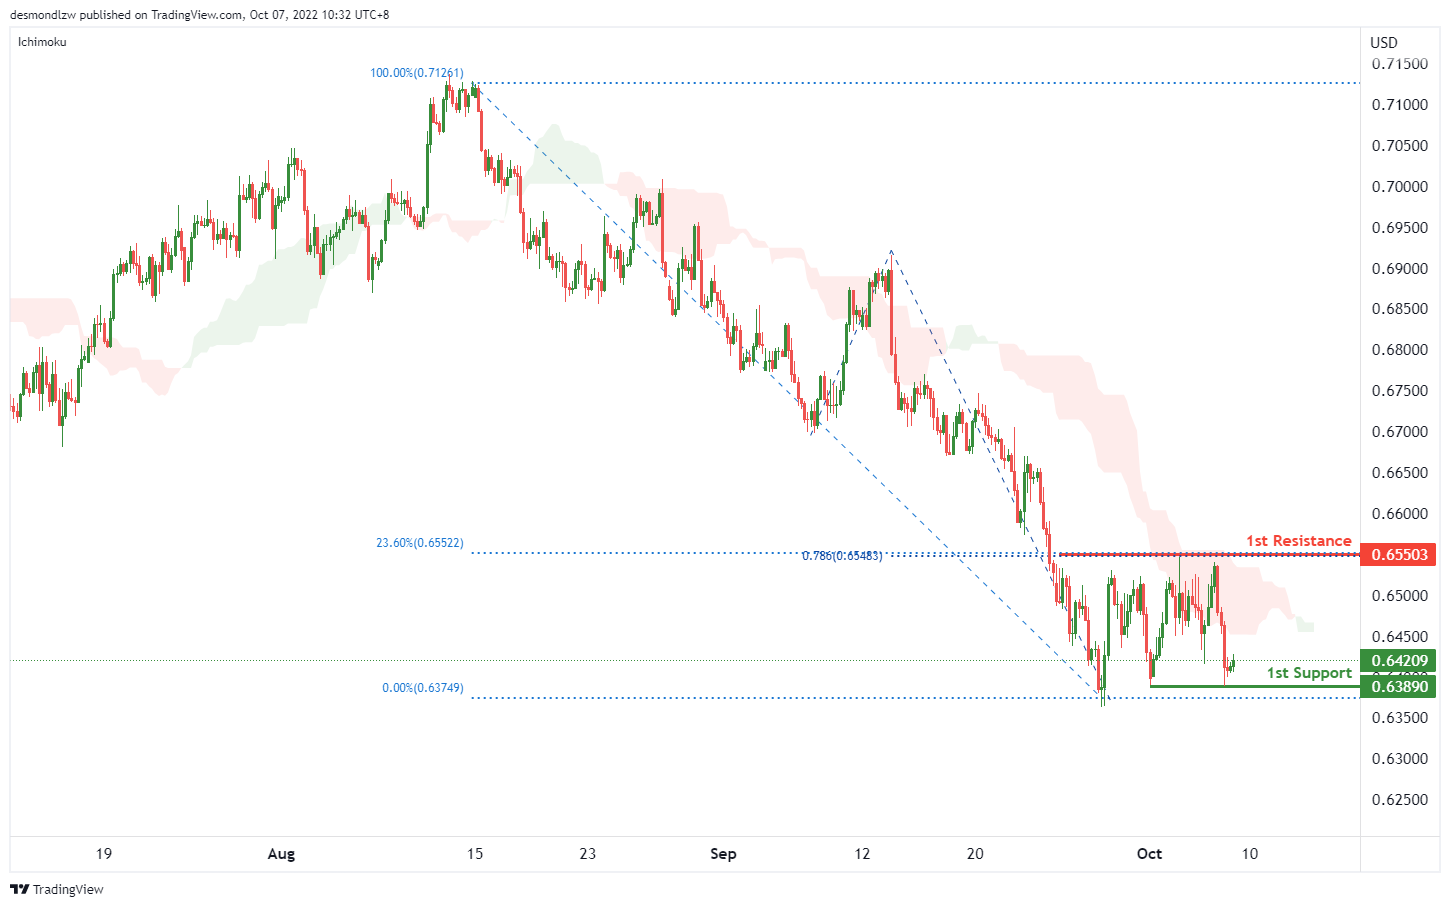
AUD/USD:
On the H4, the price is below ichimoku cloud and testing the 1st support at 0.63890, which is in line with the swing klow. The price is showing a retrace trend now. The previous support is still held, and the current resistance is at 0.65503, where the previous swing high, 23.6% fibonacci retracement and 78.6% fibonacci projection are.
Areas of consideration
- H4, 1st support at 0.63890
- H4, 1st resistance at 0.65503
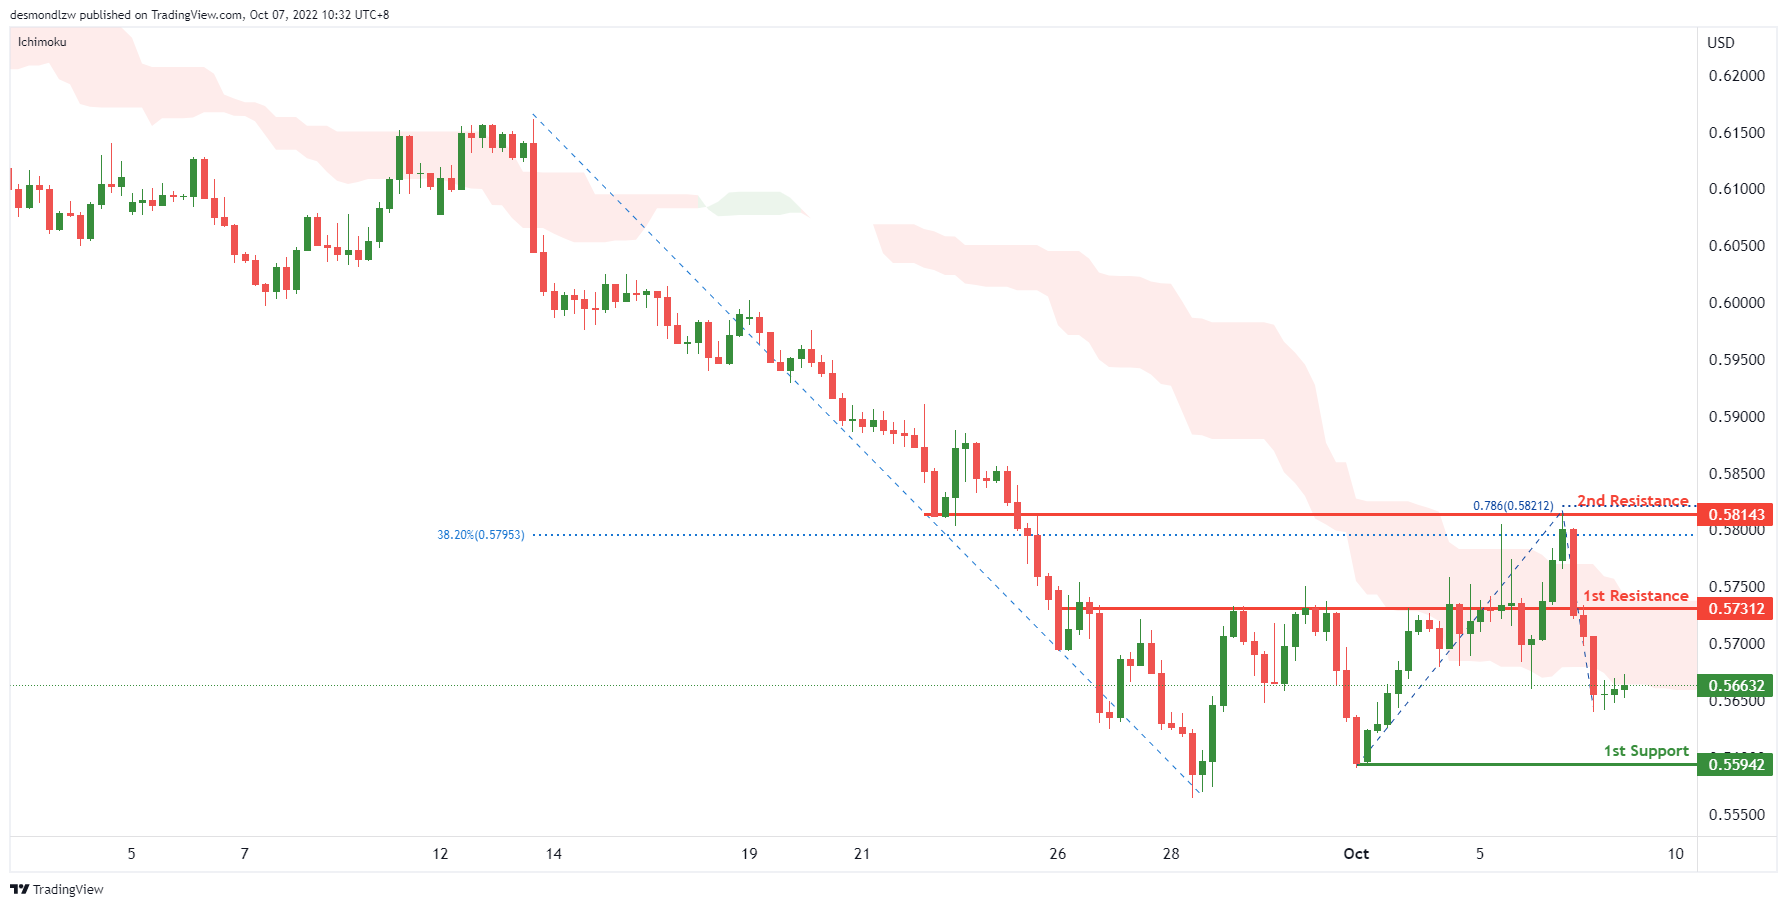
NZD/USD:
On the H4, with the price moving below the ichimoku cloud, we have a bearish bias that the price may retrace to the 1st resistance at 0.57312, which is in line with the swing highs and then drop to the 1st support at 0.55942, where the swing low is. Alternatively, the price may break the 1st resistance, and rise to the 2nd resistance at 0.58143, where the 38.2% fibonacci retracement and 78.6% fibonacci projection are.
Areas of consideration:
- H4 time frame, 1st resistance at 0.57312
- H4 time frame, 1st support at 0.55942
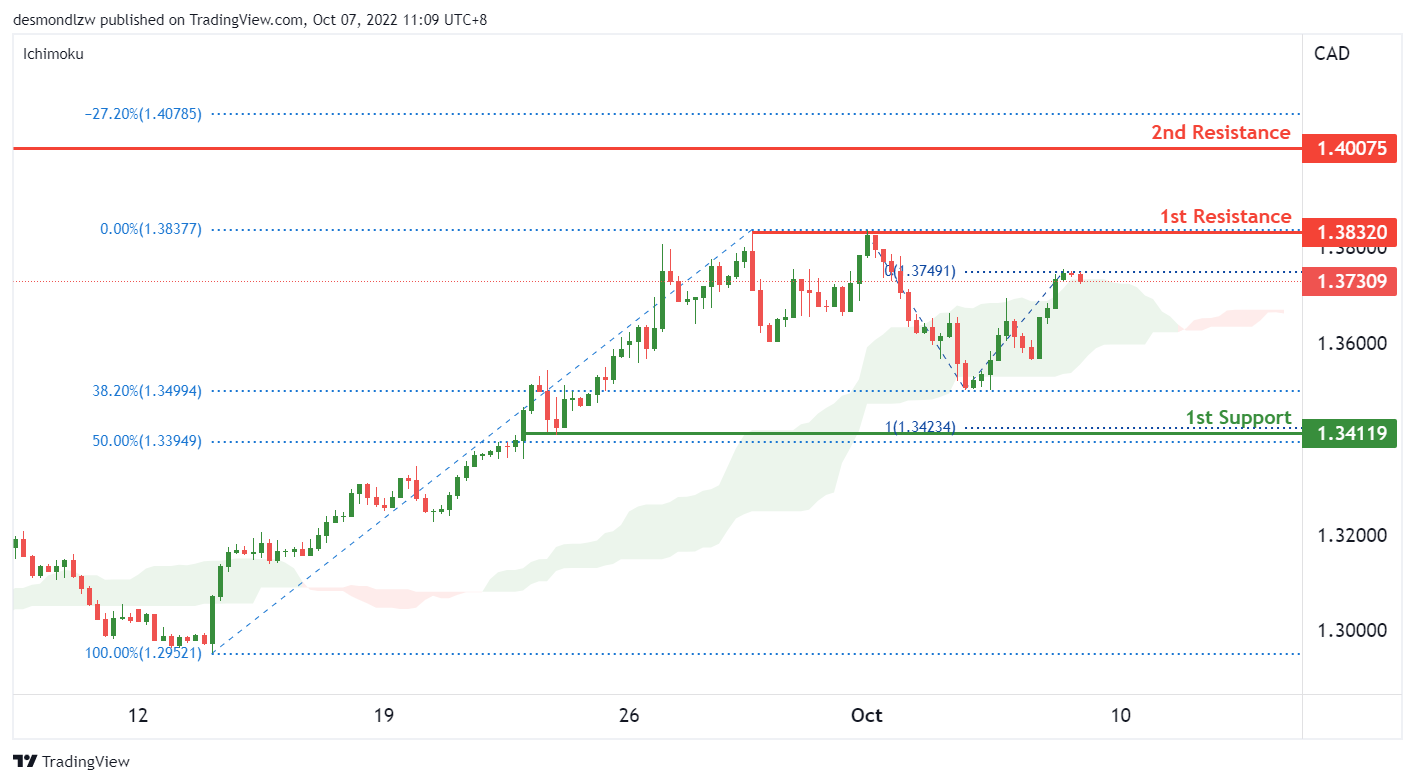
USD/CAD:
On the H4, the price trades higher near the 1st resistance of 1.3832 which is the previous swing high level. With the price entering the ichimoku cloud, we have a short term bearish bias that price could reverse to trade lower. The price could fall to the 1st support of 1.34 which is in line with the 50% retracement level and the previous swing low. Alternatively, if price breaks above the 1st resistance level, the USDCAD could trade higher towards the 2nd resistance of 1.4 which is the swing high from May 2020.
Areas of consideration:
- H4 time frame, 1st resistance at 1.3832
- H4 time frame, 1st support at 1.34
- H4 time frame, 2nd resistance at 1.40
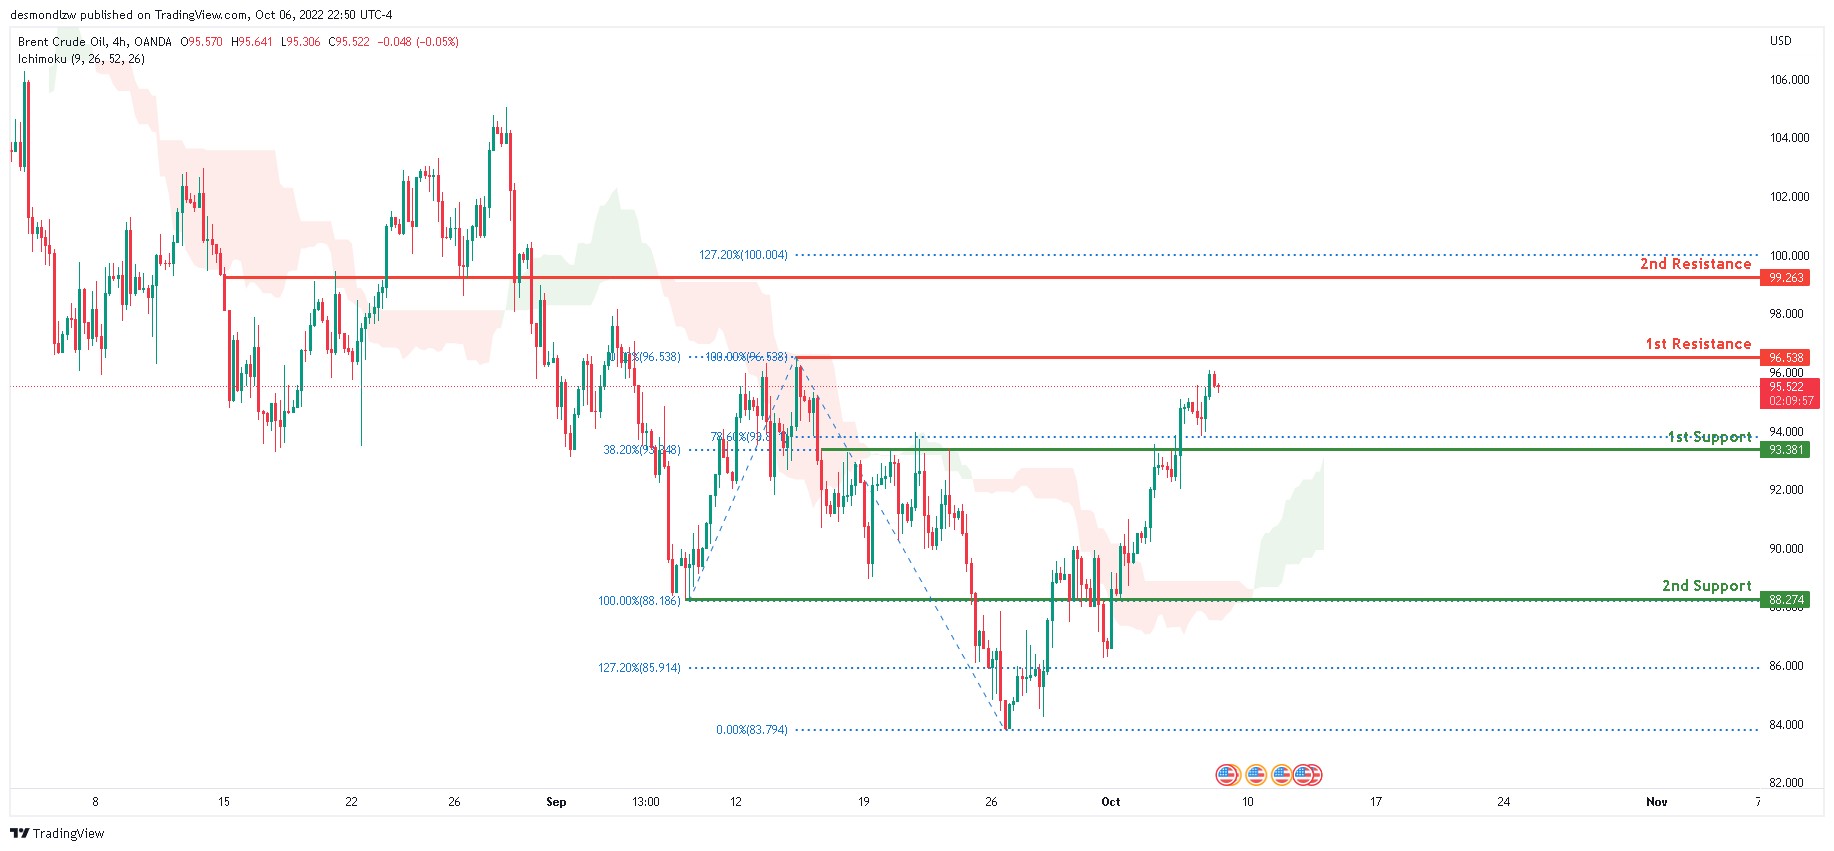
OIL:
On the H4 chart, oil is in a bearish trend. However, price began to rise a week ago and is currently above the Ichimoku cloud, signaling that the market has begun a medium-term bullish trend. Price has also closed above the first support level, denoted by the 78.6% Fibonacci line, at 93.381. Price has maintained its positive trend overnight. Price is predicted to rise to the first resistance level at 96.538, which contains the 100% and 0% Fibonacci lines.
Areas of consideration:
- H4 time frame, 1st resistance at 96.538
- H4 time frame, 1st support at 93.381
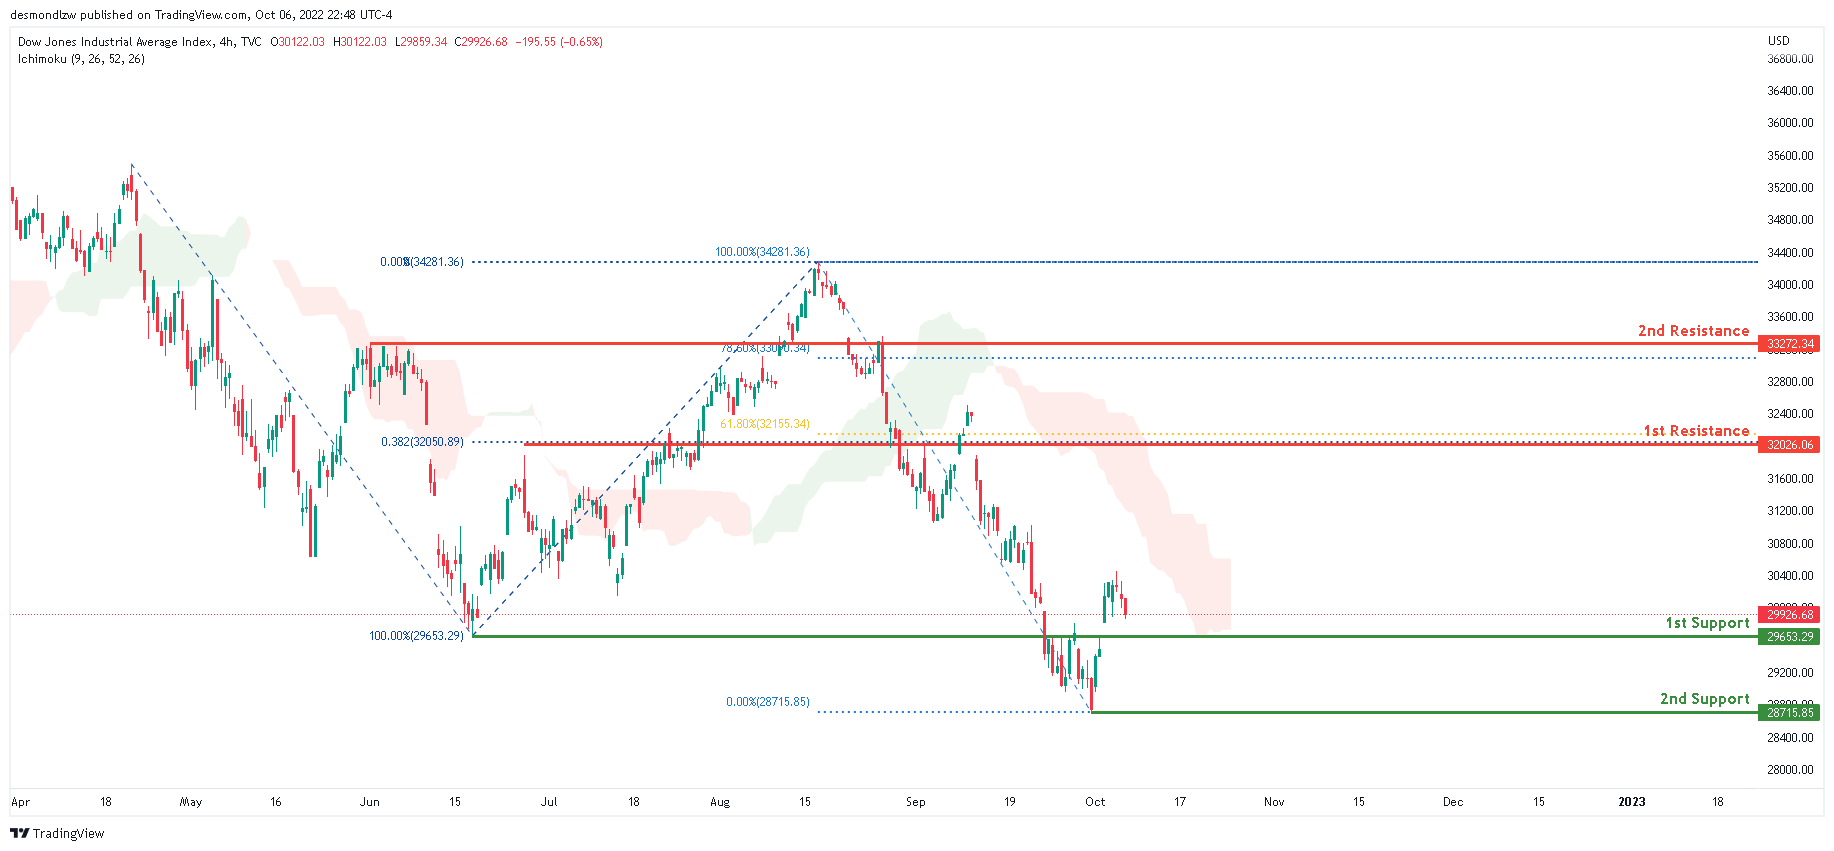
Dow Jones Industrial Average:
On the H4 chart, price is bearish. However, a short-term bullish trend has emerged over the last week. Price reclaimed the first support level at 29653.29, corresponding to the last swing low. If the short-term bullish momentum continues, price will go towards the first resistance level at 32026.06, which contains the 61.8% Fibonacci line and the 38.2% Fibonacci projection line.
Areas of consideration:
- H4 time frame, 1st support at 29653.29
- H4 time frame, 1st resistance at 32026.06
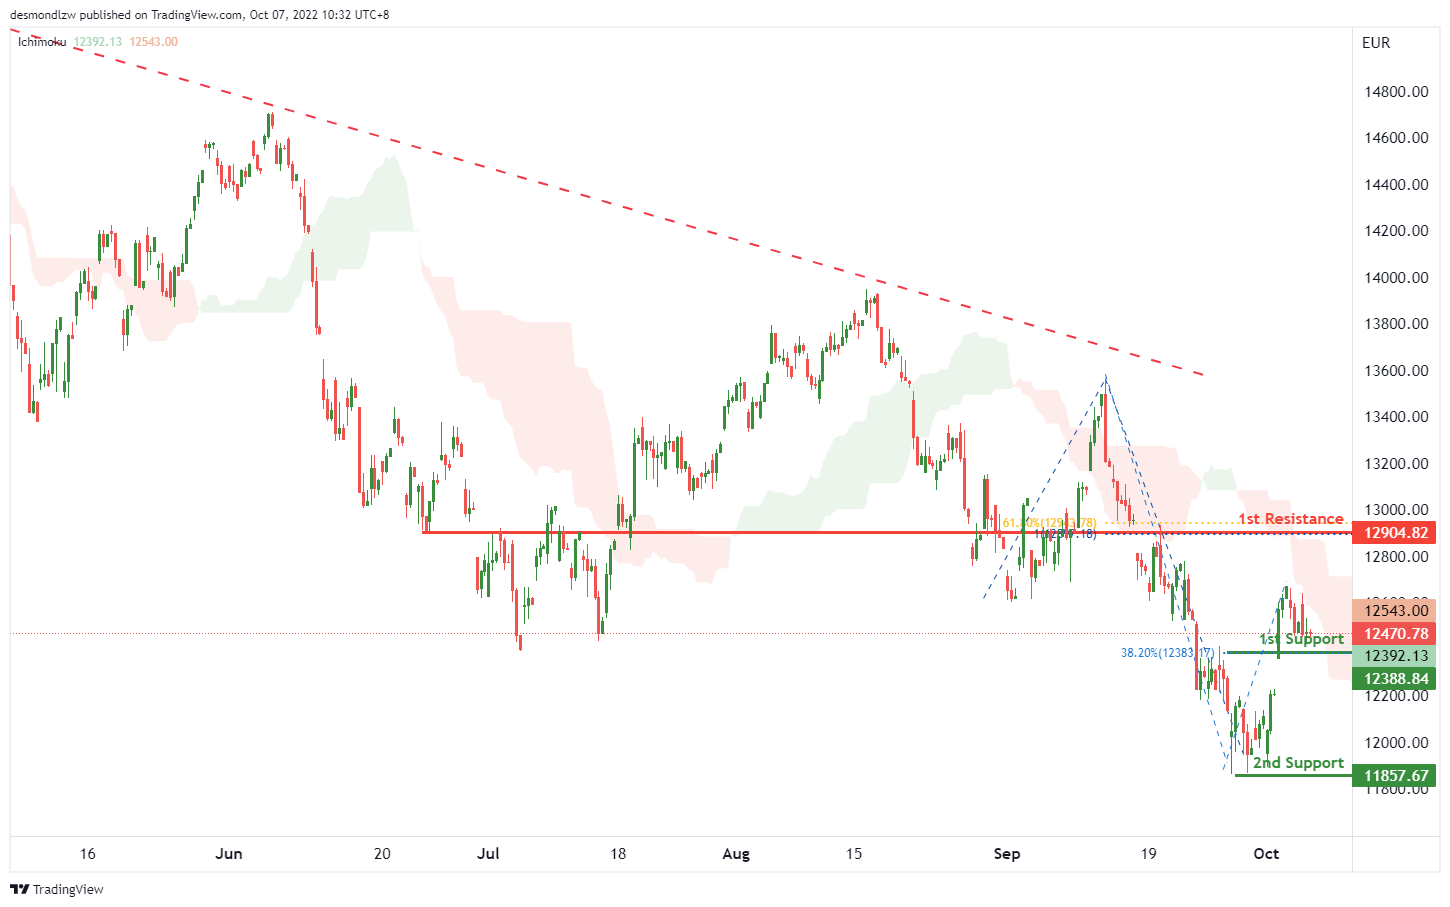
DAX:
On the H4, with the price moving below ichimoku cloud and long term descending trendline, we have a bearish bias that the price may drop to the 1st support at 12388.84, which is in line with the 38.2% fibonacci retracement. If the 1st support is broken, the 2nd support could be at 11857.67, which is in line with the swing low. Alternatively, the price may rise to the 1st resistance at 12904.82, which is in line with the 100% fibonacci projection and 61.8% fibonacci retracement.
Areas of consideration:
- H4 time frame, 1st support at 12388.84
- H4 time frame, 2nd support at 11857.67
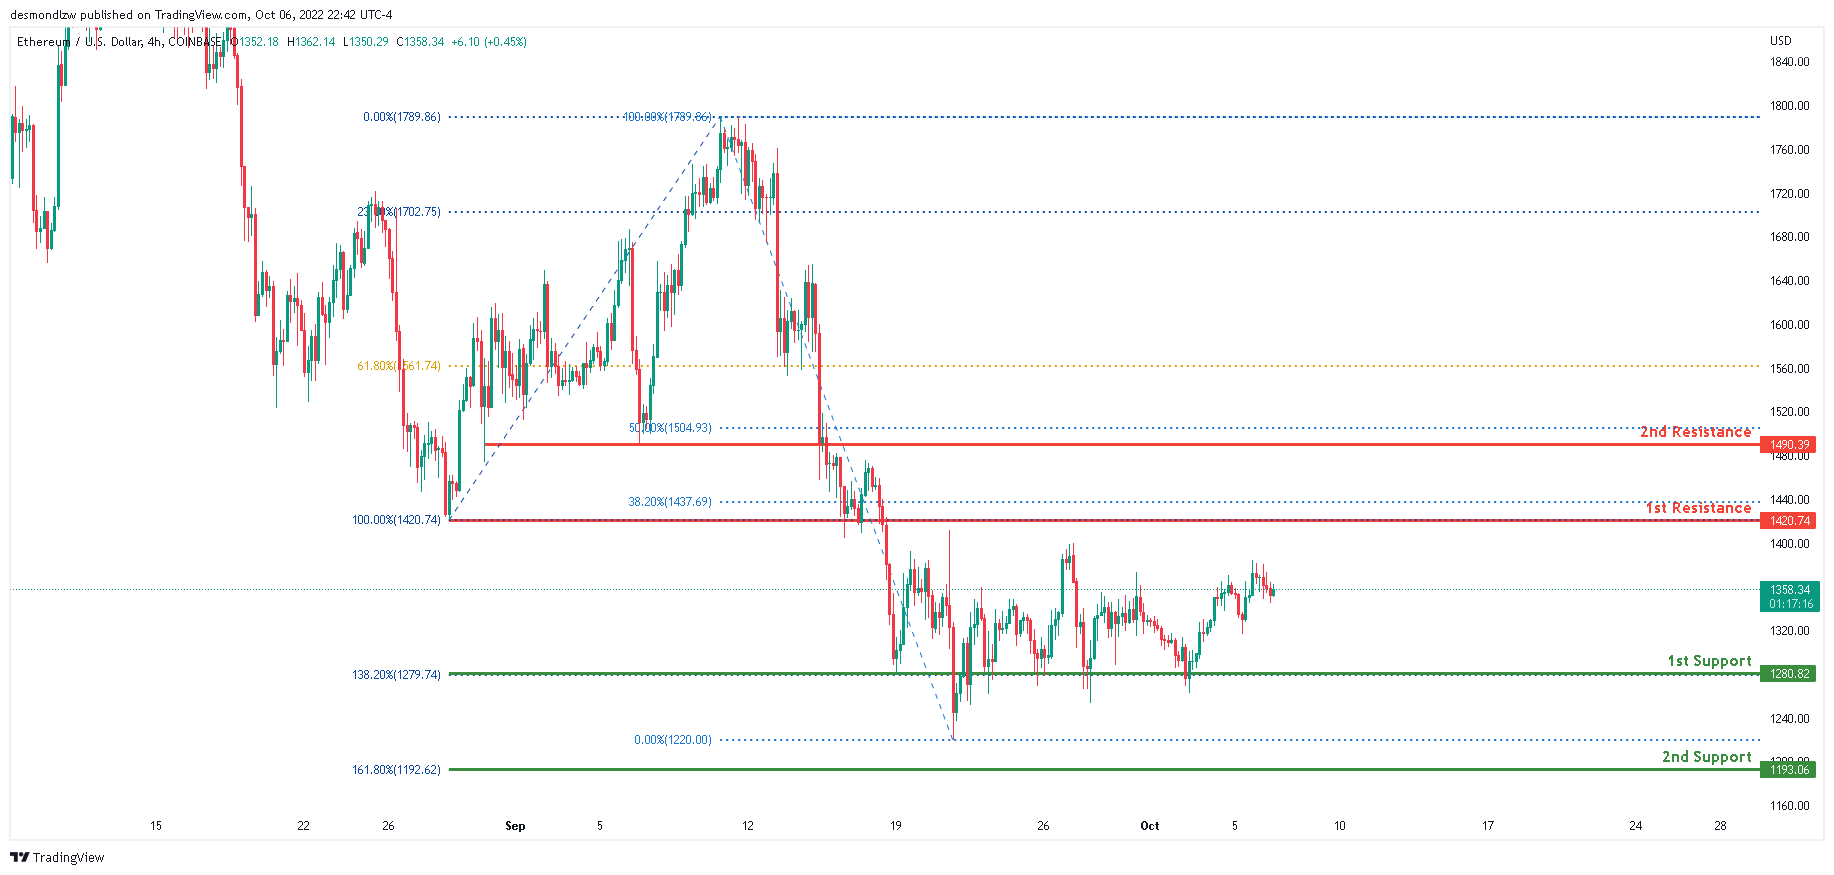
ETHUSD:
On the H4 chart, ETHUSD is bearish. Price has closed above the Ichimoku cloud, signaling a bullish market in the immediate term. Overnight, the price has continued to rise in a bullish trend. Price is projected to continue rising until the first resistance level at 1420.74, which corresponds to the last swing low.
Areas of consideration:
- H4 time frame, 1st resistance of 1420.74
- H4 time frame, 1st support at 1279.00
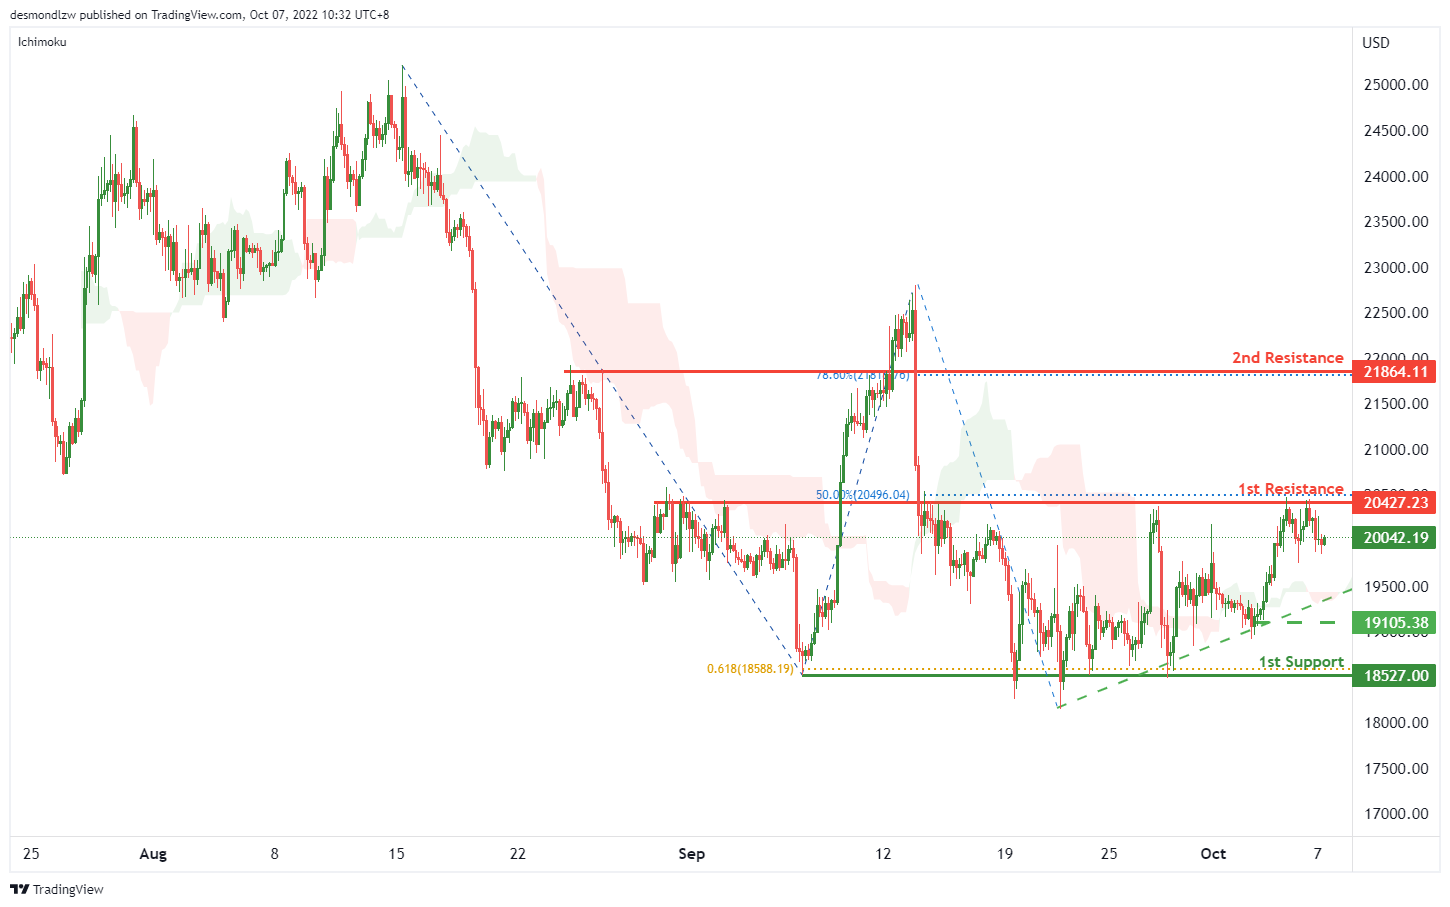
BTCUSD:
On the H4, price is showing a short term ascending trendline and testing the 1st resistance at 20427.23, where the overlap resistance and 50% fibonacci retracement are. If the 1st resistance is broken, the next resistance could be at 21864.11, which is in line with the 78.6% fibonacci retracement. Alternatively, the price may pull back from the 1st resistance and drop to the 1st support at 18527, which is in line with the swing lows and 61.8% fibonacci projection. Take note the 19105.38 could be the intermediate support.
Areas of consideration:
- H4 time frame, 1st resistance at 20427.23
- H4 time frame, 2nd resistance at 21864.11
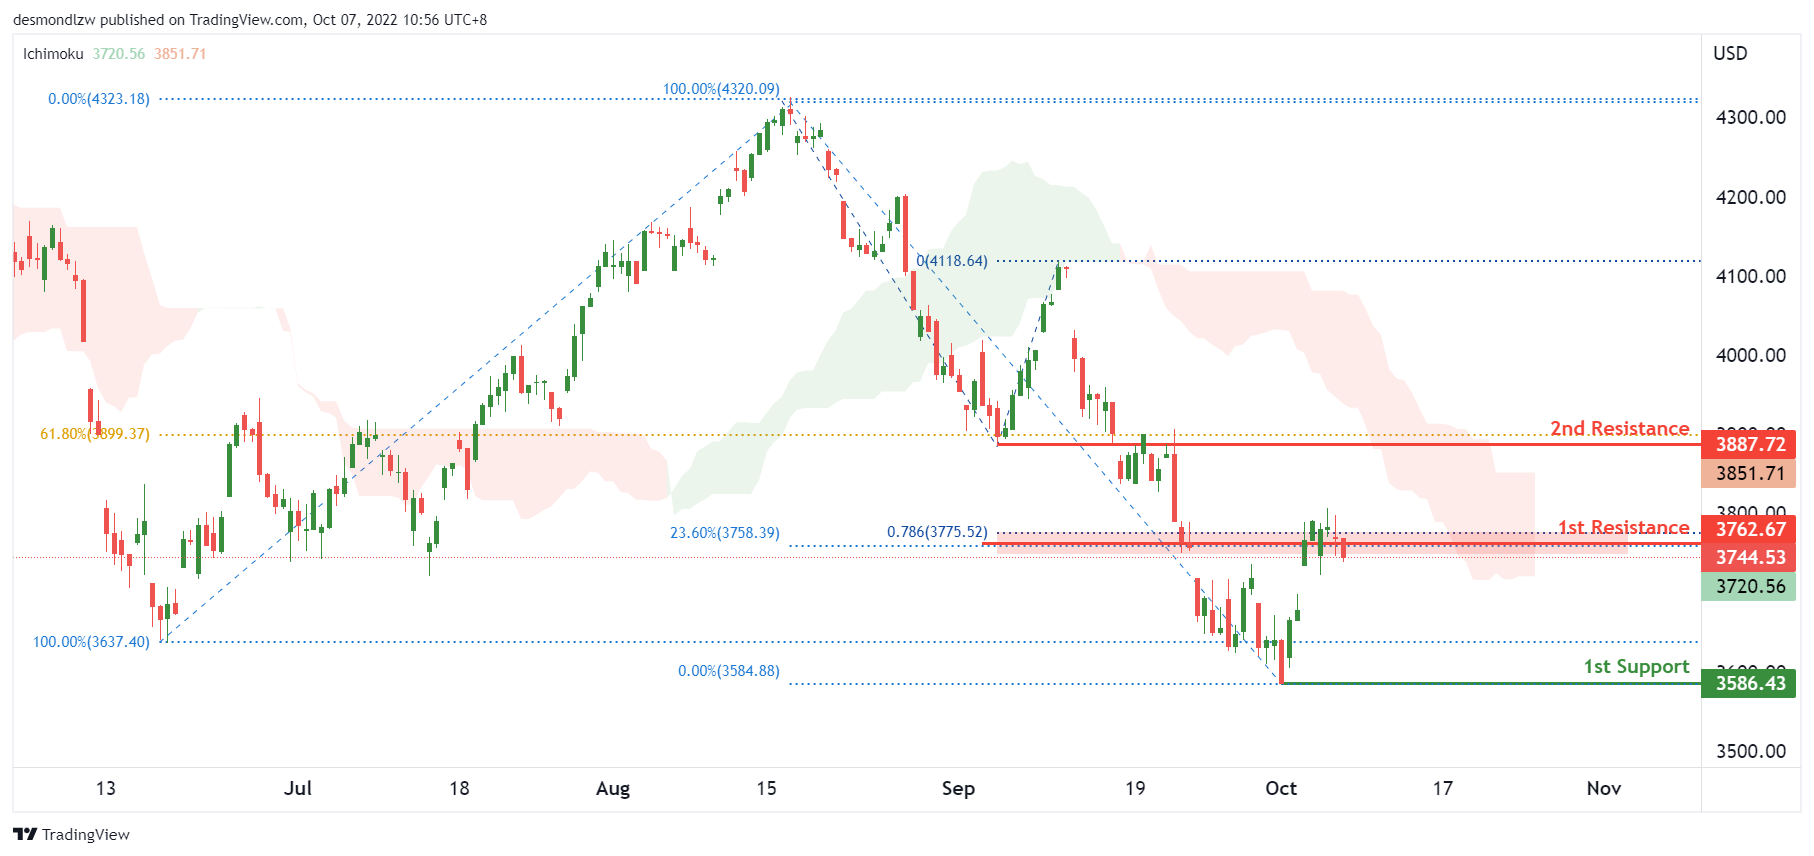
S&P 500:
On the H4, with the price showing a potential reversal from the 1st resistance of 3762, which is in line with the 23.60% fibonacci retracement level and 78.6% fibonacci extension level, we continue to have a bearish bias. The price could trade lower to the 1st support of 3586 which is the previous swing low. Alternatively, the price could reverse back into the descending channel to trade lower towards the 2nd support level, which is at the previous swing low of June 2022.
Areas of consideration:
- H4 time frame, 1st resistance at 3762
- H4 time frame, 1st support at 3586
- H4 time frame, 2nd resistance at 3887


