
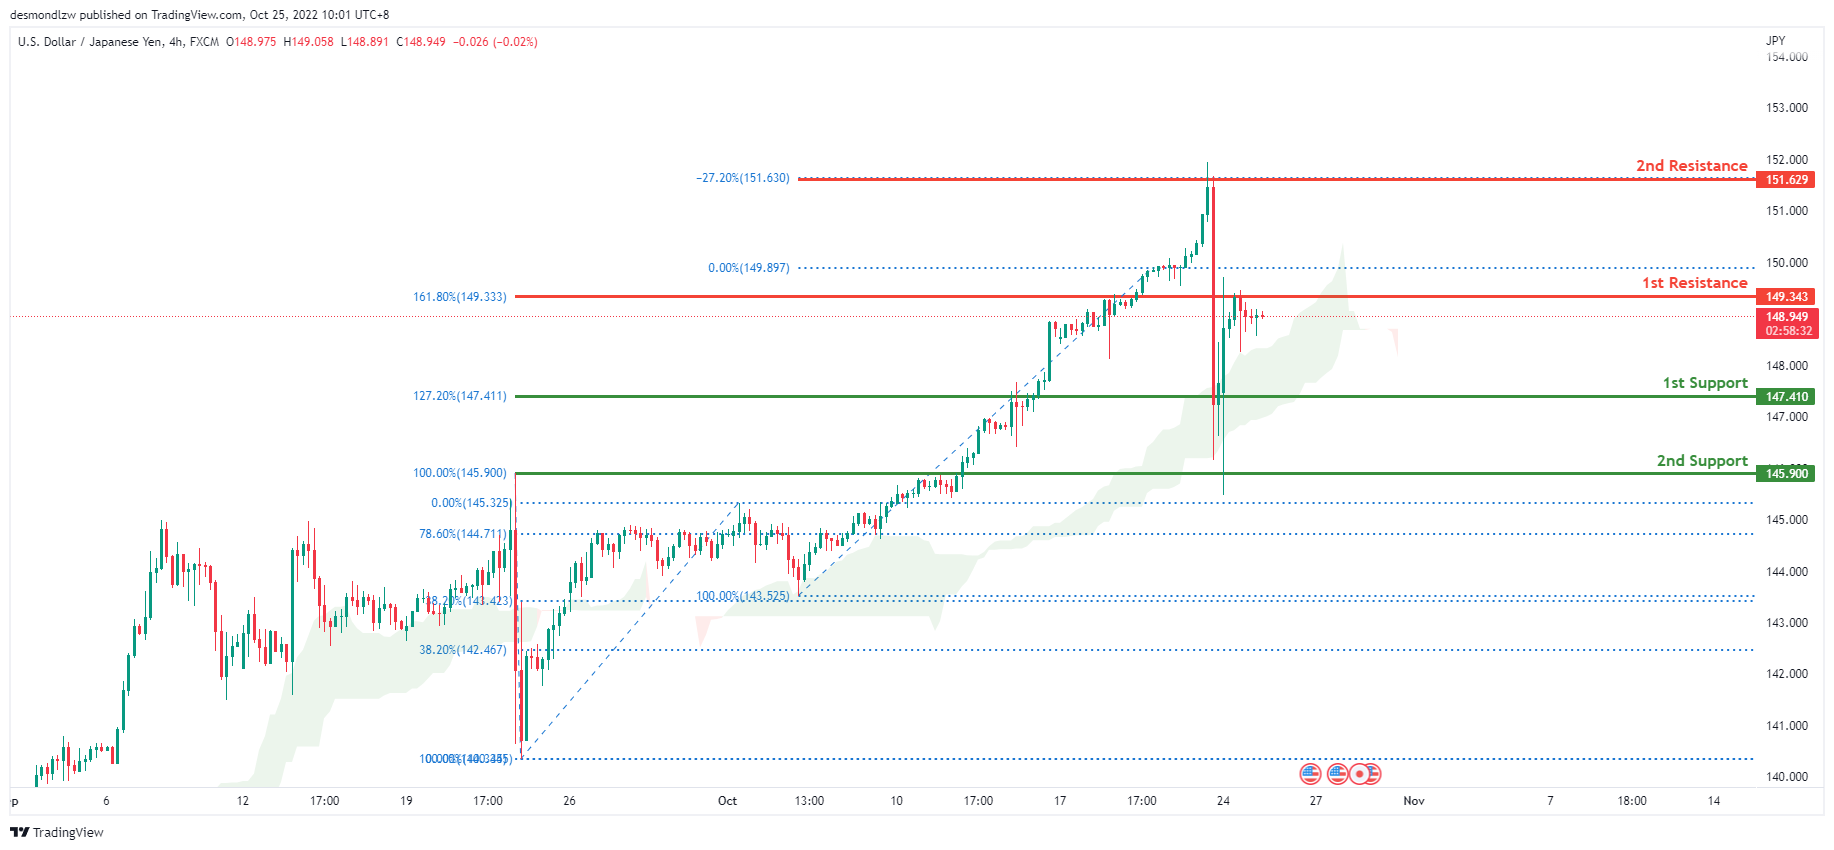
USD/JPY:
The current general bias for USDJPY on the H4 chart is bullish. To add to this bias, the price is currently trading above the Ichimoku cloud, indicating a bullish market. Last Friday the Bank of Japan intervened causing prices to be extremely volatile. Price hit the 1st resistance at 151.629 where the -27.2% Fibonacci expansion is located before coming right down to the 2nd support at 145.900 and then bounced back up with price currently trading at 148.943 at time of writing. Expecting price to retest the 1st resistance at 149.343 if this bullish momentum continues.
Areas of consideration:
- H4 time frame, 1st resistance at 151.629
- H4 time frame, 1st support at 149.313
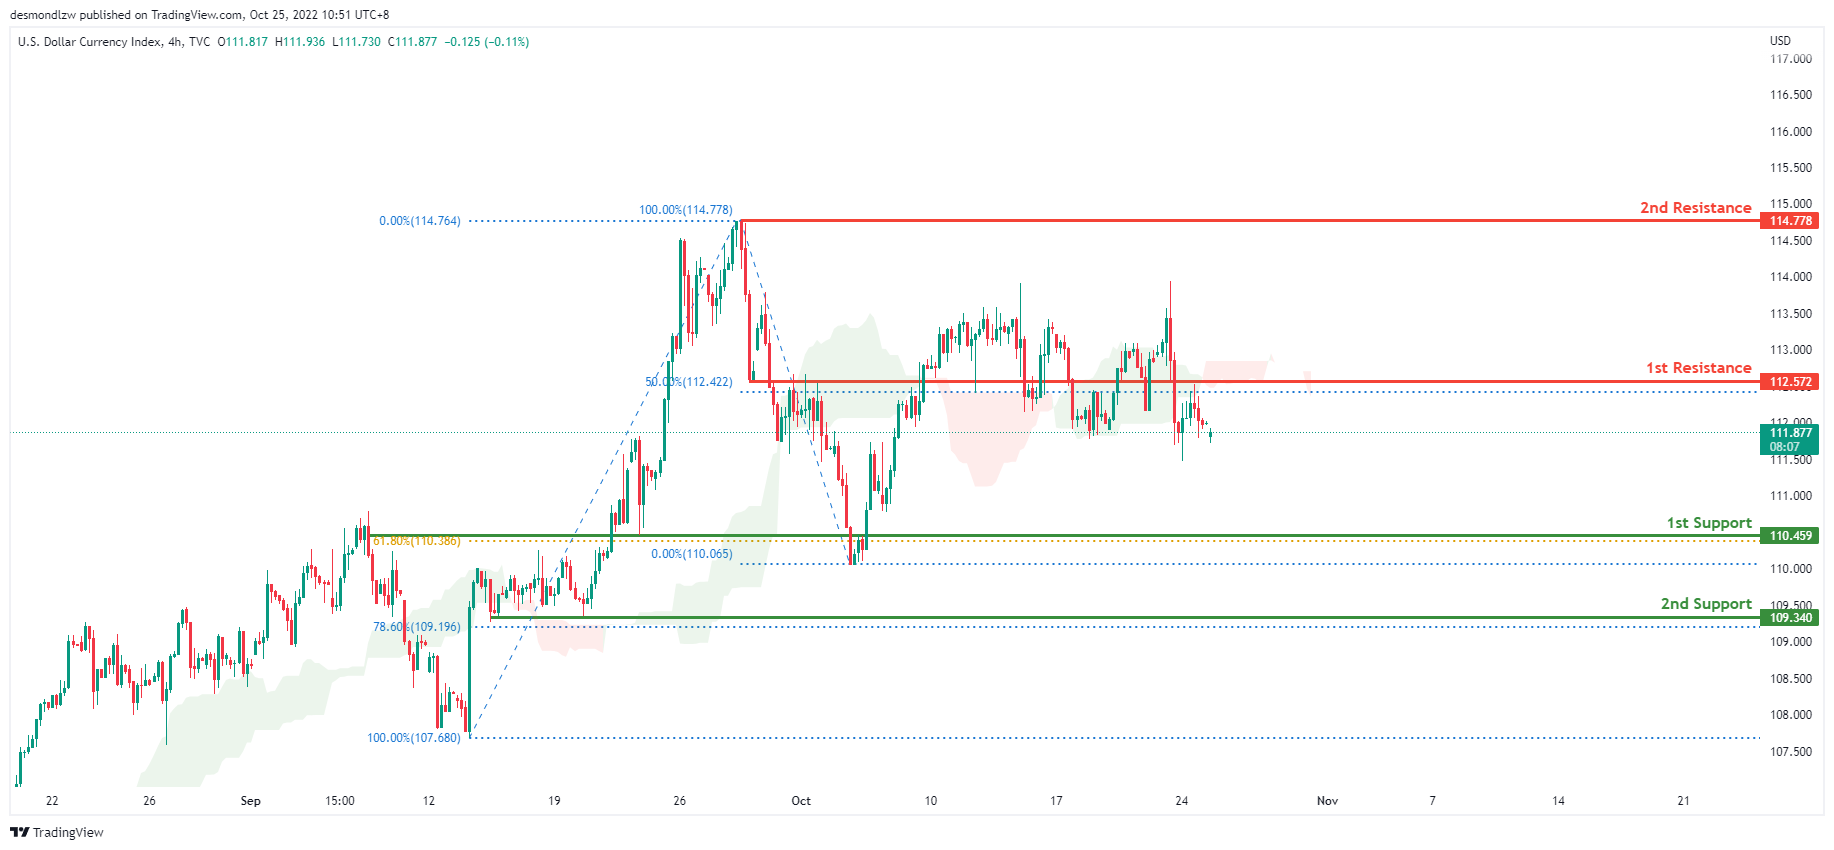
DXY:
On the H4 chart, the overall bias for DXY is bearish. To add confluence to this, the price is below the Ichimoku cloud which indicates a bearish market. If this bearish momentum continues, expect price to possibly head towards the 1st support at 110.459 where the 61.8% Fibonacci line is located.
Areas of consideration:
- H4 time frame, 1st resistance at 114.759
- H4 time frame, 1st support at 110.084
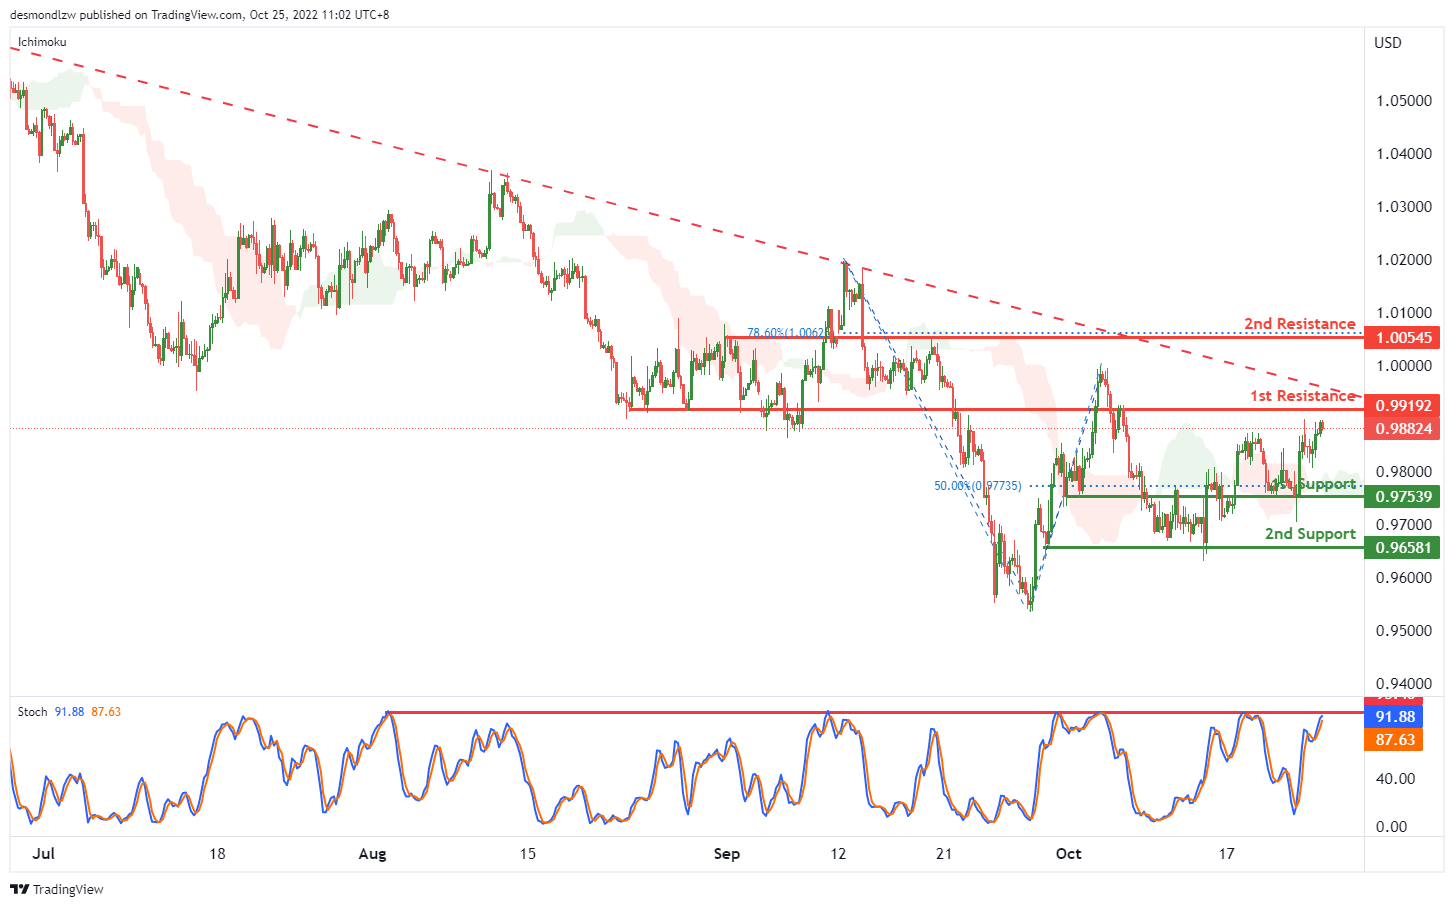
EUR/USD:
On the H4, price is moving within the descending trendline in a descending manner, with the stoch is testing the resistance, the price may drop from the 1st resistance at 0.99192, which is in line with the overlap resistance to the 1st support at 0.97539, where the overlap support and 50% fibonacci retracement are. If the 1st support is broken, the 2nd support is at 0.96581, which is in line with the swing low. Alternatively, the price may break the 1st resistance and rise to the 2nd resistance at 1.00545, where the 78.6% fibonacci retracement sits.
Areas of consideration :
- H4 1st resistance at 0.99192
- H4 1st support at 0.97539
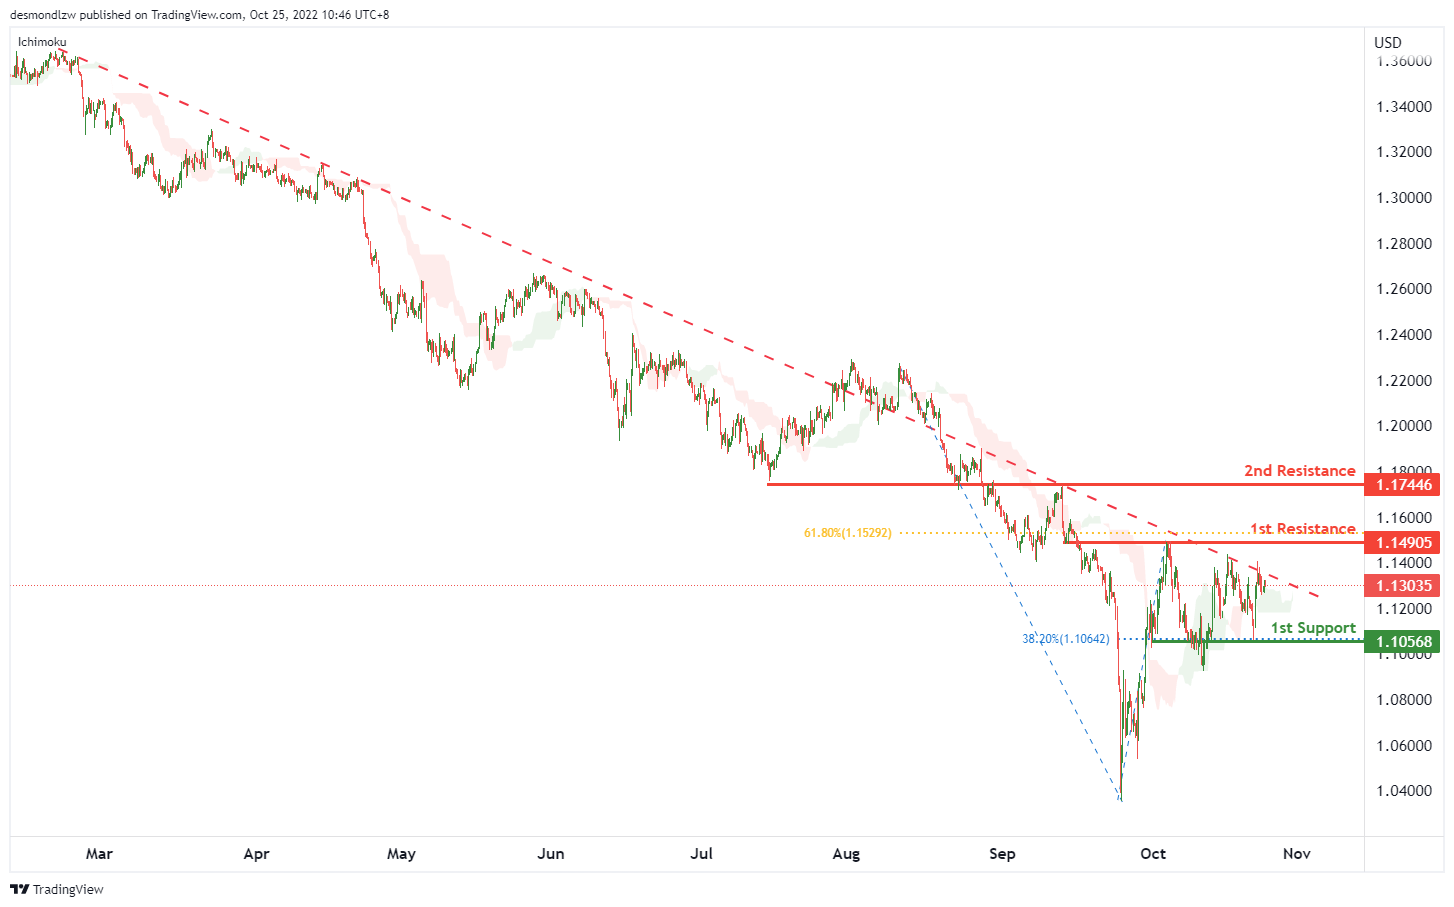
GBP/USD:
On the H4, price is crossing ichimoku cloud and testing the descending trendline, we have a bullish bias that the price may test the 1st resistance at 1.14905, which is in line with the overlap resistance and 61.8% fibonacci retracement. If the 1st resistance is broken, the 2nd resistance is at 1.17446, where the overlap resistance is. Alternatively, the price may drop to the 1st support at 1.10568, where the swing low support and 38.2% fibonacci retracement are.
Areas of consideration:
- H4 1st resistance at 1.14905
- H4 1st support at 1.10568
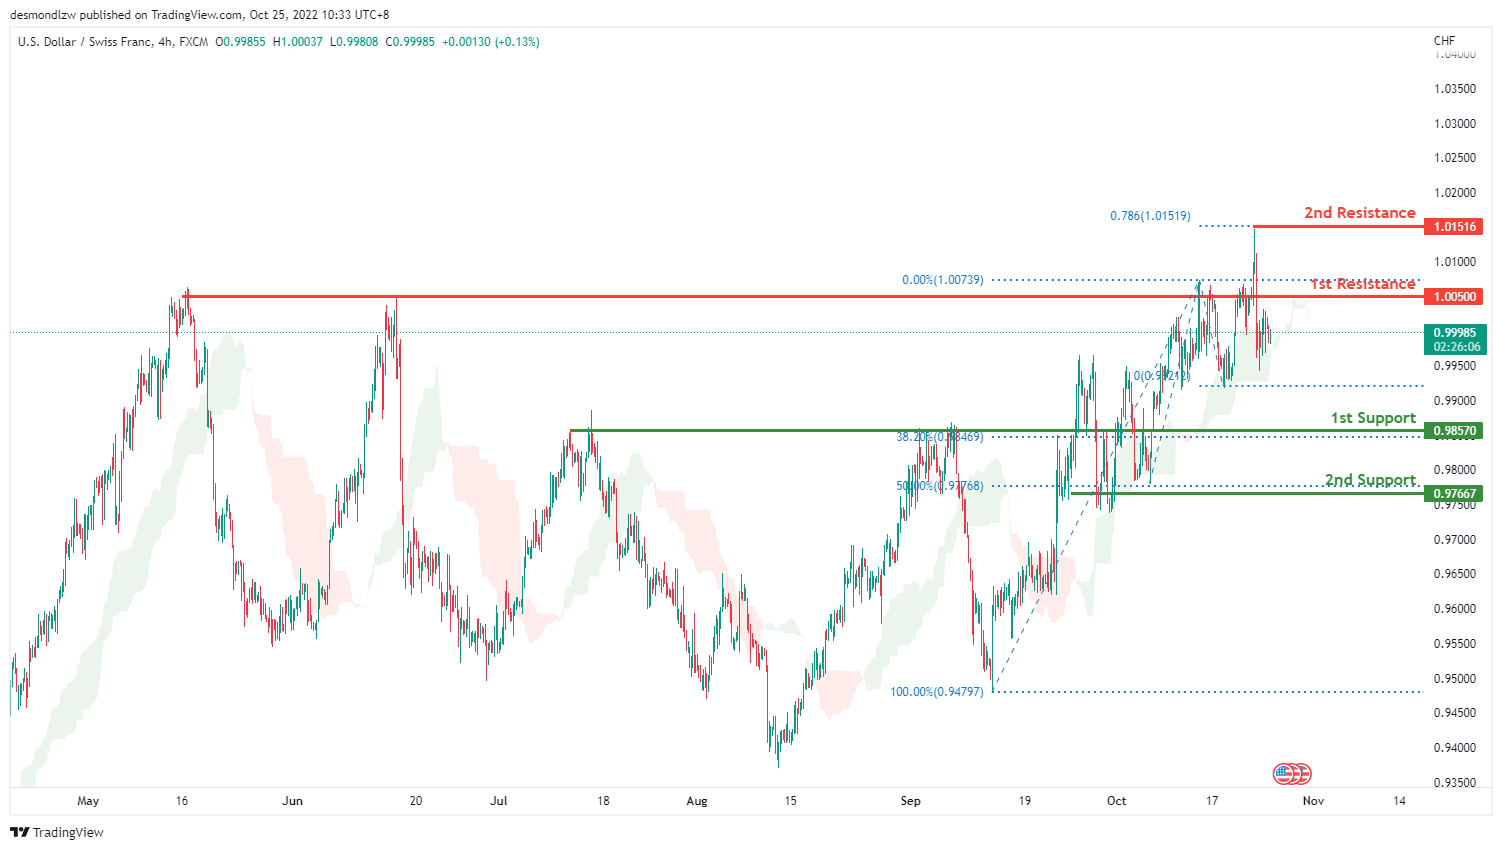
USD/CHF:
On the H4 chart, the overall bias for USDCHF is bullish. To add confluence to this, the price is above the Ichimoku cloud which indicates a bullish market. Price has tapped the 2nd resistance at 1.01516 before reflecting back down below the 1st resistance. Expecting price to go back up to retest the 1st resistance at 1.00500 if this bullish momentum continues.
Areas of consideration
- H4 1st support at 0.9857
- H4 1st resistance at 1.0050
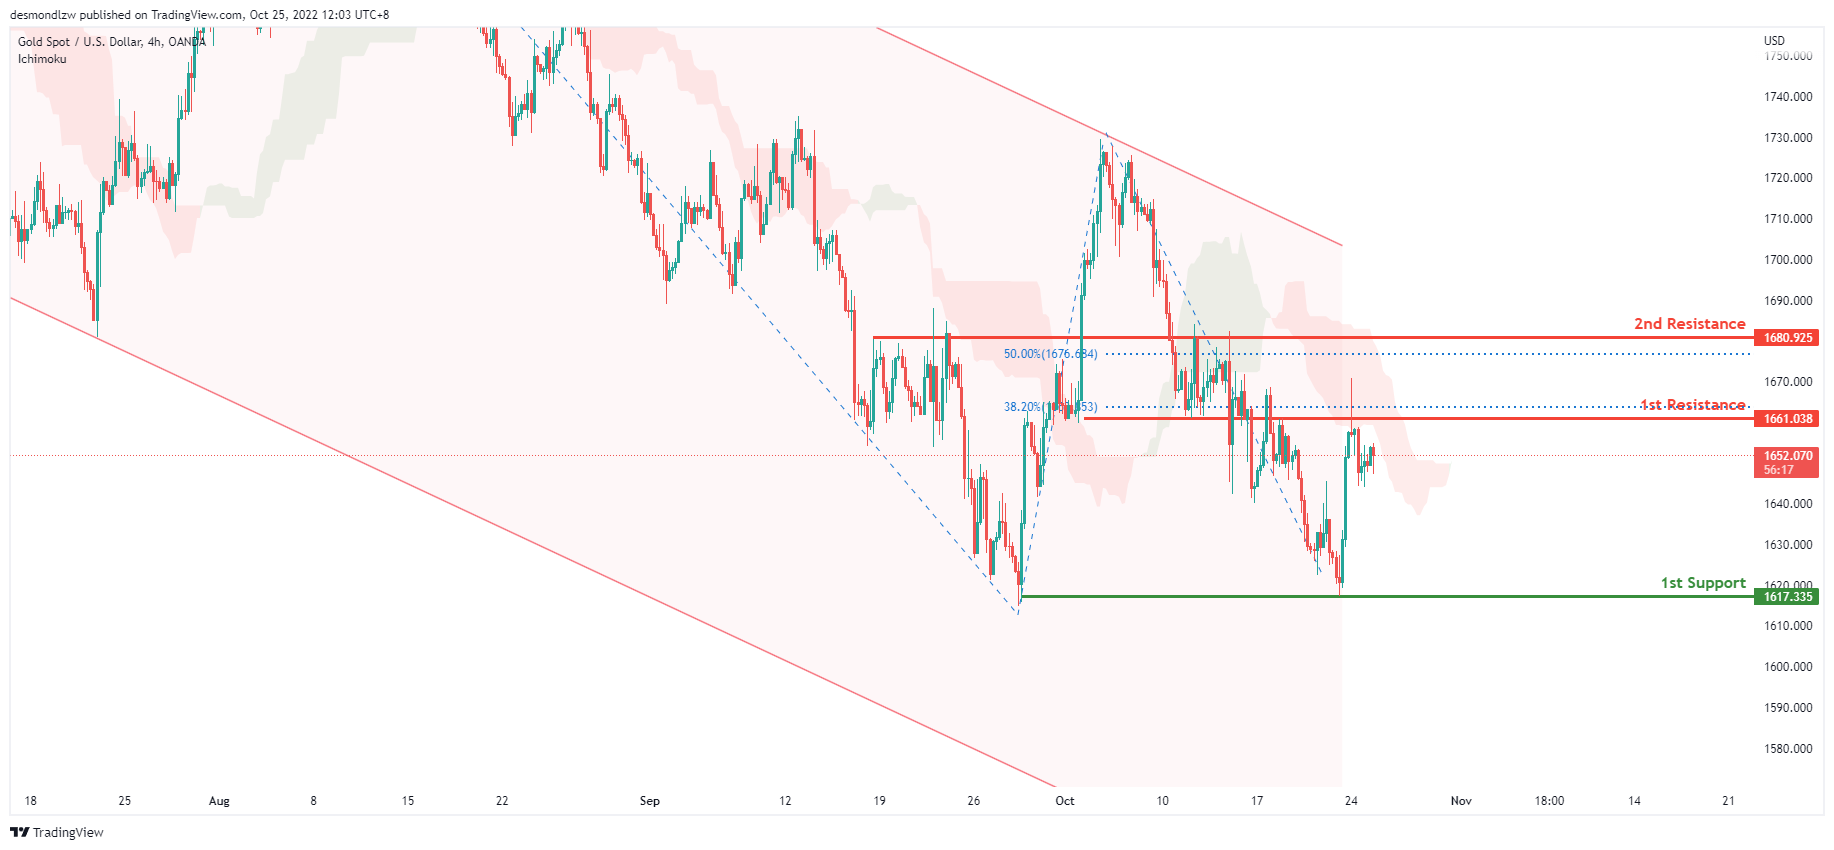
XAU/USD (GOLD):
On the H4 chart, the overall bias for XAUUSDis bearish. To add confluence to this, the price is below the Ichimoku cloud which indicates a bearish market. Price has tapped onto the 1st resistance at 1661.038 where the 38.2% Fibonacci line is located before reflecting back down. Expecting price to possibly head back up to retest the 1st resistance.
Areas of consideration:
- H4 time frame, 1st support at 1617.335
- H4 time frame, 1st resistance at 1661.038
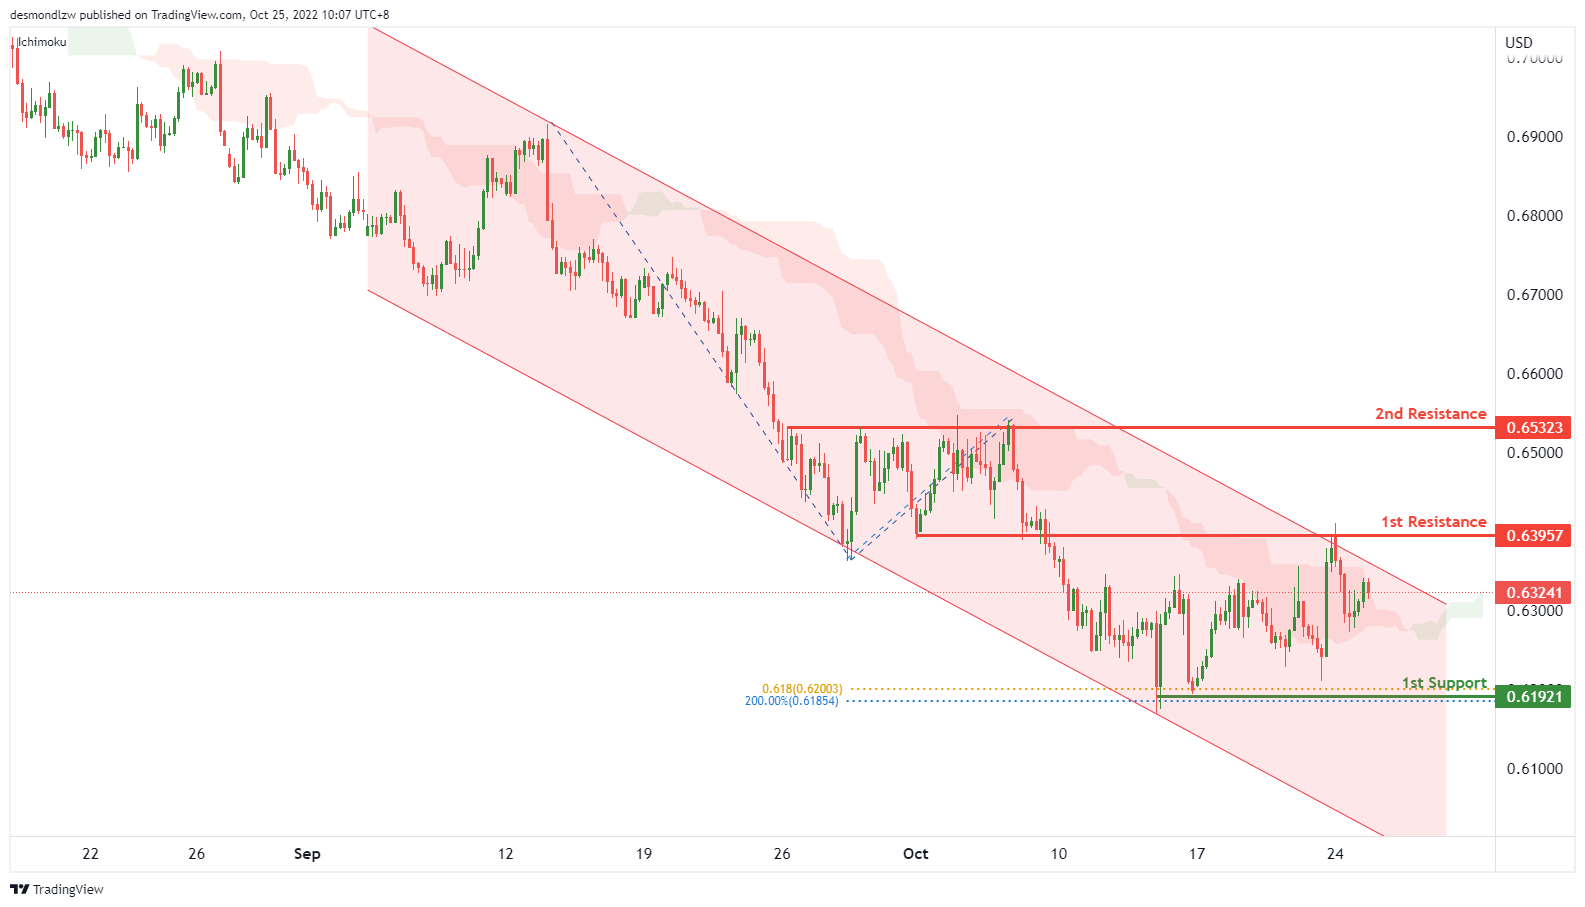
AUD/USD:
On the H4, with the price below the descending channel and ichimoku cloud, we have a bearish bias that the price may drop to the 1st support at 0.61921, where the previous swing low, 61.8% fibonacci projection and 200% fibonacci extension are. Alternatively, the price may rise to the 1st resistance at 0.63957, which is in line with the overlap resistance, if the 1st resistance is broken, the 2nd resistance could be at 0.65323, where the previous overlap resistance is.
Areas of consideration
- H4, 1st resistance at 0.63957
- H4, 1st support at 0.61921
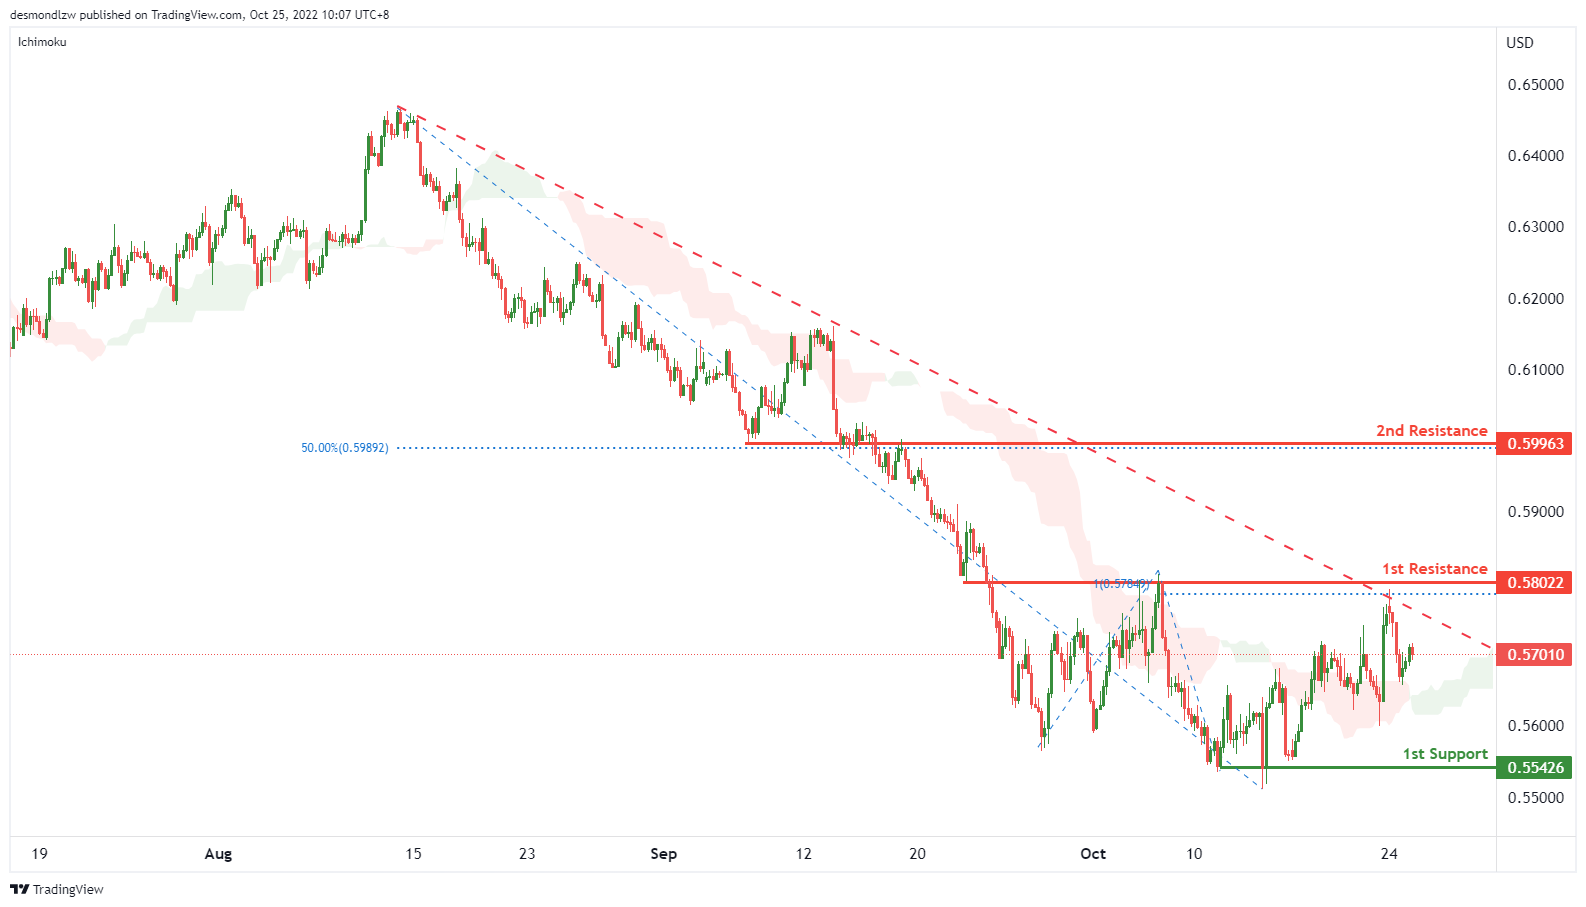
NZD/USD:
On the H4 chart, as the price is below the descending trendline, the overall bias for NZDUSD is bearish. However, price is above the Ichimoku cloud which might indicate a short term bullish market. Expecting price to possibly break above the 1st resistance at 0.58022, which is in line with the overlap resistance and 100% fibonacci projection, and possibly head towards the 2nd resistance at 0.59963 where the 50% Fibonacci line and overlap resistance are located. Alternatively, the price may continue the bearish trend and drop to the 1st support at 0.55426.
Areas of consideration:
- H4 time frame, current price
- H4 time frame, 1st resistance at 0.58022
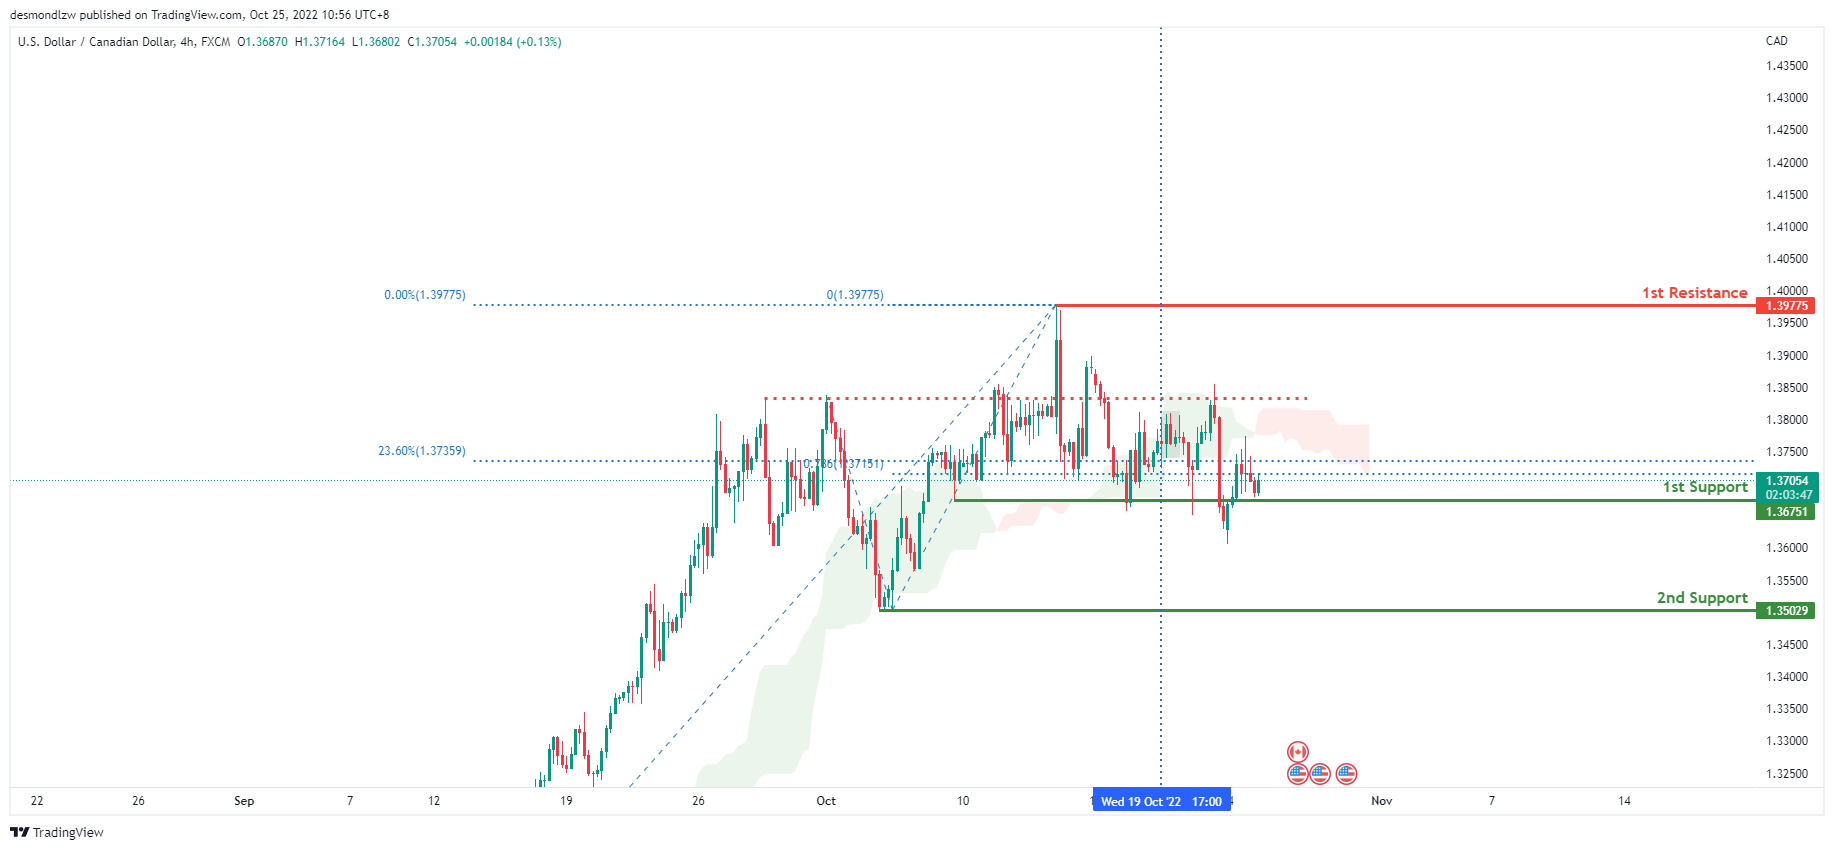
USD/CAD:
On the H4 chart, the overall bias for USDCAD is bearish. To add confluence to this, the price is below the Ichimoku cloud which indicates a bearish market. Price is currently resting on the 1st support at 1.36751 where the 23.6% Fibonacci line and 78.6% Fibonacci projection line is located. If this bearish momentum continues, expect price to possibly head down below the 1st support and towards the 2nd support at 1.35029 where the previous low is.
Areas of consideration:
- H4 time frame, 1st resistance at 1.3967
- H4 time frame, 1st support at 1.36751
- H4 time frame, 2nd support at 1.35029
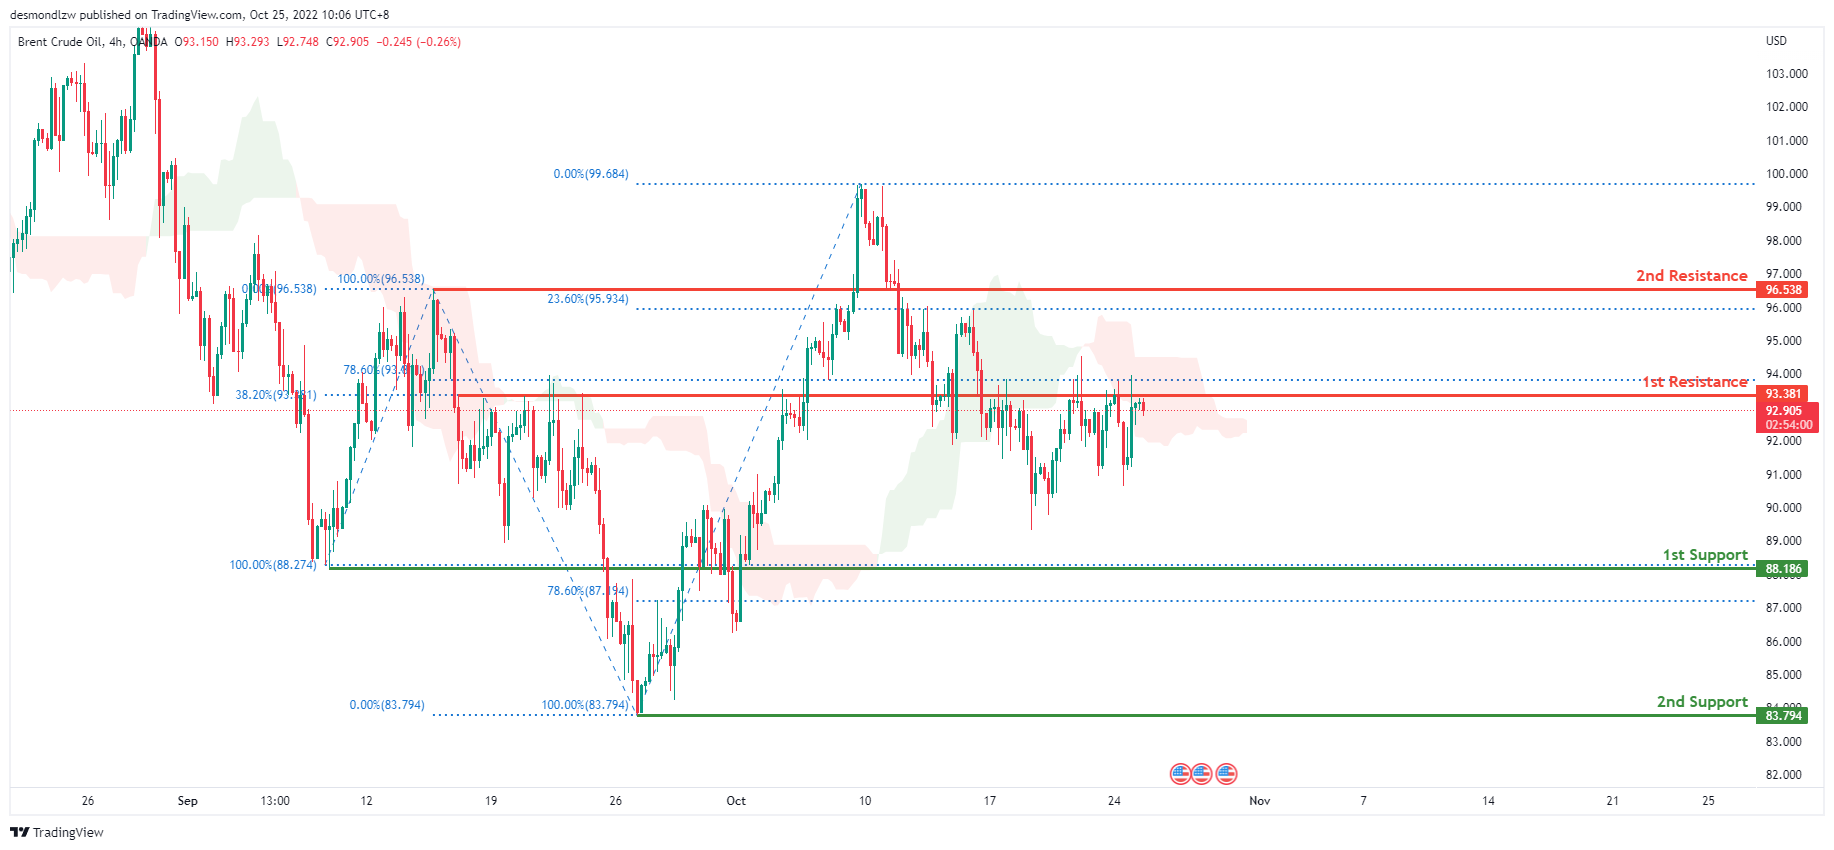
OIL:
Looking at the H4 chart, the current overall bias for Oil is bearish. The price continued consolidating underneath the 1st resistance line at 93.381 where the 38.2% and 78.6% Fibonacci lines are located. Expecting the price to head towards the 1st support at 88.186 where the 100% and 78.6% Fibonacci lines are located if this bearish momentum continues.
Areas of consideration:
- H4 time frame, 1st resistance at 93.381
- H4 time frame, 1st support at 88.1
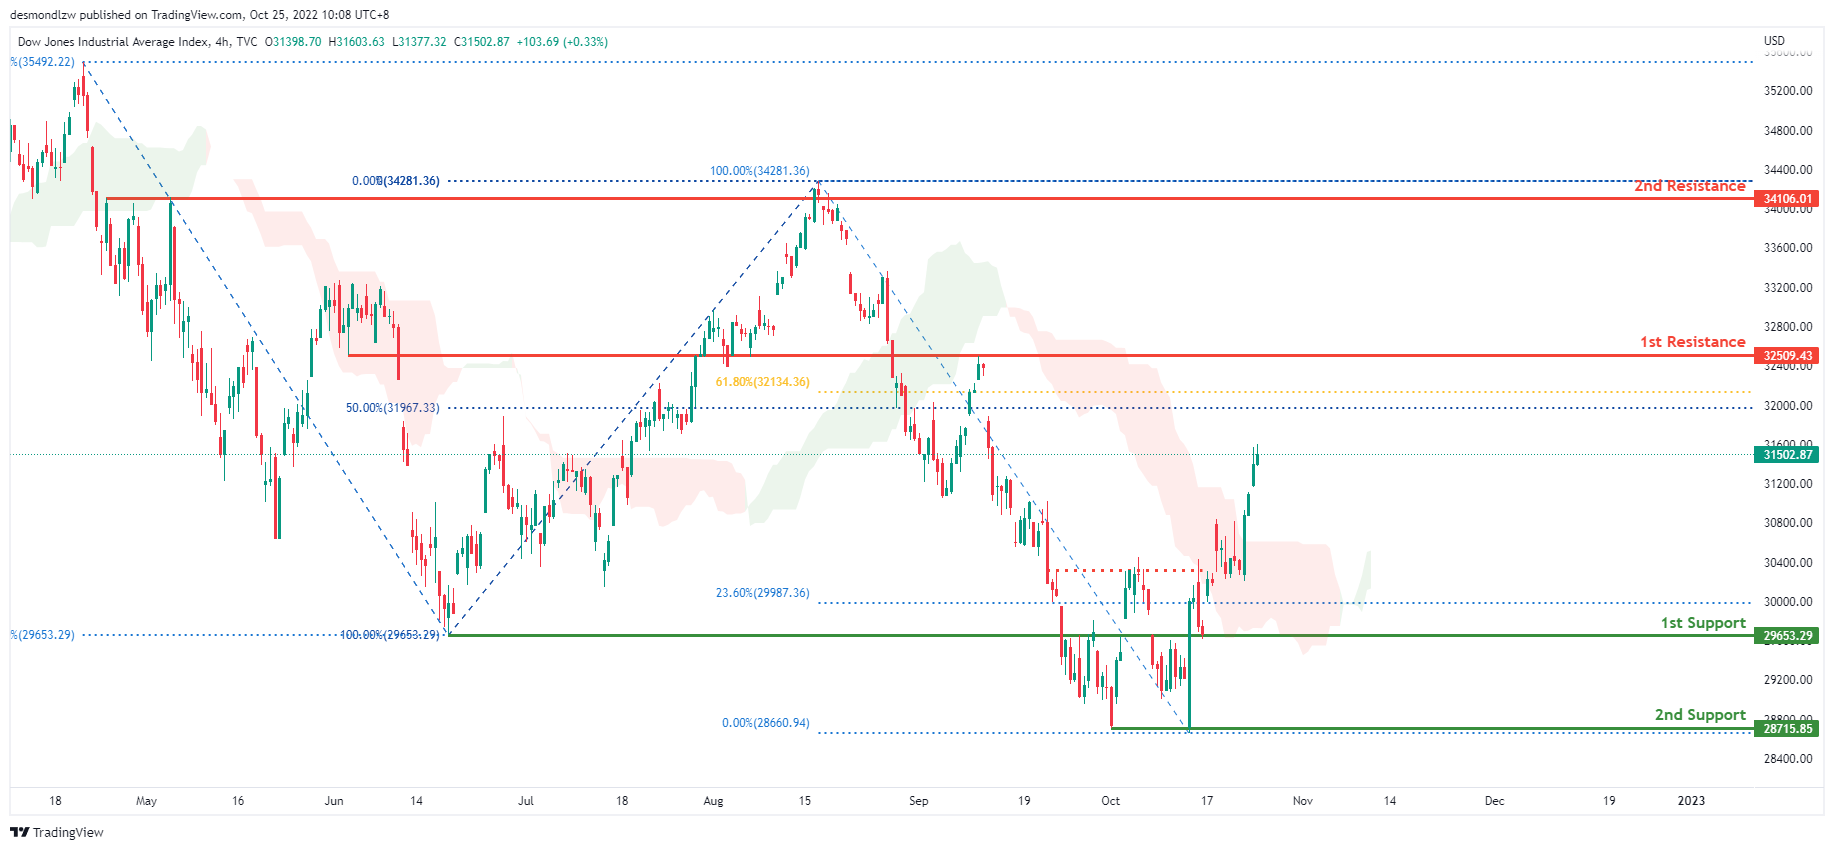
Dow Jones Industrial Average:
On the H4 chart, the overall bias for DJI is bullish. To add confluence to this, the price is above the Ichimoku cloud which indicates a bullish market. Expecting price to head towards the 1st resistance at 32509.43, where the 61.8% and 50% Fibonacci lines are located if this bullish momentum continues.
Areas of consideration:
- H4 time frame, 1st support at 29653.29
- H4 time frame, 2nd support at 28715.85
- H4 time frame, 1st Resistance at 32509.43
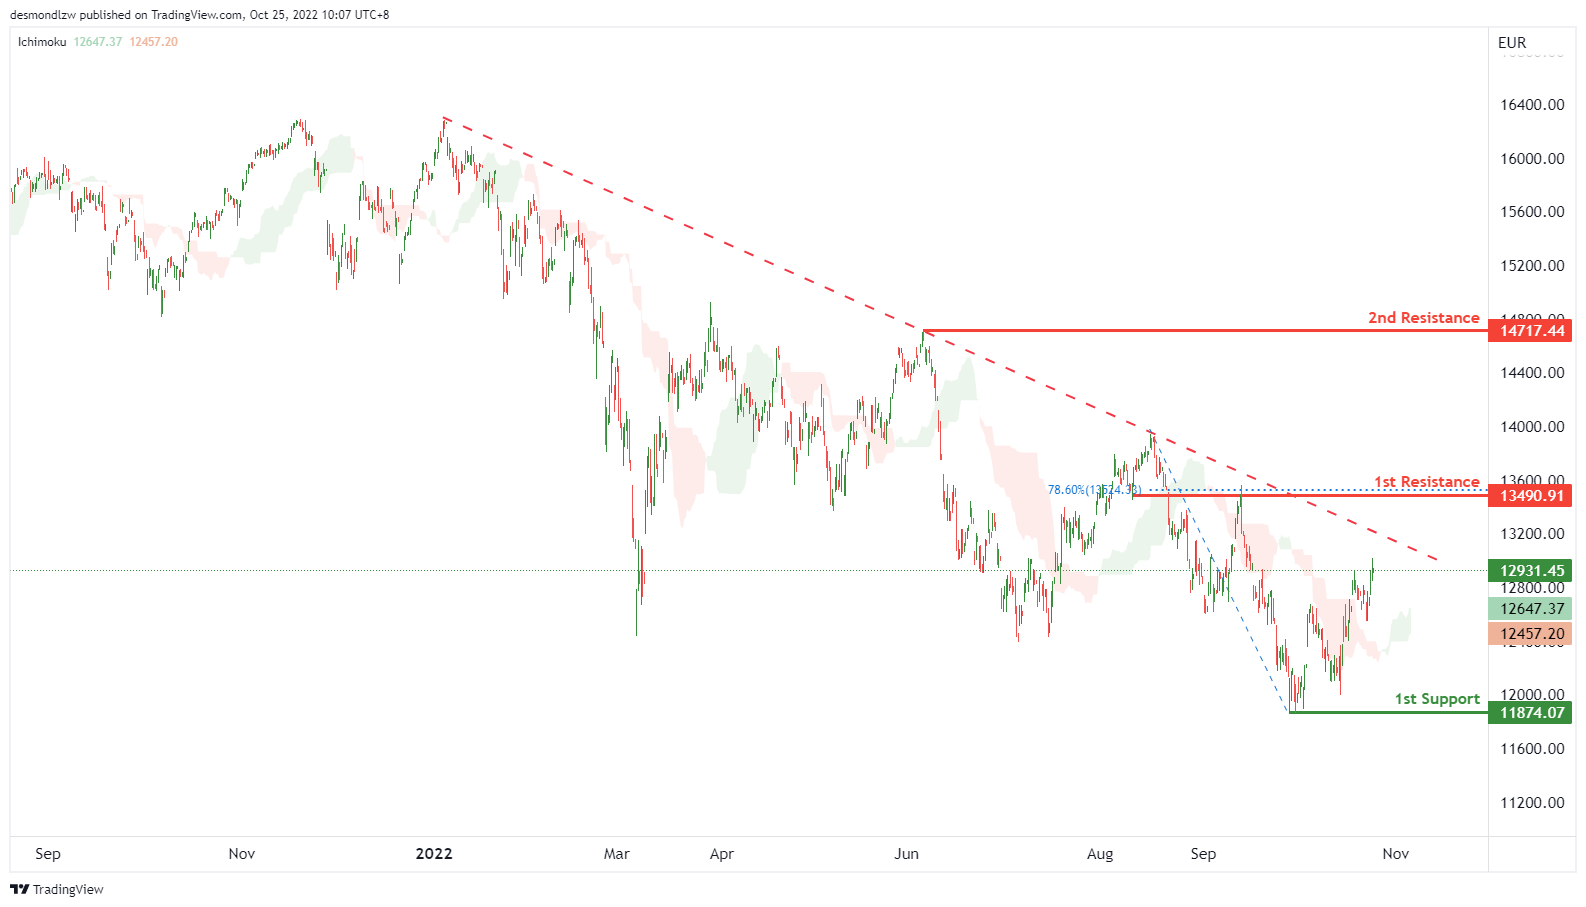
DAX:
On the H4 chart, the overall bias for DAX is bearish. However, price has now closed above the Ichimoku cloud which indicates a change to bullish market momentum. Expecting price to possibly continue this bullish momentum and head towards the 1st resistance at 13490.91, where the 78.6% Fibonacci line is located. If the 1st resistance is broken, the 2nd resistance could be at 14717.44, which is in line with the previous swing high. Alternatively, the price may drop to the 1st support at 11874.07, which is in line with the swing low.
Areas of consideration:
- H4 time frame, current price
- H4 time frame, 1st resistance at 13490.9
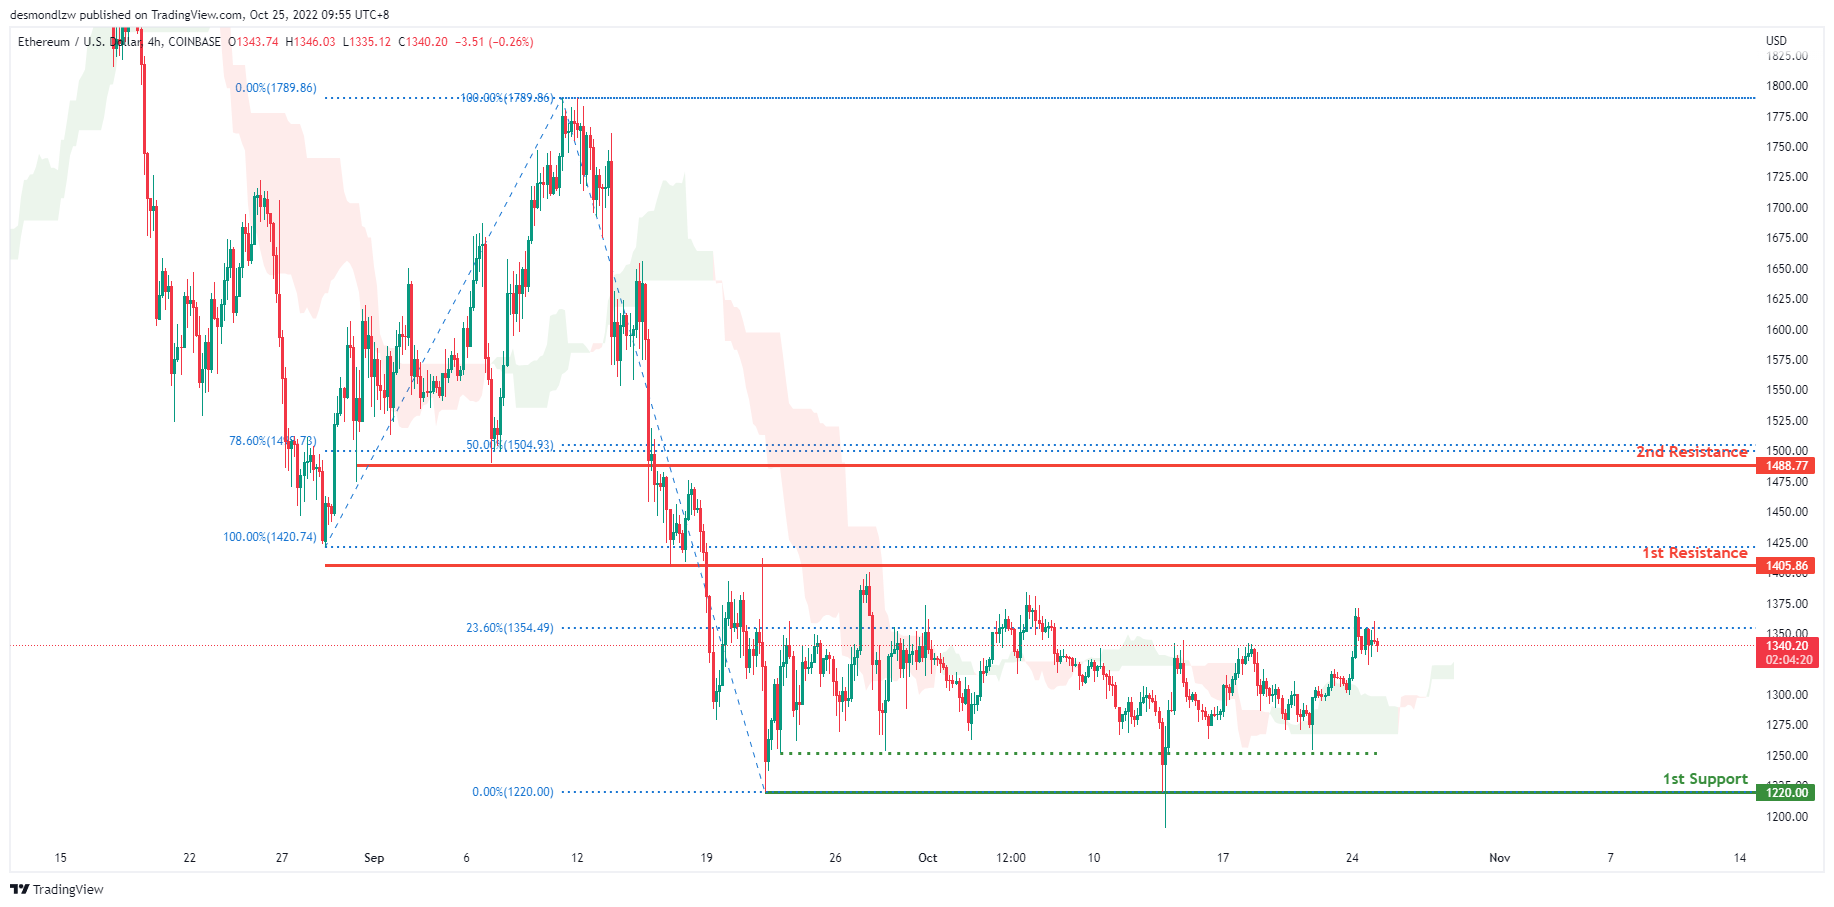
ETHUSD:
Looking at the H4 chart, the current overall bias for ETHUSD is bearish. However, price has closed above the Ichimoku cloud which might indicate a short term bullish momentum. For the past 1 month, price has been consolidating between the 1st resistance at 1405.86 and 1st support at 1405.86. Expecting price to head towards the 1st resistance at 1405.86 if this bullish momentum continues.
Areas of consideration:
- H4 time frame, 1st resistance of 1405.86
- H4 time frame, 1st support at 1220.00
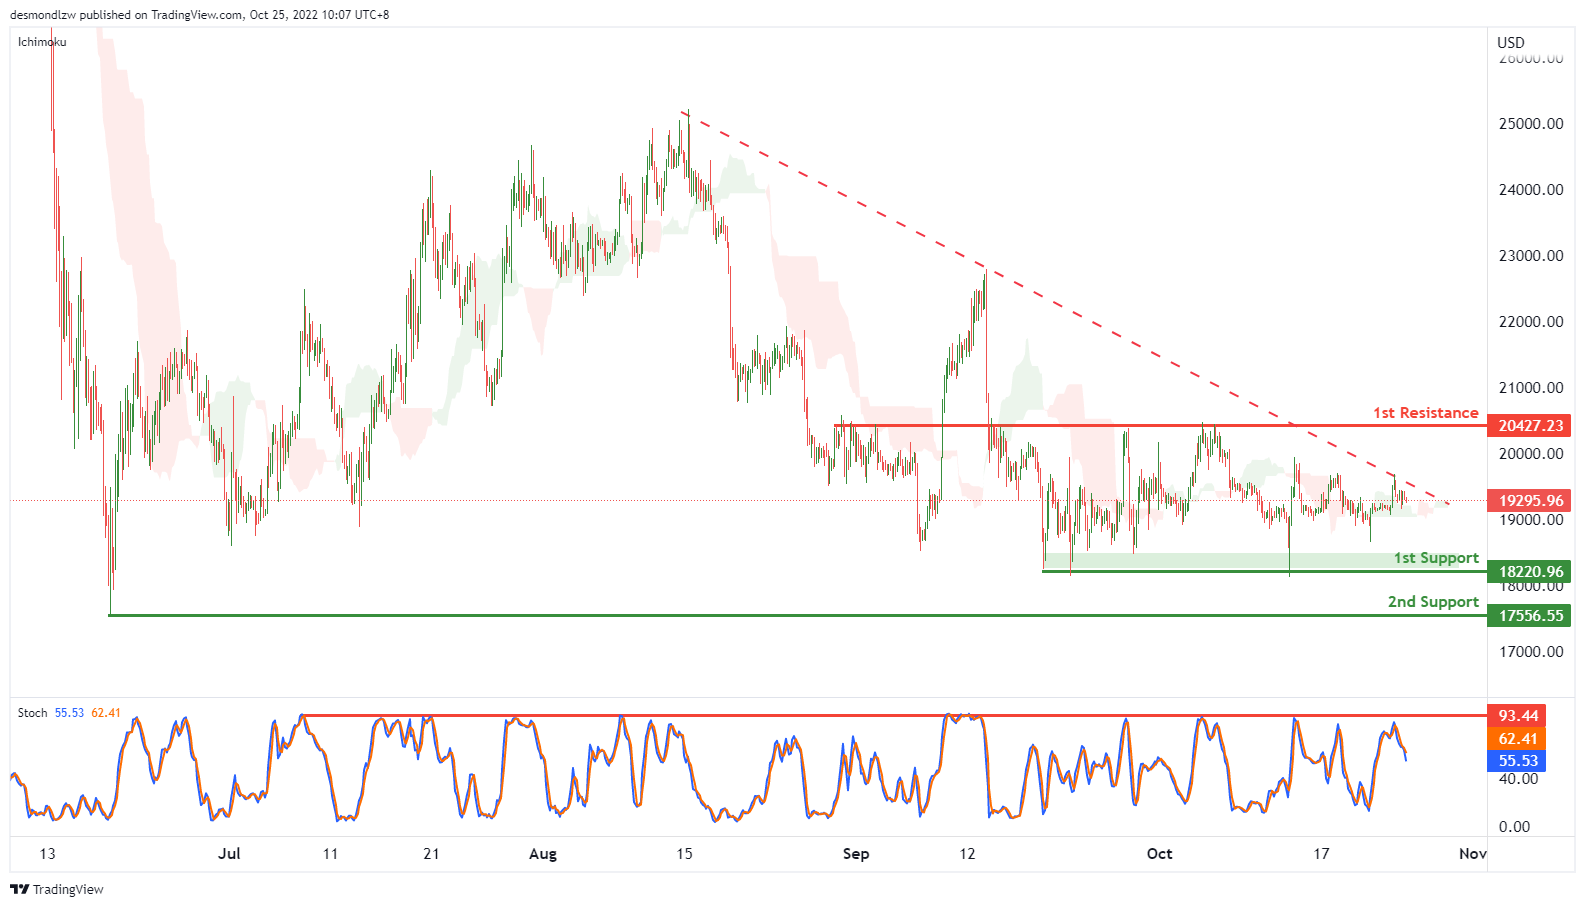
BTCUSD:
On the H4, price is crossing ichimoku cloud and below descending trendline, as well as Stoch is dropping from the resistance, we have a bearish bias that the price may drop to the 1st support at 18220.96, which is in line with the previous swing lows and if the 1st support is broken, the 2nd support is at 17556.55, where the previous swing low is. Alternatively, the price may rise to the 1st resistance at 20427.23, where the overlap resistance is
Areas of consideration:
- H4 time frame, current price
- H4 time frame, 1st support at 18220.96
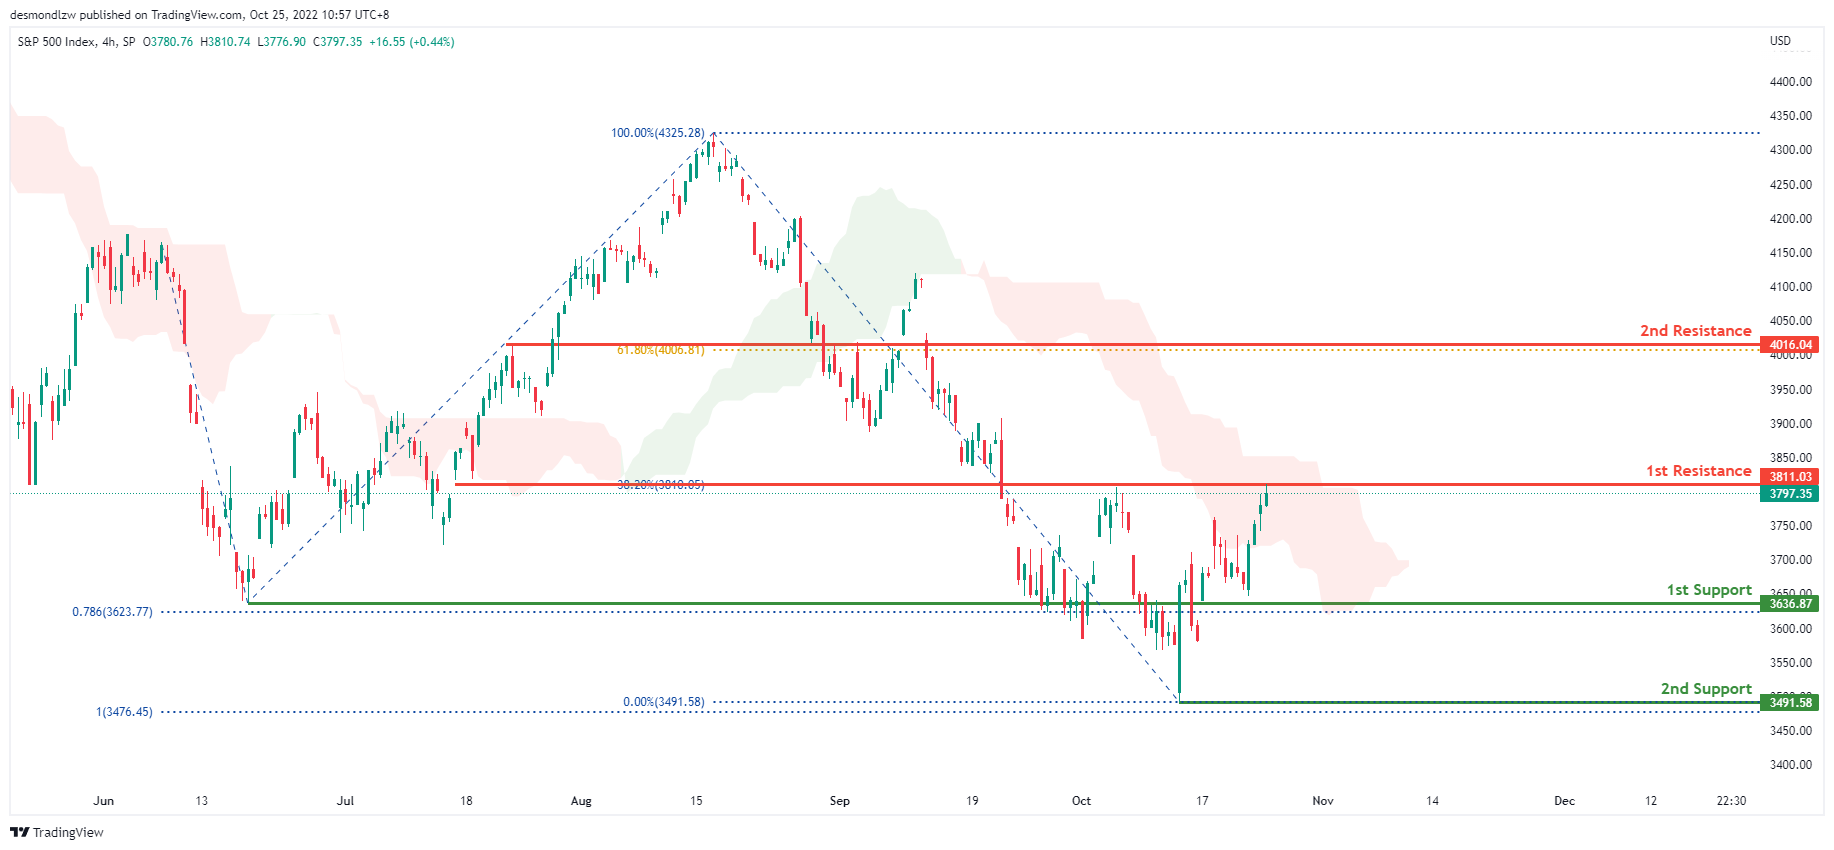
S&P 500:
On the H4 chart, the overall bias for S&P500 is bearish. Price has tapped into the 1st resistance at 3811.03 where the 38.2% Fibonacci line is located. With this short term bullish momentum, price could possibly break above the 1st resistance and head towards the 2nd resistance at 4016.04 where the 61.8% Fibonacci line is located.
Areas of consideration:
- H4 time frame, 1st support at 3492.42
- H4 time frame, 1st resistance at 3800
- H4 time frame, 2nd resistance at 4007.45


