
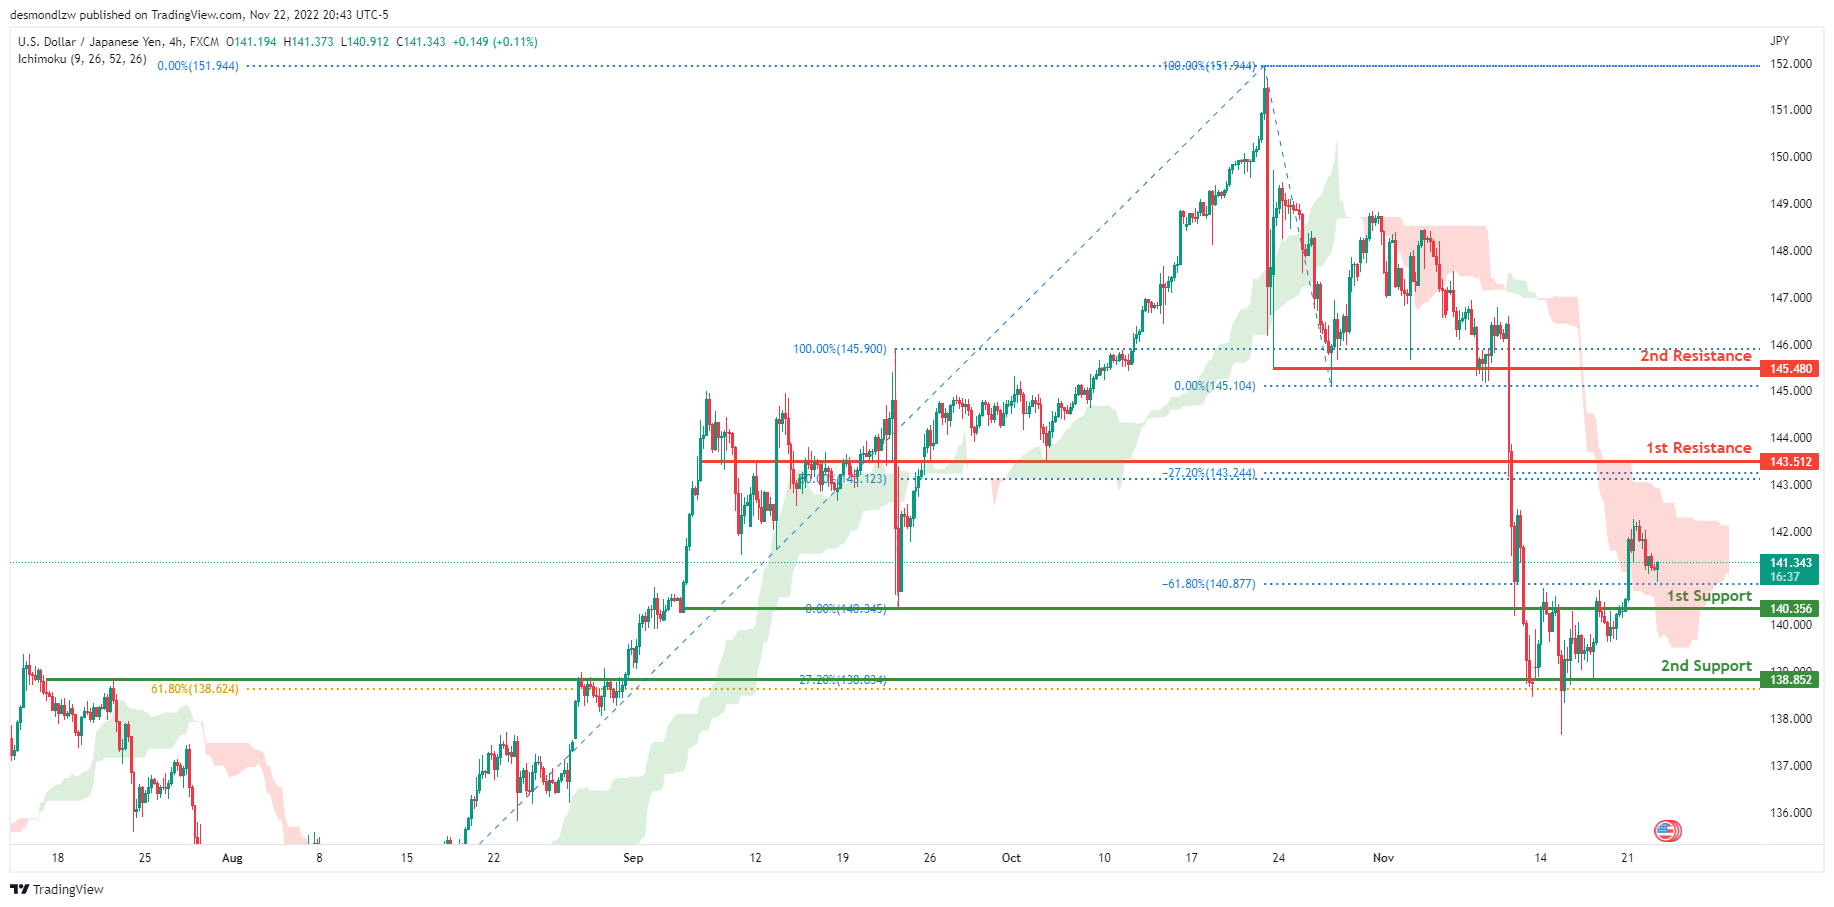
USD/JPY:
The current general bias for USDJPY on the H4 chart is bullish. To add confluence to this, the price is crossing the Ichimoku cloud which indicates a bullish market. If the bullish momentum continues, expect USDJPY to head towards the 1st resistance line at 143.512 where the -27.2% Fibonacci expansion line and 50% Fibonacci line are located .In an alternative scenario, price could go back down to retest the 1st support at 140.356, where the -61.8% Fibonacci expansion line and previous low are located
Areas of consideration:
- H4 time frame, 1st resistance at 143.512
- H4 time frame, 1st support at 140.356
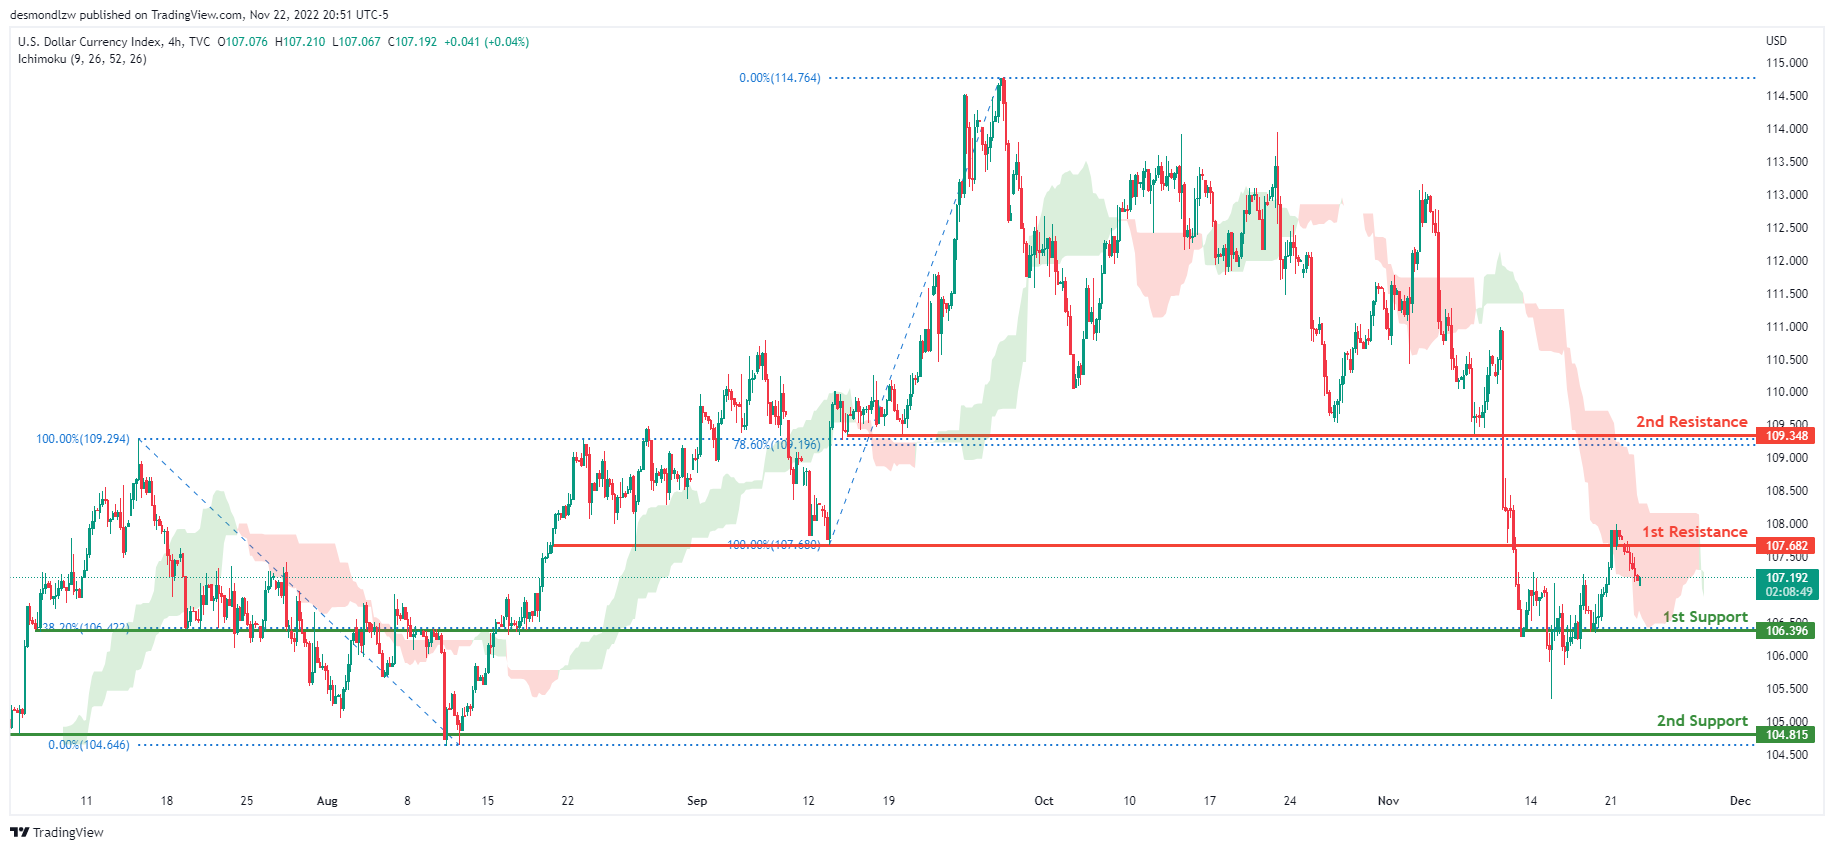
DXY:
On the H4 chart, the overall bias for DXY is bearish. To add confluence to this, the price is crossing below the Ichimoku cloud which indicates a bearish market. If this bearish momentum continues, price could break the 1st support line at 106.396 where the 38.2% fibonacci line is located, before heading towards the 2nd support at 104.815 where the previous low and the 0% Fibonacci line are located. In an alternative scenario, price could head back up and retest the 1st resistance line at 107.682, where the previous low and 100% Fibonacci line are located. If this 1st resistance line is broken, the 2nd resistance is located at 109.348, where the 78.6% Fibonacci line is located
Areas of consideration:
- H4 time frame, 1st resistance at 107.682
- H4 time frame, 2nd resistance at 109.348
- H4 time frame, 1st support at 106.396
- H4 time frame, 2nd support at 104.815
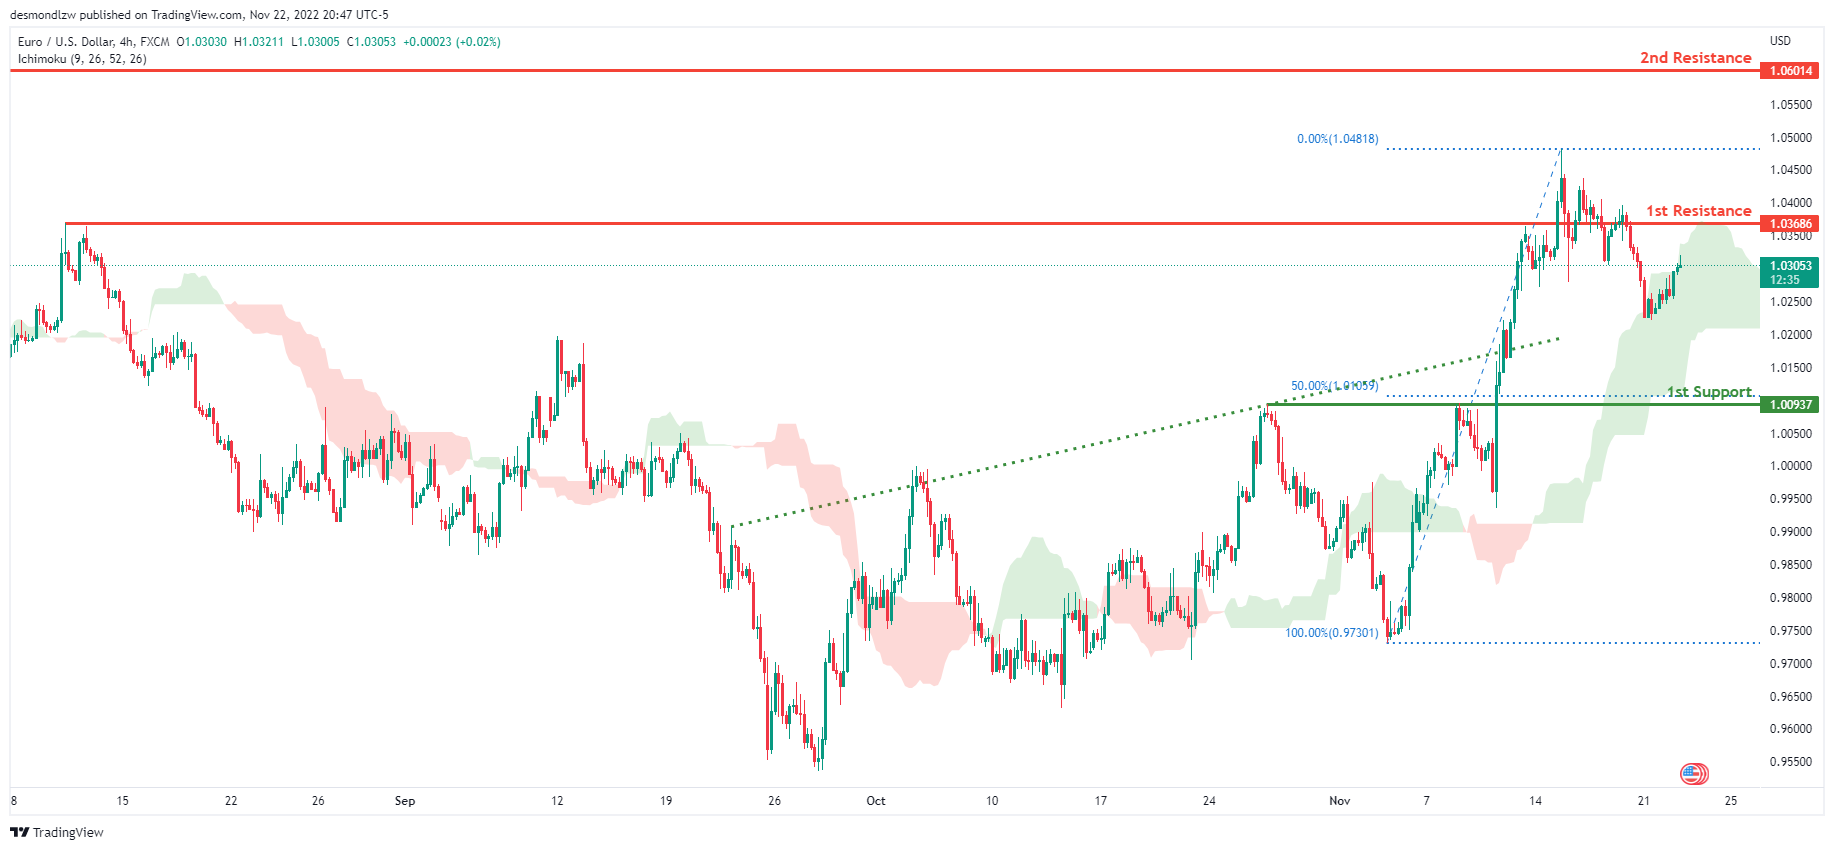
EUR/USD:
Looking at the H4 chart, my overall bias for EURUSD is bullish due to the current price being above the Ichimoku cloud, indicating a bullish market. To add confluence to this bias, price has also broken above the ascending trend line. If this bullish momentum continues, expect the price to possibly head back up to retest the 1st resistance at 1.03686, where the previous swing high is located. In an alternate scenario, price could possibly head back down towards the 1st support level at 1.00937, where the 50% Fibonacci line is located.
Areas of consideration :
- H4 1st resistance at 1.03686
- H4 1st support at 1.00937
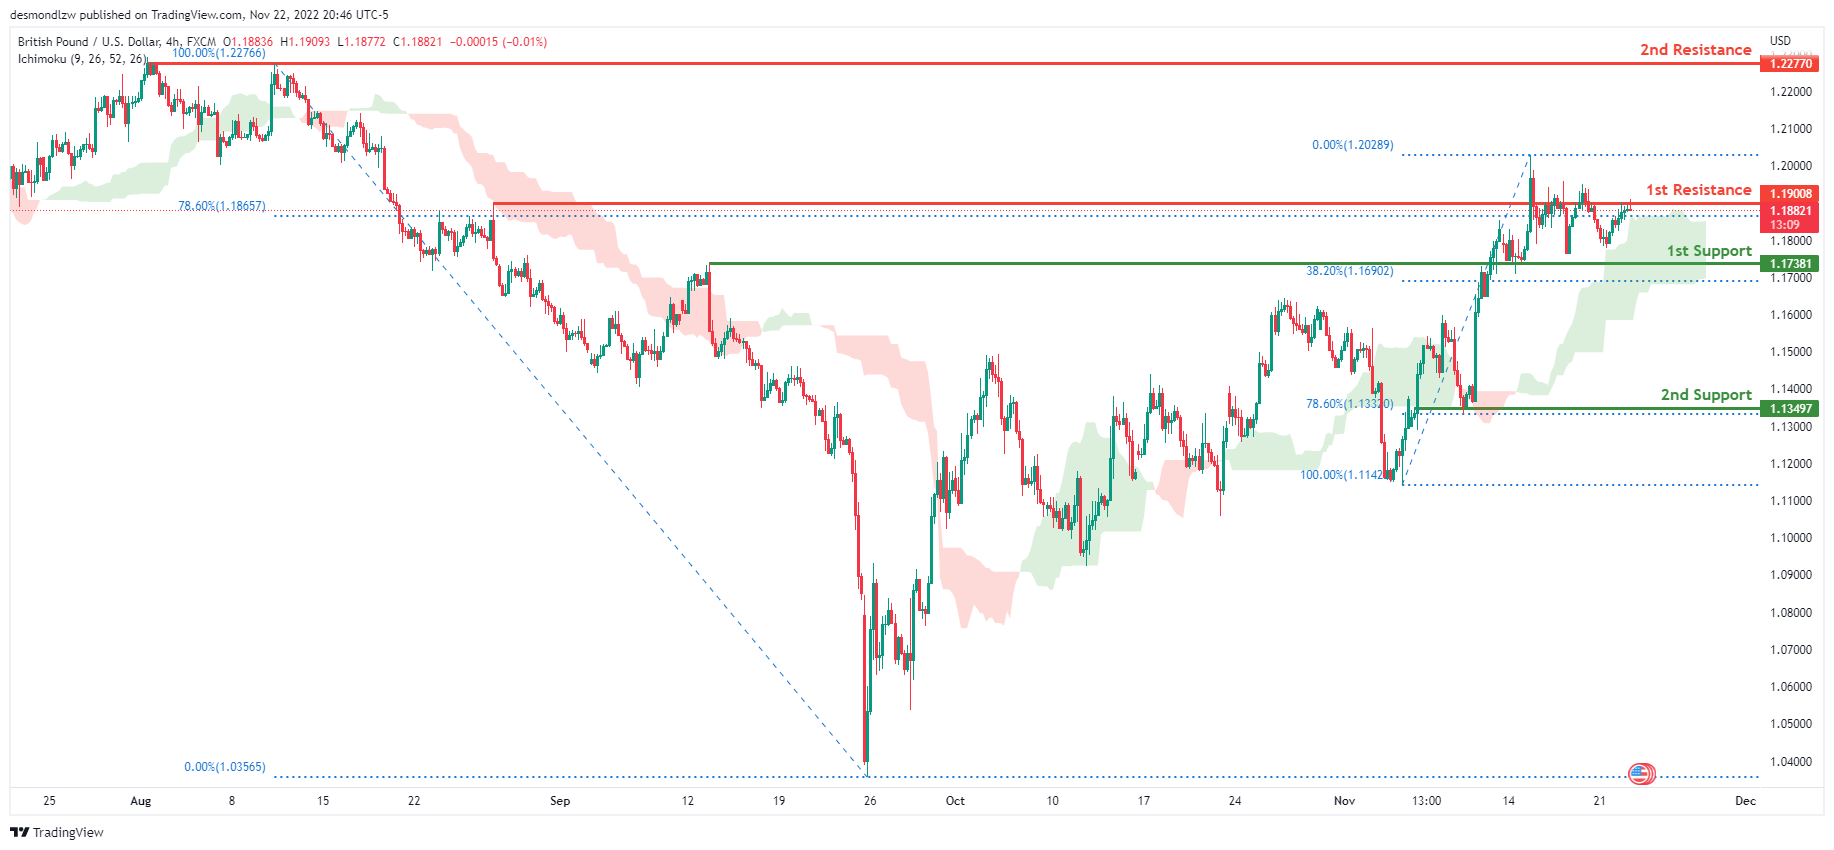
GBP/USD:
On the H4, the price is moving above the ichimoku cloud, suggesting that the price may break the first resistance level at 1.19008, which corresponds to the 78.6% fibonacci and the previous swing high, before heading to the 2nd resistance line at 1.22770, where the previous swing high is. Alternatively, the price may break the first support level at 1.17381, which is where the previous swing high and 38.2% Fibonacci line are, before moving on to the second support level at 1.13497, which is the 78.6% Fibonacci line.
Areas of consideration:
- H4 1st resistance at 1.19008
- H4 2nd resistance at 1.22770
- H4 1st support at 1.17381
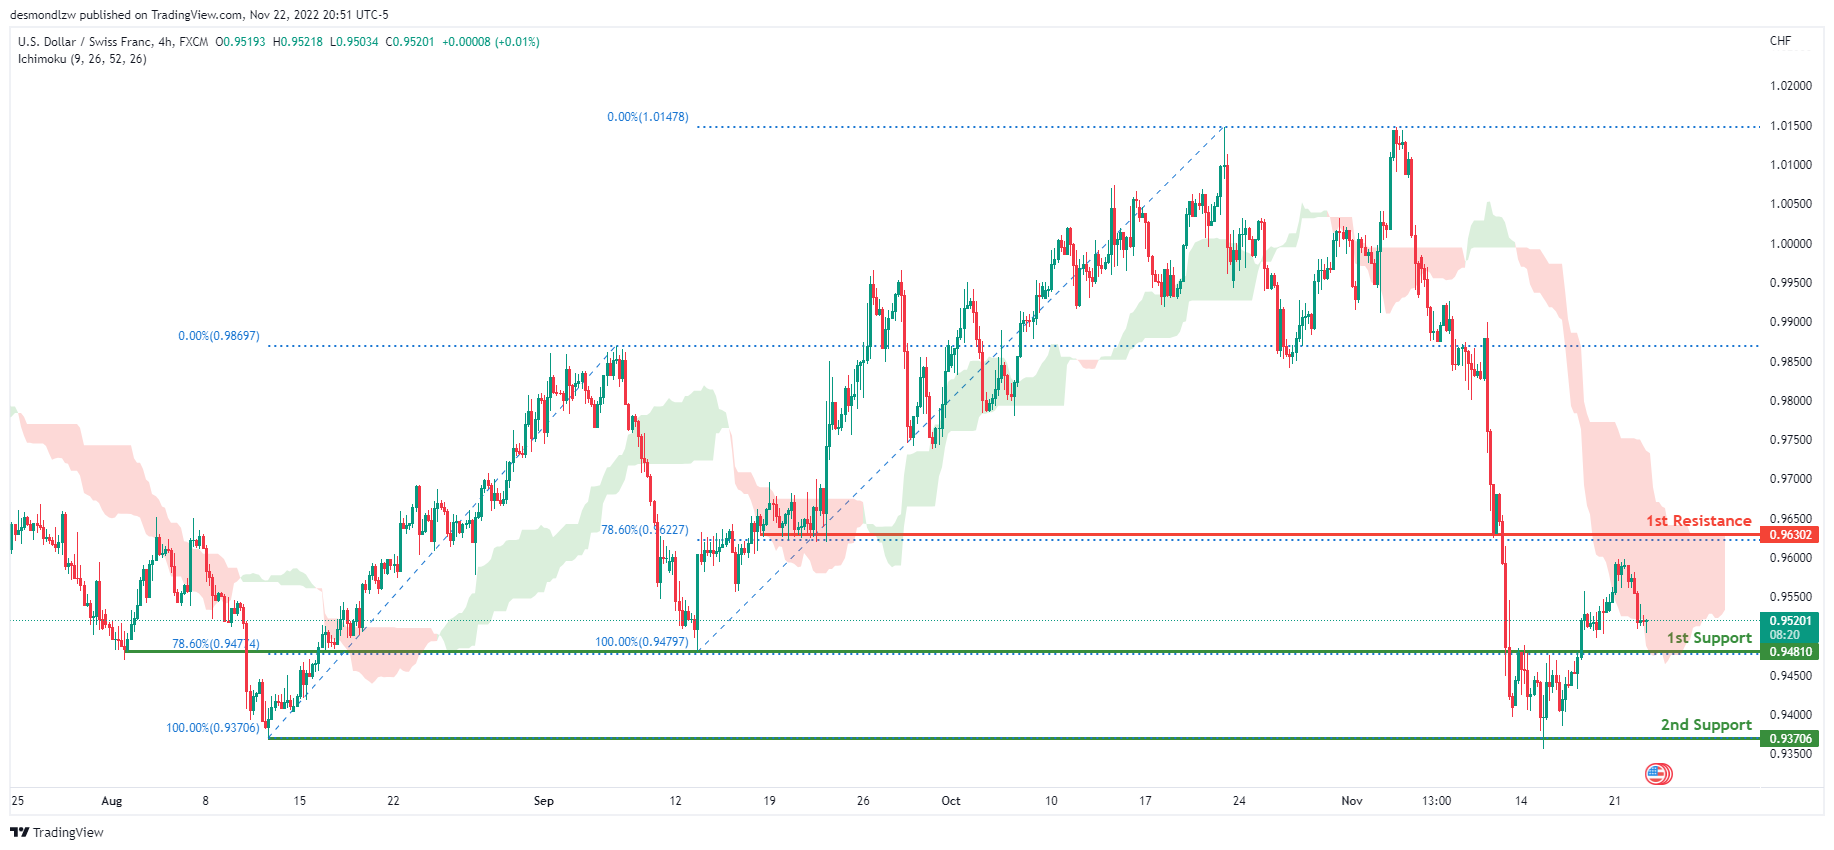
USD/CHF:
The overall bias for USDCHF on the H4 chart is bearish. In addition, the price is crossing below the Ichimoku cloud, indicating a bearish market. If the current bearish trend continues, the price might move back down to retest the first support line at 0.94810, where the 78.6% Fibonacci line is. In an alternate scenario, price could rise towards the first resistance line at 0.96302, where the 78.6% Fibonacci line is.
Areas of consideration
- H4 1st support at 0.94810
- H4 1st resistance at 0.96302
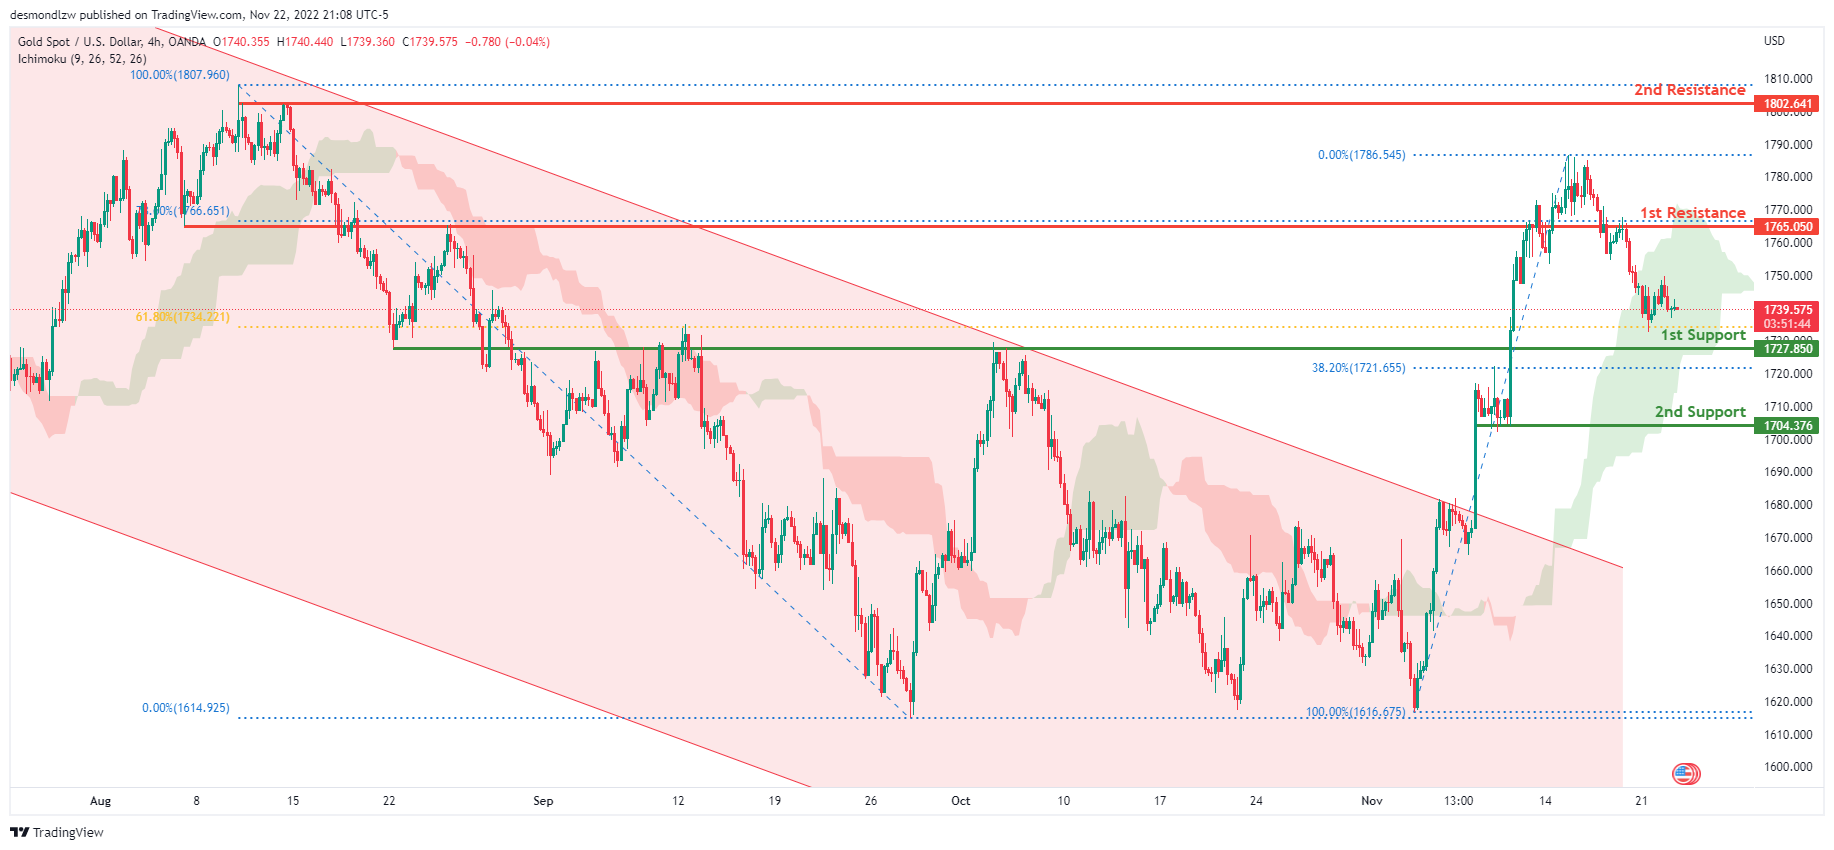
XAU/USD (GOLD):
Looking at the H4 chart, my overall bias for XAUUSD is bearish due to the current price crossing below the Ichimoku cloud, indicating a bearish market. If this bearish momentum continues, expect price to possibly head back down towards the 1st support level at 1727.850, where the 38.2% and 61.8% Fibonacci lines are located.
In an alternate scenario, price could possibly head back up towards the 1st resistance at 1765.050, where the 78.6% Fibonacci line is located.
Areas of consideration:
- H4 time frame, 1st resistance at 1765.483
- H4 time frame, 1st support at 1727.850
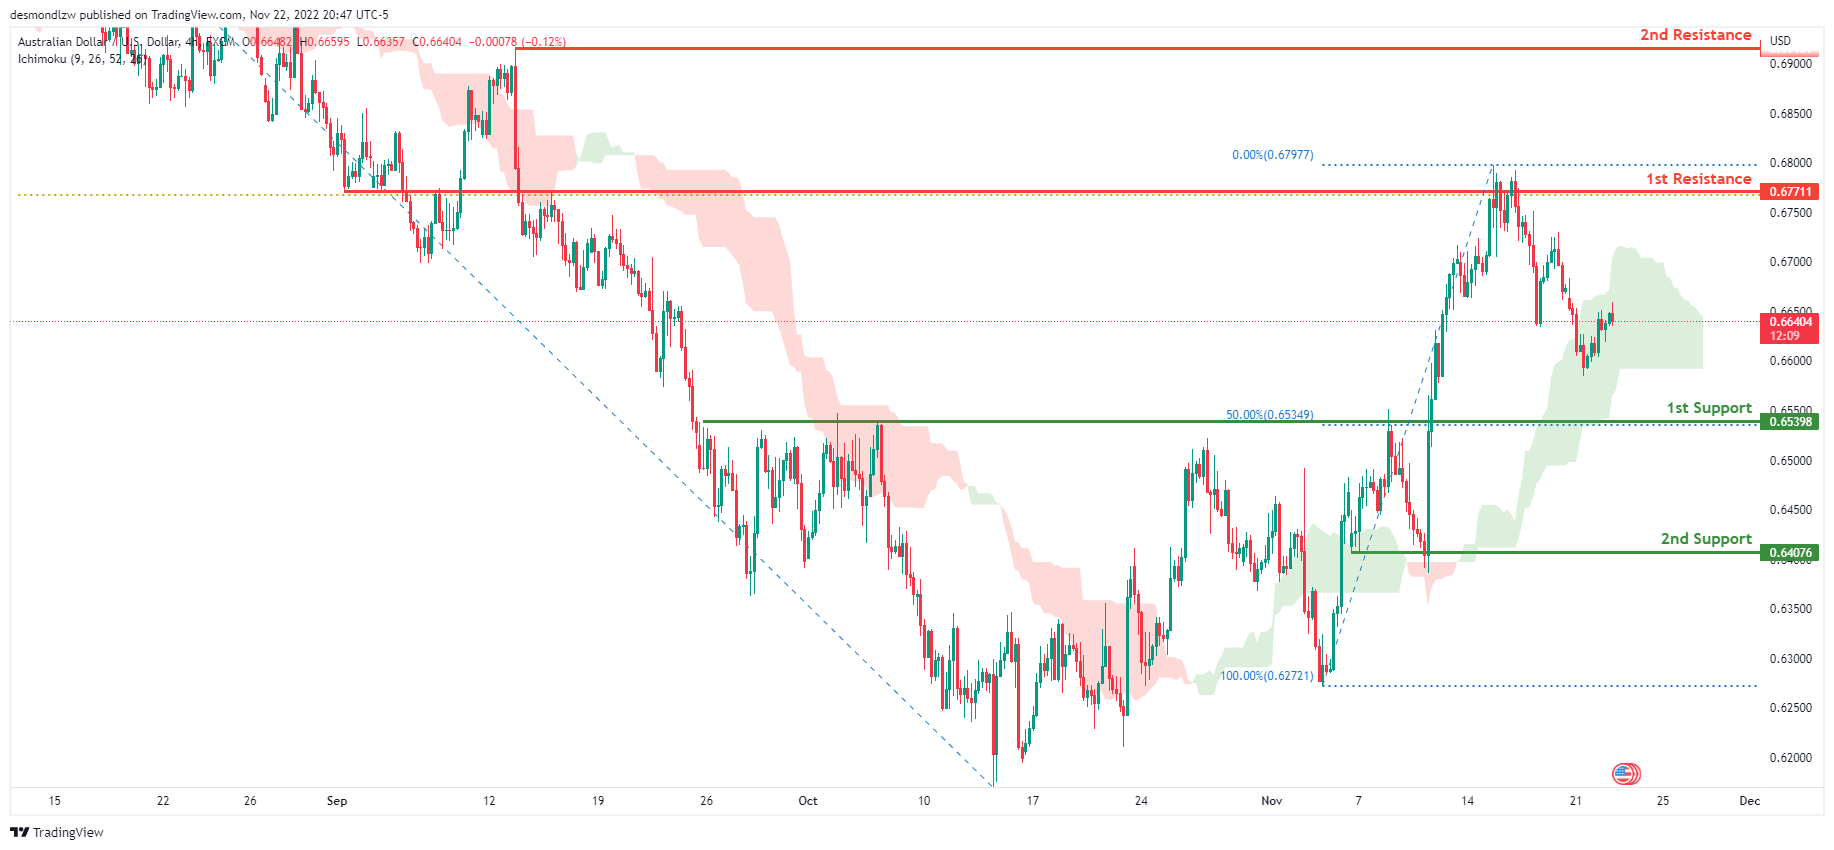
AUD/USD:
With the price crossing below the ichimoku cloud on the H4, we have a bearish bias that the price may fall to the first support level at 0.65398, which is marked by the 50% Fibonacci line. Alternatively, the price could break the first resistance at 0.67711, which is in line with the 61.8% fibonacci line, before heading towards the 2nd resistance line at 0.69161, the previous swing high.
Areas of consideration
- H4, 1st resistance at 0.67711
- H4, 2nd resistance at 0.69161
- H4, 1st support at 0.65398
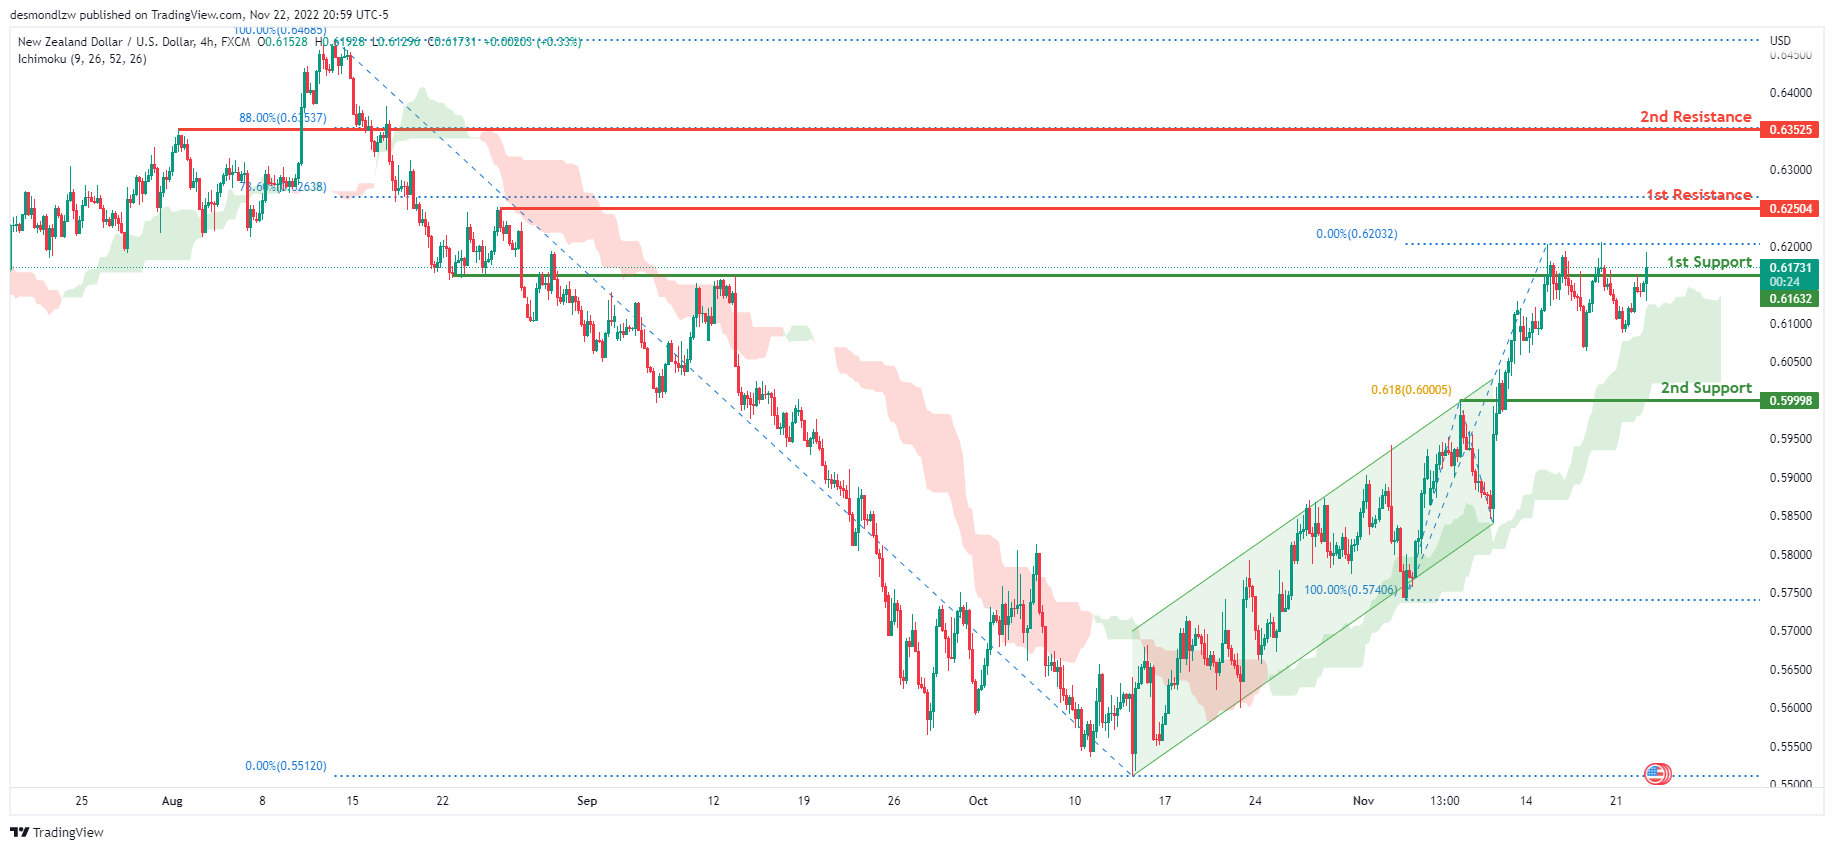
NZD/USD:
On the H4 chart, we have a bullish bias with the price moving above the Ichimoku cloud and has broken out of the ascending channel. If this bullish momentum continues, expect the price to head towards the 1st resistance line at 0.62504, where the 78.6% Fibonacci line is. Alternatively, the price may head back down and break the 1st support at 0.61632, where the previous swing high is located, before heading towards the 2nd support at 0.59998 where the 61.8% Fibonacci line is.
Areas of consideration:
- H4 time frame, 1st resistance at 0.62504
- H4 time frame, 1st support at 0.61632
- H4 time frame, 2nd support at 0.59998
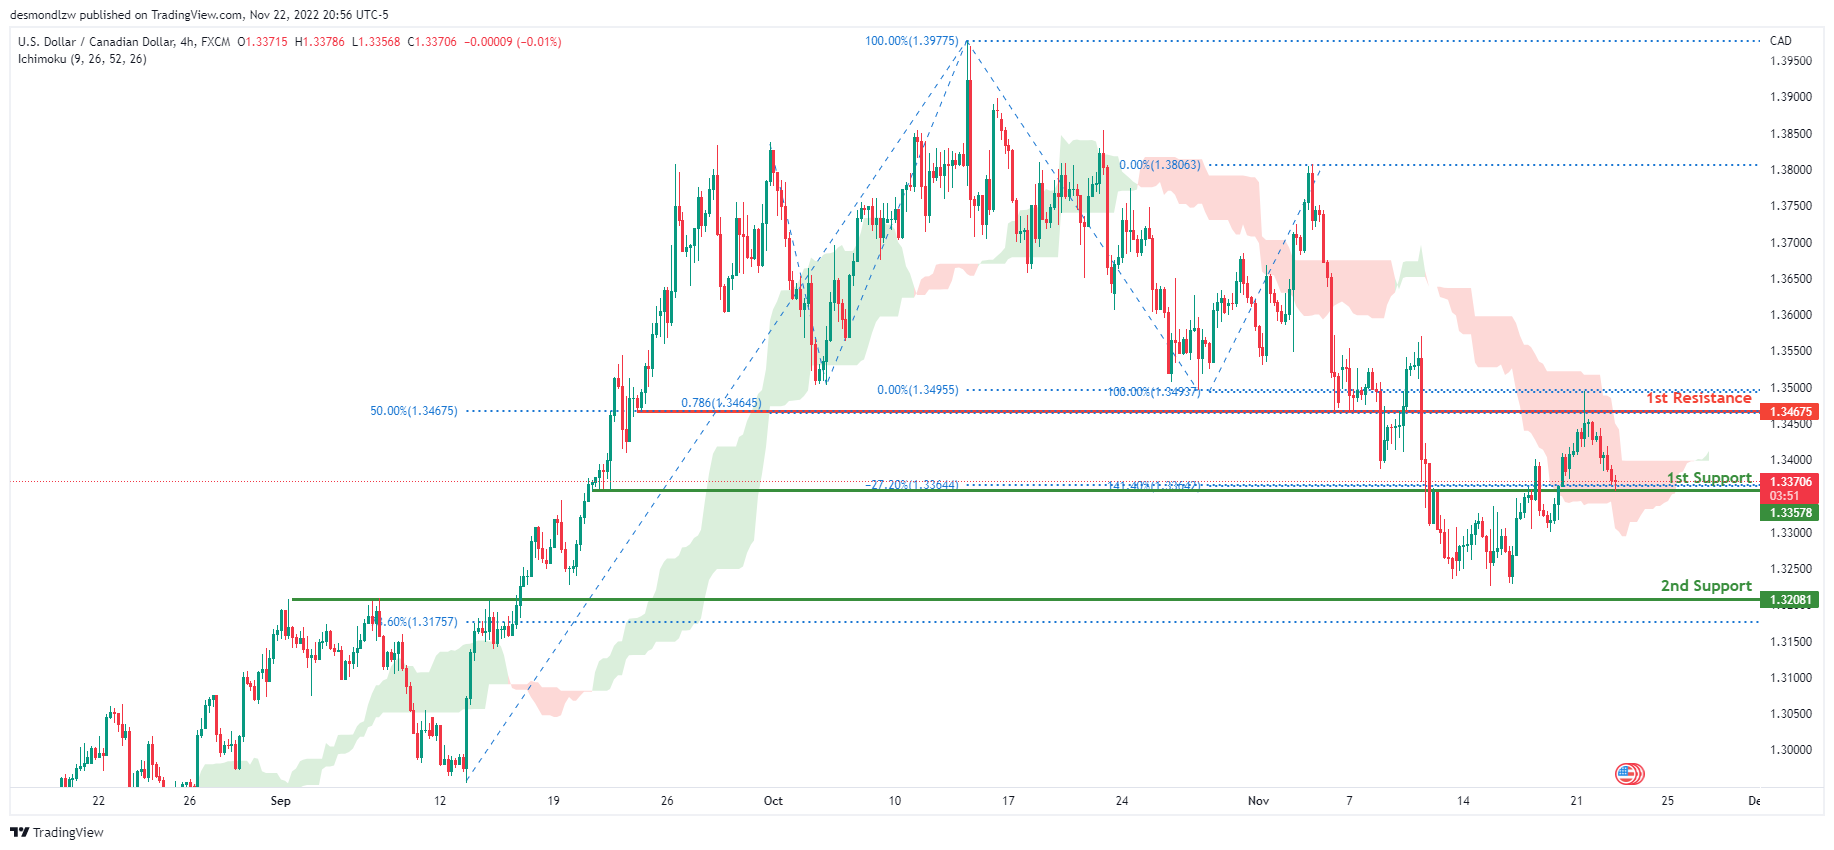
USD/CAD:
On the H4 chart, the overall bias for USDCAD is bearish. To add confluence to this, the price is crossing below the Ichimoku cloud which indicates a bearish market. If this bearish momentum continues, expect the price to break the 1st support line at 1.33578, where the -27.2% Fibonacci expansion line and 141.4% Fibonacci line is, before heading towards the 2nd support line at 1.32081 where the 78.6% Fibonacci line is located. In an alternative scenario, price could head back up to retest the 1st resistance line at 1.34675, where the 50% Fibonacci line and 78.6% Fibonacci projection line is.
Areas of consideration:
- H4 time frame, 1st resistance at 1.34675
- H4 time frame, 1st support at 1.33578
- H4 time frame, 2nd support at 1.32081
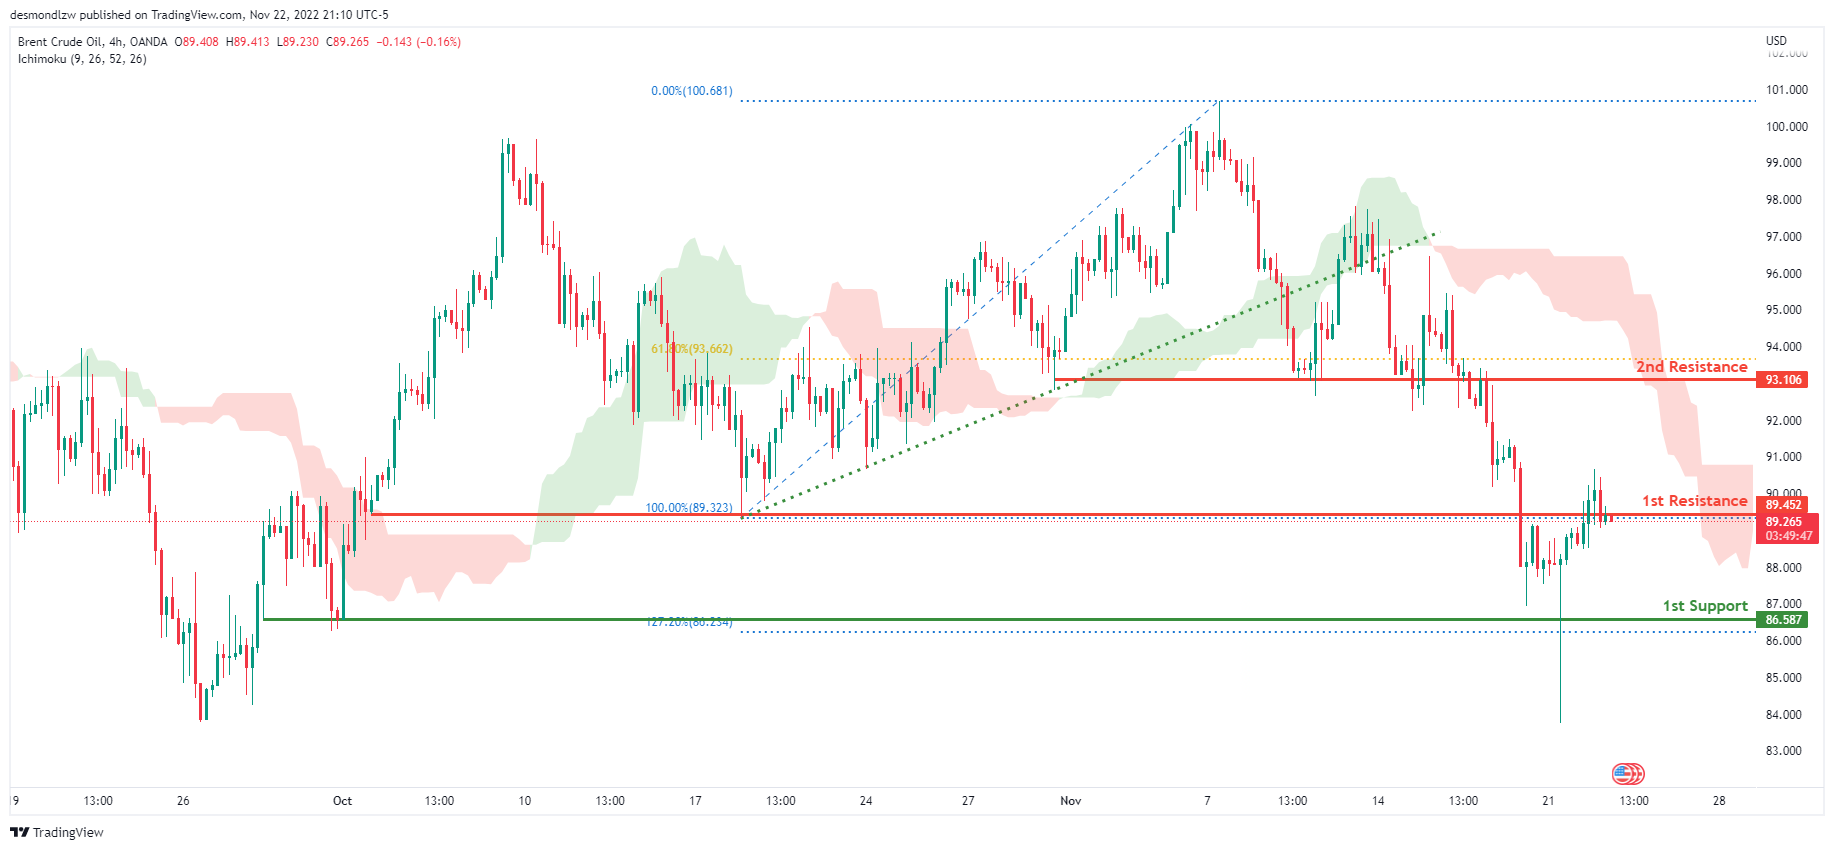
OIL:
Looking at the H4 chart, my overall bias for BCOUSD is bearish due to the current price being below the Ichimoku cloud, indicating a bearish market. If this bearish momentum continues, expect price to possibly head towards the 1st support at 86.587, where the 127.2% Fibonacci extension line is located. In an alternate scenario, price could possibly break the 1st resistance level at 89.452, where the previous swing low is located, before heading towards the 2nd resistance level at 93.106, where the 61.8% Fibonacci line is.
Areas of consideration:
- H4 time frame, 1st resistance at 89.452
- H4 time frame, 2nd resistance at 93.106
- H4 time frame, 1st support at 86.587
- H4 time frame, 2nd support at 89.452
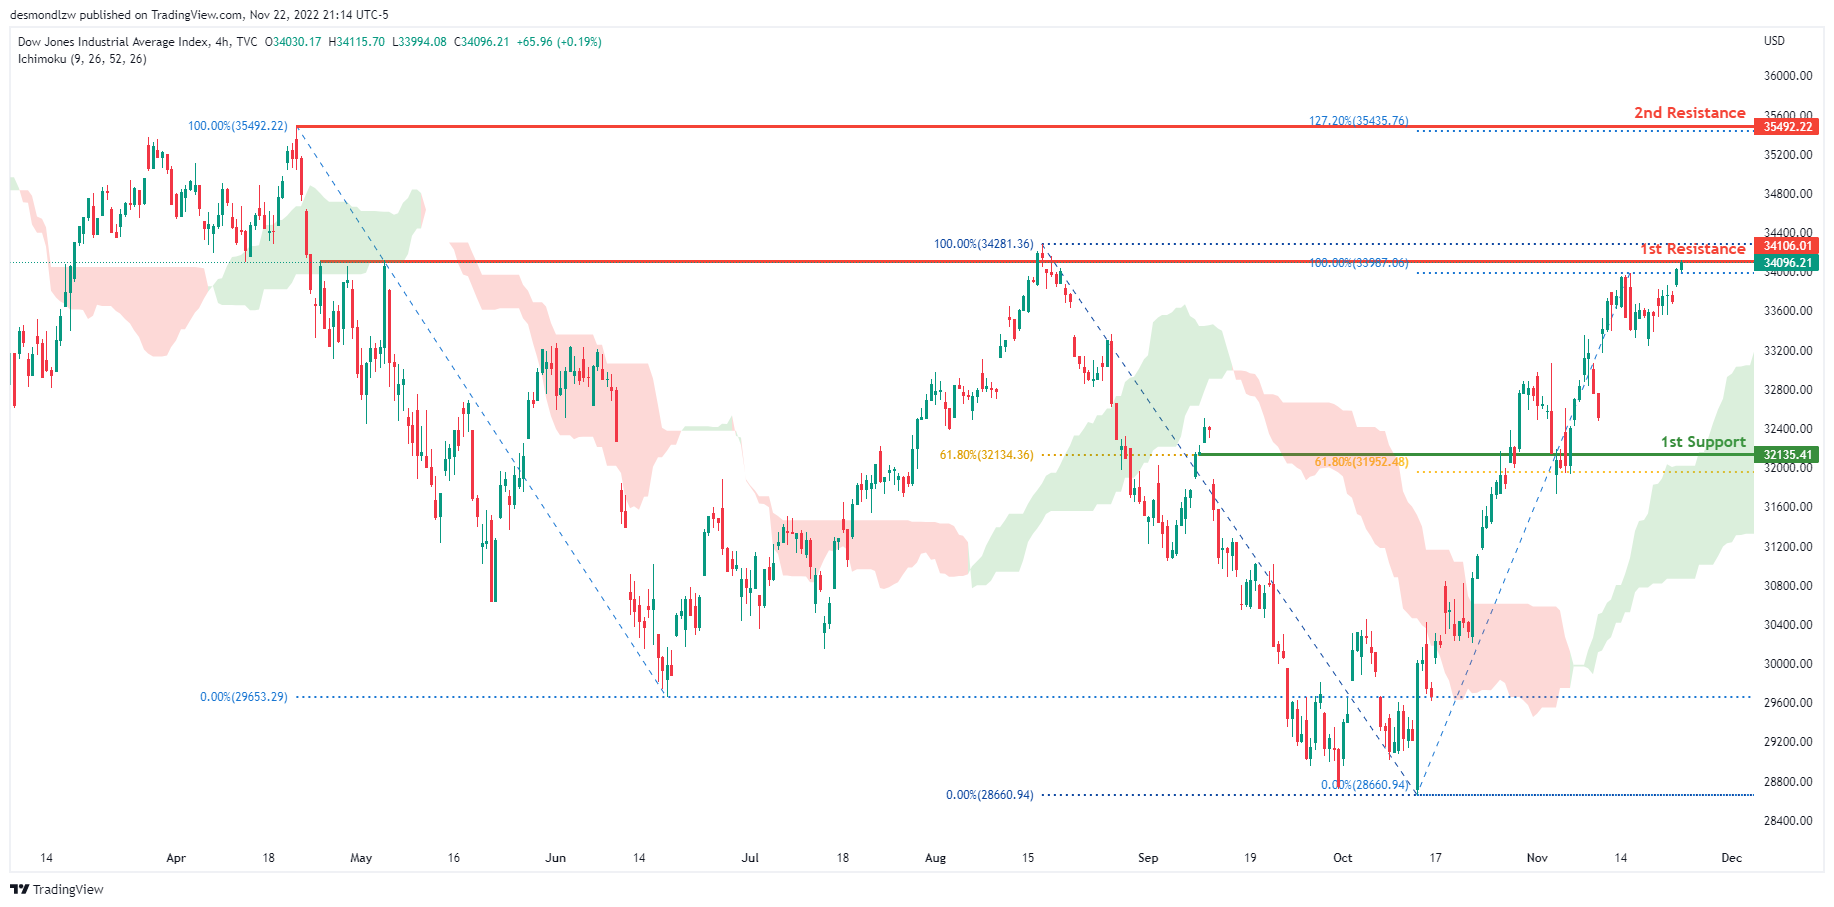
Dow Jones Industrial Average:
On the H4 chart, the overall bias for DJI is bullish. To add confluence to this, the price is above the Ichimoku cloud which indicates a bullish market. If this bullish momentum continues, expect the price to possibly break the 1st resistance at 34106.01 where the previous high and 100% Fibonacci line is located, before heading towards the 2nd resistance line at 35492.22, where the previous swing high and 127.2% Fibonacci extension line is. In an alternative scenario, price could head towards the 1st support line at 32135.41, where 2 of the 61.8% Fibonacci lines are located.
Areas of consideration:
- H4 time frame, 1st support at 32135.41
- H4 time frame, 1st Resistance at 34106.01
- H4 time frame, 2nd Resistance at 35492.22
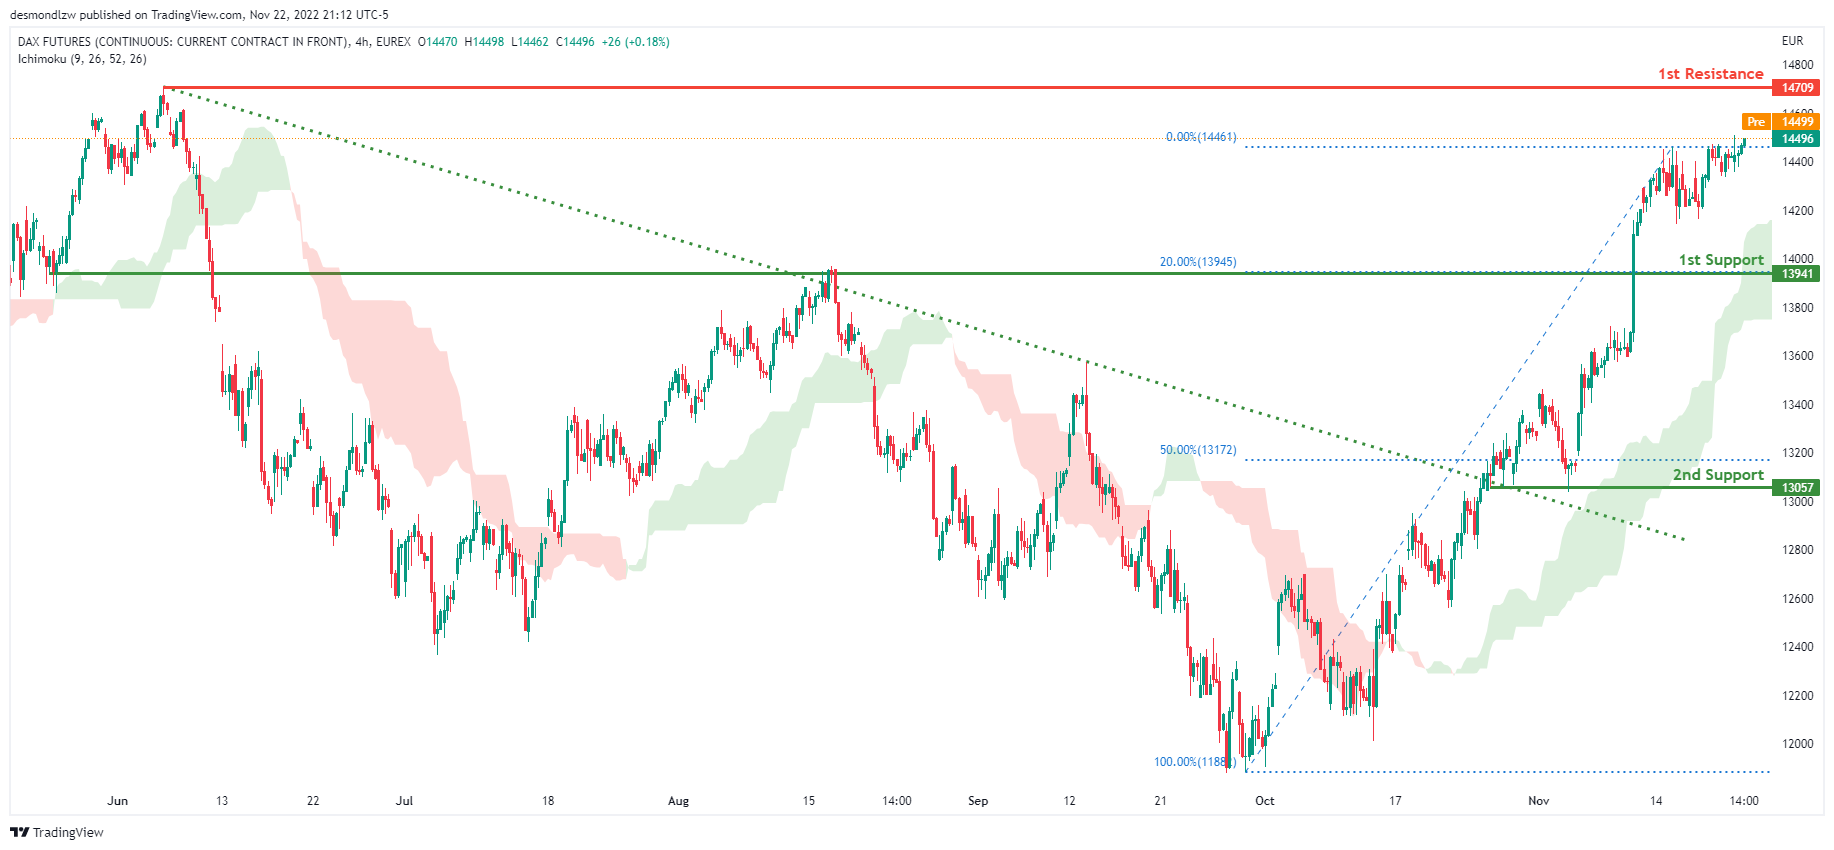
DAX:
The H4 chart shows a bullish bias, with price breaking through the descending trendline and rising above the Ichimoku cloud. Price is expected to maintain its bullish momentum and rise to the first resistance level at 14709, where the previous swing high is located. Alternatively, the price could fall to the first support level at 13941, which corresponds to the 20% Fibonacci line.
Areas of consideration:
- H4 time frame, 1st resistance is at 14709
- H4 time frame, 1st support is at 13941
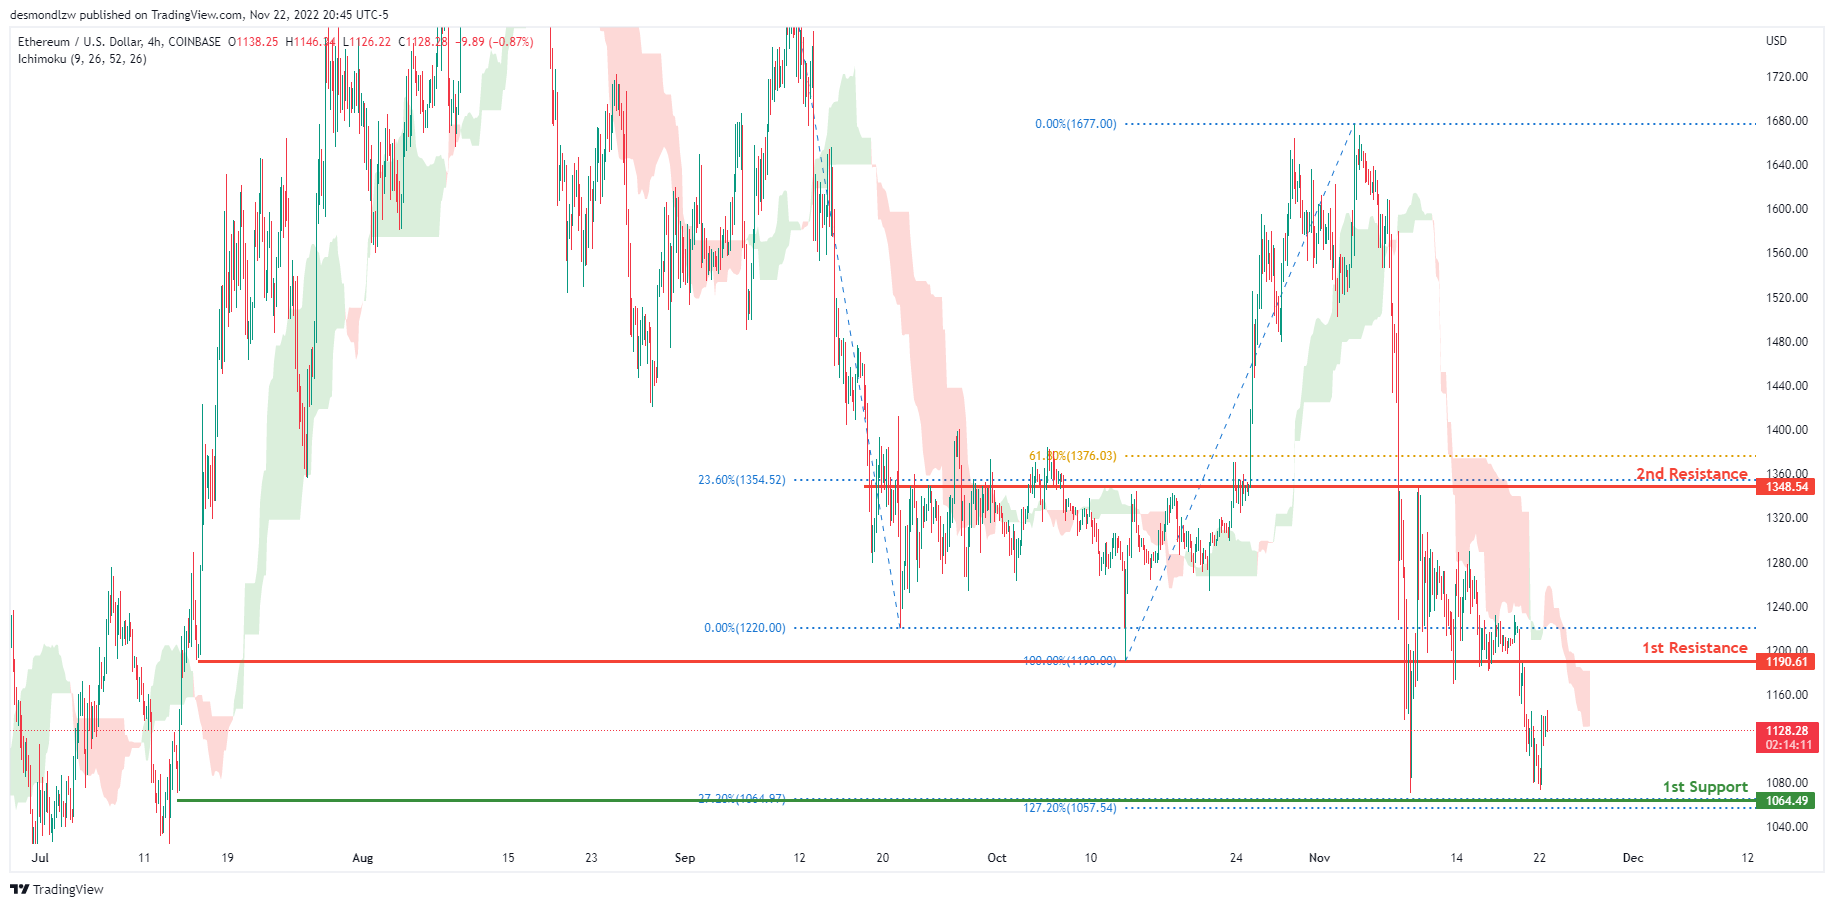
ETHUSD:
Looking at the H4 chart, my overall bias for XXX is bearish due to the current price being below the Ichimoku cloud, indicating a bearish market .If this bearish momentum continues, expect price to possibly head towards the 1st support at 1064.49, where the -27.2% Fibonacci expansion line and 127.2% Fibonacci extension line are located. In an alternate scenario, price could possibly head back up towards the 1st resistance level at 1190.61, where the previous swing low is located.
Areas of consideration:
- H4 time frame, 1st resistance of 1190.61
- H4 time frame, 1st support at 1064.49
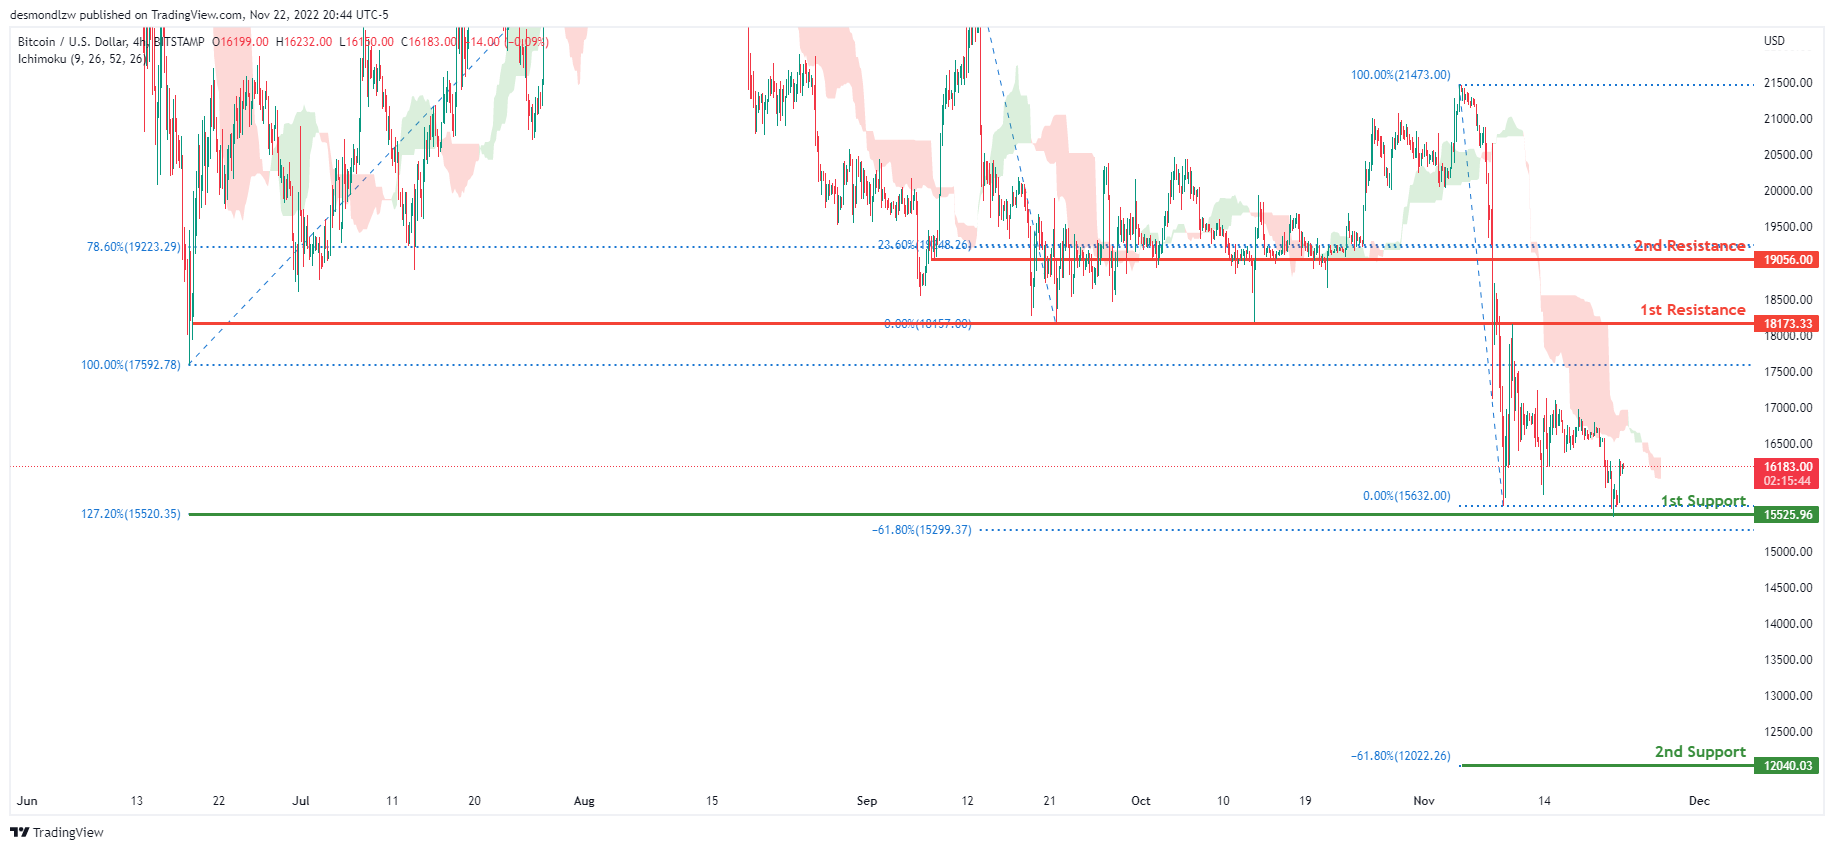
BTCUSD:
On the H4 chart, the overall bias for BTCUSD is bearish. To add confluence to this, the price is below the Ichimoku cloud which indicates a bearish market. If this bearish momentum continues, expect the price to head towards the 1st support line at 15525.96, where the 127.2% Fibonacci extension line and -61.8% Fibonacci expansion line is located. If price breaks the 1st support line, price could possibly head towards the 2nd support line at 12040.03 where the -61.8% Fibonacci expansion line is located. In an alternative scenario, price could head back up to retest the 1st resistance line at 18173.33, where the previous low and 0% Fibonacci line is located.
Areas of consideration:
- H4 time frame, 1st resistance 18173.33
- H4 time frame, 1st support at 15525.96
- H4 time frame, 2nd support at 12040.03
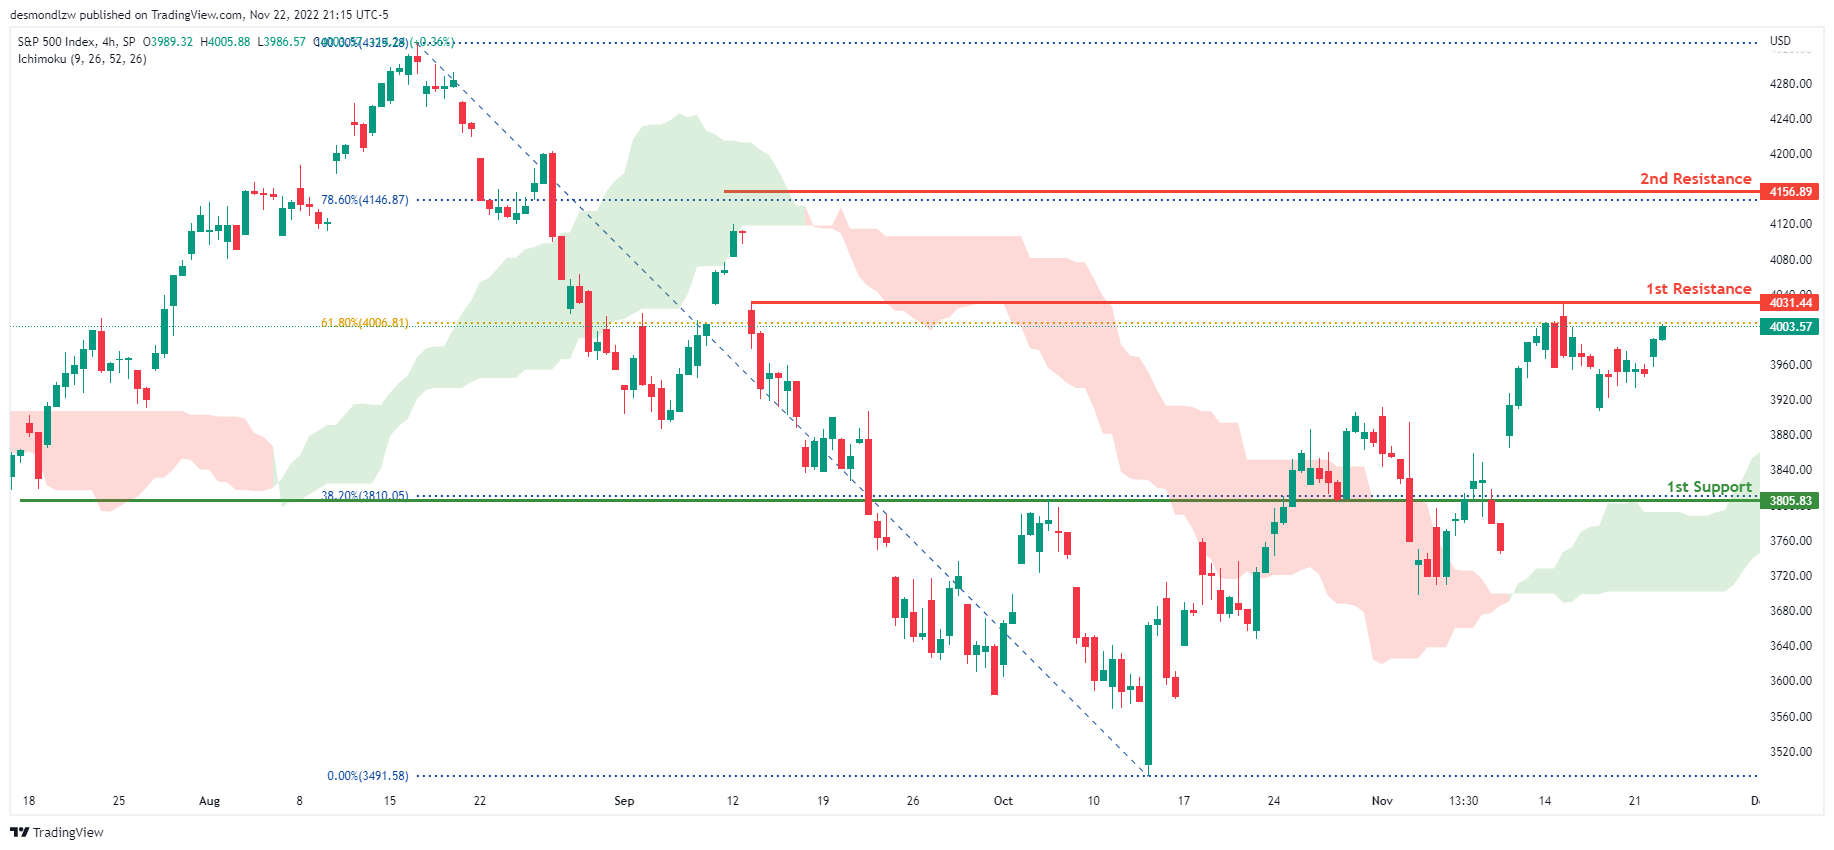
S&P 500:
The overall bias for the S&500 on the H4 chart is bullish, with prices above the Ichimoku cloud. If the bullish momentum continues, the price will rise to the first resistance line at 4011.74, where the 61.8% Fibonacci line is located. If the first resistance line is broken, the second resistance line is at 4119.28, which is the previous swing high and the 78.6% Fibonacci line. In an alternate scenario, price could return to the first support line at 3805.83, where the 38.2% Fibonacci line is located.
Areas of consideration:
- H4 time frame, 1st support at 3805.83
- H4 time frame, 1st resistance at 4011.74
- H4 time frame, 2nd resistance at 4119.28


